JavaScript Data Grid Comparison: 8 Popular Options Reviewed
I reviewed eight top JavaScript data grids and compared them by performance, customization, accessibility, cost, integration, and devX.
Join the DZone community and get the full member experience.
Join For FreeWhy does choosing the right JavaScript Data Grid still matter in 2026? Data grids remain a cornerstone of web applications: dashboards, admin panels, CRMs, analytics, and enterprise systems all rely on them. The choice of the right grid still defines performance, customization flexibility, accessibility, and cost.
To find which grid fits your needs, I reviewed eight top JavaScript data grids and compared them by performance, customization, accessibility, cost, integration, and devX.
To make the comparison more practical and memorable, I’ve added a short “Did you know?” fact to each grid. These highlight unique traits, quirks, or lesser-known details that help readers quickly distinguish one grid from another.
1. Webix Grid
Webix Grid is arguably one of the most underrated JavaScript components for enterprise-scale applications. Originally part of the broader Webix UI library, but is now available as a standalone datagrid. It’s widely used for dashboards, admin panels, and complex data-driven applications.
Did you know? Webix Grid has been around since 2013 and still ranks among the fastest grids on the market — rendering 100,000 rows in just ~17 ms. It even comes with a visual Skin Builder tool for instant theme customization.
- Best for: enterprise dashboards, complex data-driven apps
- Key features: frozen rows, Excel-like filters, grouping & colspans, Skin Builder for theming
- Performance: the benchmark leader (100,000 rows init render time – 17 ms)
- Customization: flexible APIs, custom editors/templates, Skin Builder
- Accessibility: WAI-ARIA, keyboard navigation, high-contrast skin
- Cost: Free (GPL) / Pro from $749
- DevX: solid documentation, moderate learning curve, official integrations (React/Angular/Vue)
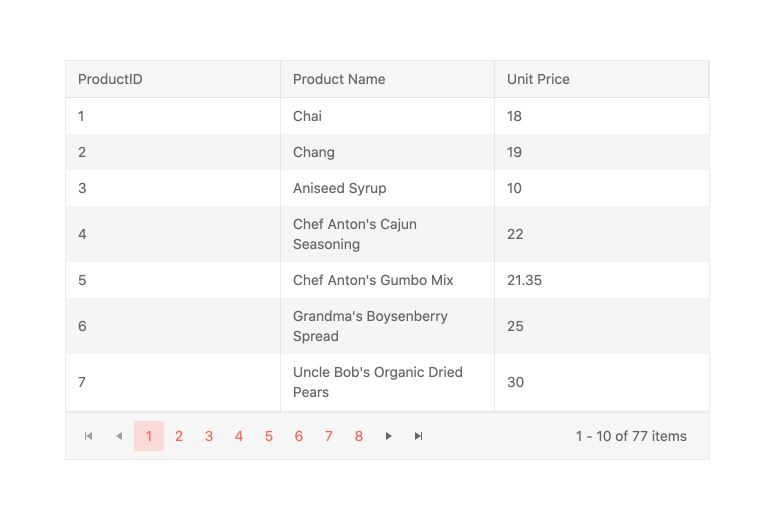
2. Tabulator
Tabulator is a free, open-source JavaScript data grid component commonly used for dashboards, admin panels, and general-purpose data tables. Its highly modular design allows developers to easily add custom formatters, editors, and themes.
Did you know? Tabulator is completely free under the MIT license with no hidden Enterprise edition. Its community has built a wide ecosystem of plugins, and it even supports Excel-style copy-paste out of the box.
- Best for: startups, open-source projects, cost-sensitive solutions
- Key features: modular design, custom formatters/editors, MIT license
- Performance: solid with medium datasets; large column sets slow rendering
- Customization: very high, through API and plugins
- Accessibility: ARIA roles, but some WCAG gaps
- Cost: completely free (MIT)
- DevX: easy to start, community wrappers for React/Angular/Vue
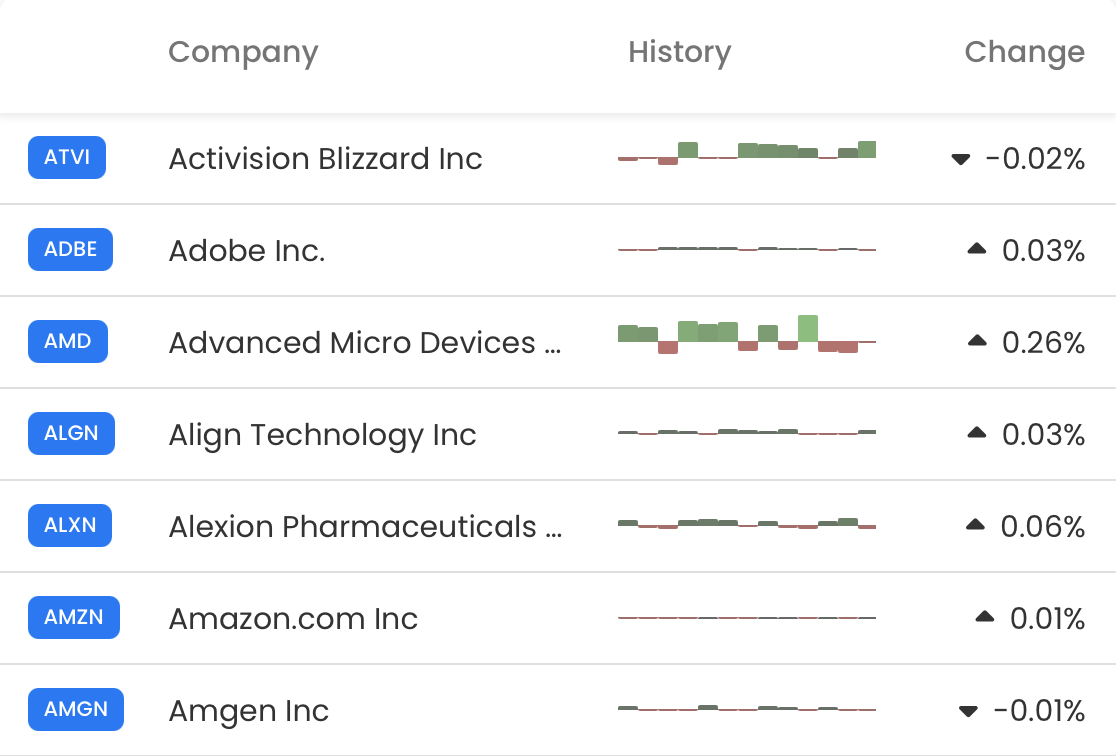
3. AG Grid
AG Grid is a high-performance JavaScript datagrid, widely adopted in financial dashboards, analytics platforms, and large-scale enterprise applications. Known for its extensive capabilities that can genuinely blow your mind. From advanced row models to complex filtering, pivoting, and live updates, AG Grid is one of the most powerful tools in its category.
Did you know? AG Grid is trusted by financial giants like Bloomberg and Goldman Sachs. But beware: if your Enterprise license expires, the grid will display watermarks inside your app — a rare but strict enforcement tactic.
- Best for: financial dashboards, high-load analytics platforms
- Key features: pivoting, server-side row model, integrated charts, Excel-like operations
- Performance: high performance
- Customization: custom cells, editors, renderers, Theme Builder
- Accessibility: full WCAG compliance
- Cost: Free (Community) / Enterprise from $999 (+ deployment fees)
- DevX: extremely flexible but steep learning curve; strong community
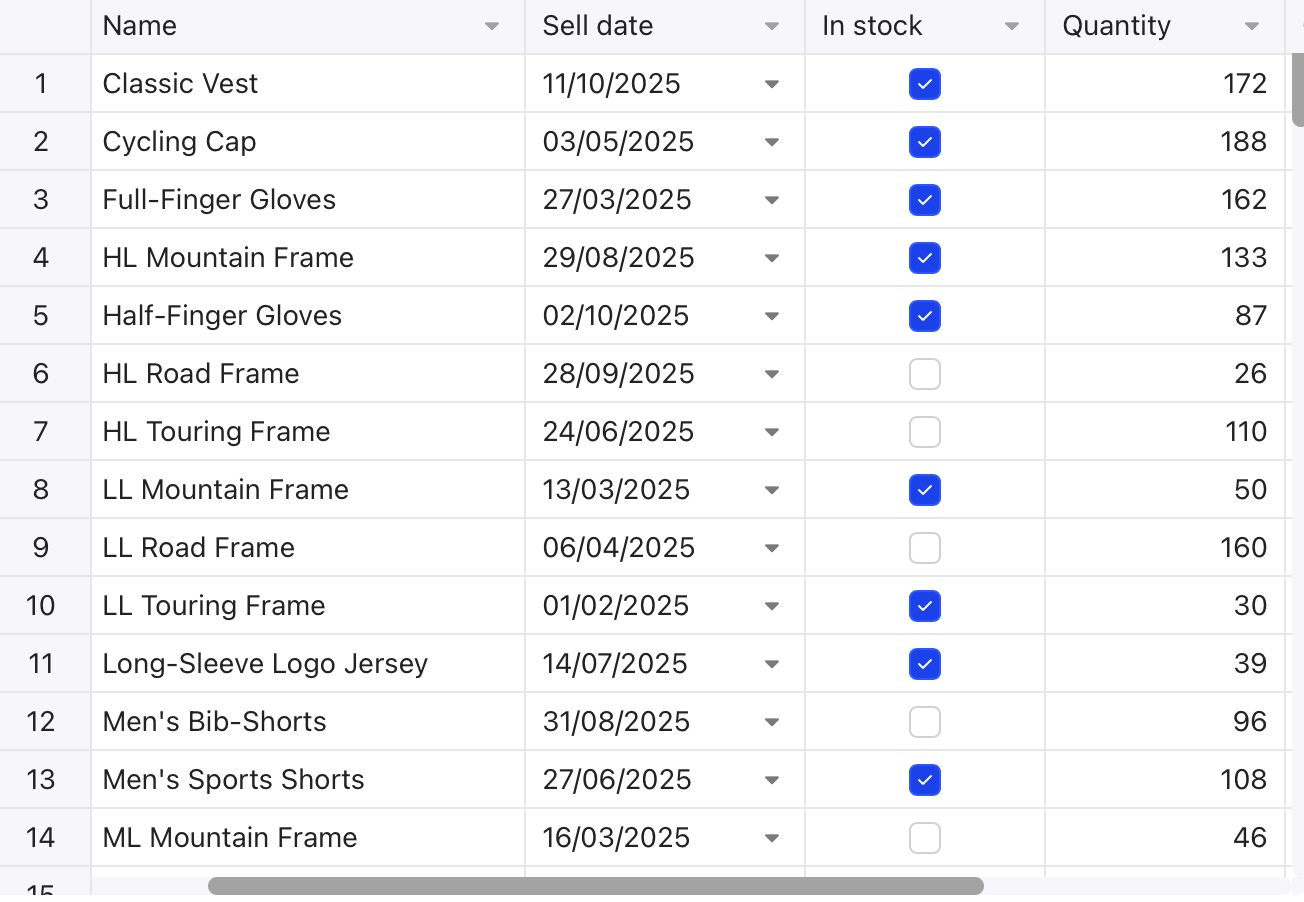
4. DHTMLX Grid
DHTMLX Grid is a lightweight, efficient JavaScript grid ideal for building responsive web applications and admin interfaces. It is commonly used in dashboards, CRM systems, and other data-heavy web apps.
Did you know? DHTMLX Grid is one of the few that natively support TreeGrid structures and spreadsheet-like editing. It’s especially popular in CRM systems and lightweight admin tools.
- Best for: lightweight admin apps, CRM, responsive web apps
- Key features: split mode (frozen columns), Excel/PDF export, tree grid
- Performance: efficient with virtual scrolling
- Customization: configurable templates, editors, styling
- Accessibility: basic (keyboard only)
- Cost: Free (GPL) / Pro from $749
- DevX: modular architecture, lightweight by design
5. Bryntum Grid
Bryntum Grid is a specialized JavaScript grid most often used in project management and scheduling applications, including Gantt charts, resource planners, and complex enterprise scheduling tools. Its primary audience is teams building applications where data visualization tightly integrates with task and resource planning.
Did you know? Bryntum Grid shares its core with the company’s Gantt chart, making it uniquely powerful for scheduling and project management use cases. It even ships with built-in resource planners that few competitors can match.
- Best for: project management, Gantt, resource planning
- Key features: complex grouping, Excel-like drag-fill, Excel/PDF export, Gantt integration
- Performance: Performs a little bit lower than peers
- Customization: 5 themes, API-based extensions
- Accessibility: ARIA, keyboard support
- Cost: Commercial from $850
- DevX: niche-focused with powerful scheduling API
6. Kendo UI Grid
Kendo UI Grid is a JavaScript grid component from Telerik, designed for enterprise web applications, dashboards, and internal tools. It provides advanced features such as filtering, grouping, paging, and theming.
Did you know? Kendo UI Grid has been around since 2009 and integrates tightly with Telerik’s reporting and charting ecosystem. It’s famous for being an all-in-one enterprise solution — powerful, but with a price tag that stings.
- Best for: enterprise web apps, corporate dashboards
- Key features: Excel/PDF export, hierarchical grids, advanced filtering
- Performance: Excellent performance
- Customization: rich built-in functionality + theming
- Accessibility: WCAG + Section 508
- Cost: part of Telerik Kendo UI bundle (from $899)
- DevX: excellent documentation, mature ecosystem, official support for Angular/React/Vue
7. Handsontable
Handsontable is a JavaScript spreadsheet-like grid component designed to emulate Excel functionality within web applications. It is widely used in financial applications, data-entry forms, and any scenario where spreadsheet interactions are critical.
Did you know? Handsontable is the closest thing to Excel inside a browser, complete with its own formula engine. It’s widely used in data-heavy apps ranging from financial tools to scientific research.
- Best for: Excel-like UI, finance, data-entry workflows
- Key features: formulas, merge cells, conditional formatting, rich cell types
- Performance: optimized for medium datasets
- Customization: advanced editing and formulas
- Accessibility: improving but still behind leaders
- Cost: Commercial from $899
- DevX: intuitive, low entry barrier
8. DevExtreme Data Grid
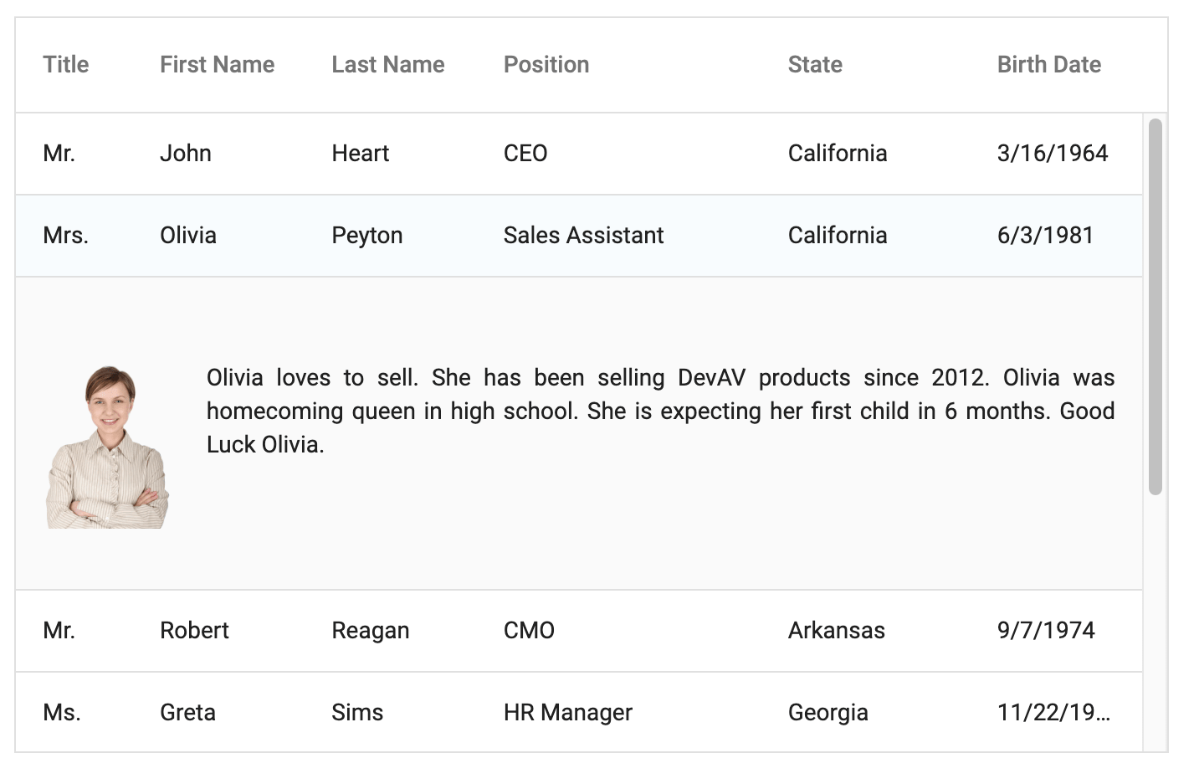
DevExtreme Data Grid is a JavaScript grid component designed for enterprise web applications, dashboards, and analytics platforms. It excels at handling large datasets with virtual scrolling and offers advanced features such as grouping, filtering, and templating.
Did you know? DevExtreme is one of the only grids offering a built-in PivotGrid component, bringing OLAP-style summaries to the web. It also maintains parity across React, Angular, Vue, and even jQuery.
- Best for: enterprise dashboards, analytics at massive scale
- Key features: pivot grids, Excel/PDF export, master-detail, advanced templating
- Performance: near-instant scrolling with millions of rows (virtual rendering)
- Customization: advanced templating, grouping, custom editors, theming
- Accessibility: strong ARIA support, improved screen reader compatibility
- Cost: Commercial ~ $899/year
- DevX: official React/Angular/Vue components, well-documented
Comparison Table
| grid | performance | customization | accessibility | free | cost (PRO) | best for |
|---|---|---|---|---|---|---|
|
Webix |
Highest |
High |
Good |
✔️ |
$749 |
Enterprise apps |
|
Tabulator |
Medium (column-heavy slows down) |
High |
Medium |
✔️ |
Free |
Startups, OSS |
|
AG Grid |
High |
Very high |
Excellent |
✔️ |
$999+ |
Financial dashboards |
|
DHTMLX |
Fast (virtual scroll) |
Medium | Basic |
✔️ |
$749 |
CRM, admin apps |
|
Bryntum |
Medium |
High (niche) |
Basic |
❌ |
$850 |
Scheduling, Gantt |
|
Kendo UI |
High |
High |
Excellent |
❌ |
$899 |
Enterprise apps |
|
Handsontable |
Medium |
High |
Medium |
❌ |
$899 |
Excel-like apps |
|
DevExtreme |
Near-instant (virtual rendering) |
High |
Excellent |
❌ |
~$899/year |
Large datasets |
Recommendations for Choosing a Data Grid
- Need open-source and free → Tabulator
- Maximum performance at scale → Webix
- Financial dashboards/analytics → AG Grid
- Excel-like UI → Handsontable
- Project planning/Gantt → Bryntum
- Enterprise with strict WCAG/508 → Kendo or DevExtreme
Final Thoughts
The right grid depends on your priority — performance, flexibility, licensing, or accessibility. The landscape is mature: from free Tabulator to premium enterprise solutions like AG Grid Enterprise and Webix.
Opinions expressed by DZone contributors are their own.
Comments