JMeter + ElasticSearch Live Monitoring
This plugin for JMeter asynchronously sends JMeter’s sample results to an ElasticSearch engine for performance monitoring. Learn how to get started.
Join the DZone community and get the full member experience.
Join For FreeToday, I want to talk about performance testing. More specifically, I want to get into performance testing with JMeter, ElasticSearch, and Grafana. Let’s get right into it.
Almost a year ago, at work, I was asked to do some research into the ElasticStack. We needed a solution to enable live monitoring of JMeter tests in Non-GUI mode. After a few searches on Google, GitHub, and StackOverflow, I came across multiple solutions. The only thing is that they had missing functionalities. So, I decided to create this plugin (initially based on this, but it was reworked from the ground up and became its own entity). What the plugin does is it asynchronously sends JMeter’s sample results to an ElasticSearch engine — as simple as that.
This plugin is not meant to be “better” or “greater” than the InfluxDB + Grafana or Graphite + Grafana combo. It is simply an alternative solution.
This tutorial assumes you have an up-and-running instance of ElasticSearch and Grafana. The plugin supports any ElasticSearch version as it uses the low-level REST client.
Installation and Configuration
Installing the plugin is very easy since it’s available on the Plugins Manager. All you need to do is install the JMeter Plugins Manager and then install the plugin “ElasticSearch Backend Listener.” Now let’s add it to your test plan and configure it.
- Add a new backend listener to your test plan
- Change the implementation to “io.github.delirius325.jmeter.backendlistener.elasticsearch”
- Adjust the fields “es.scheme”, “es.host”, “es.port”, and “es.index” to your ElasticSearch engine and index information.
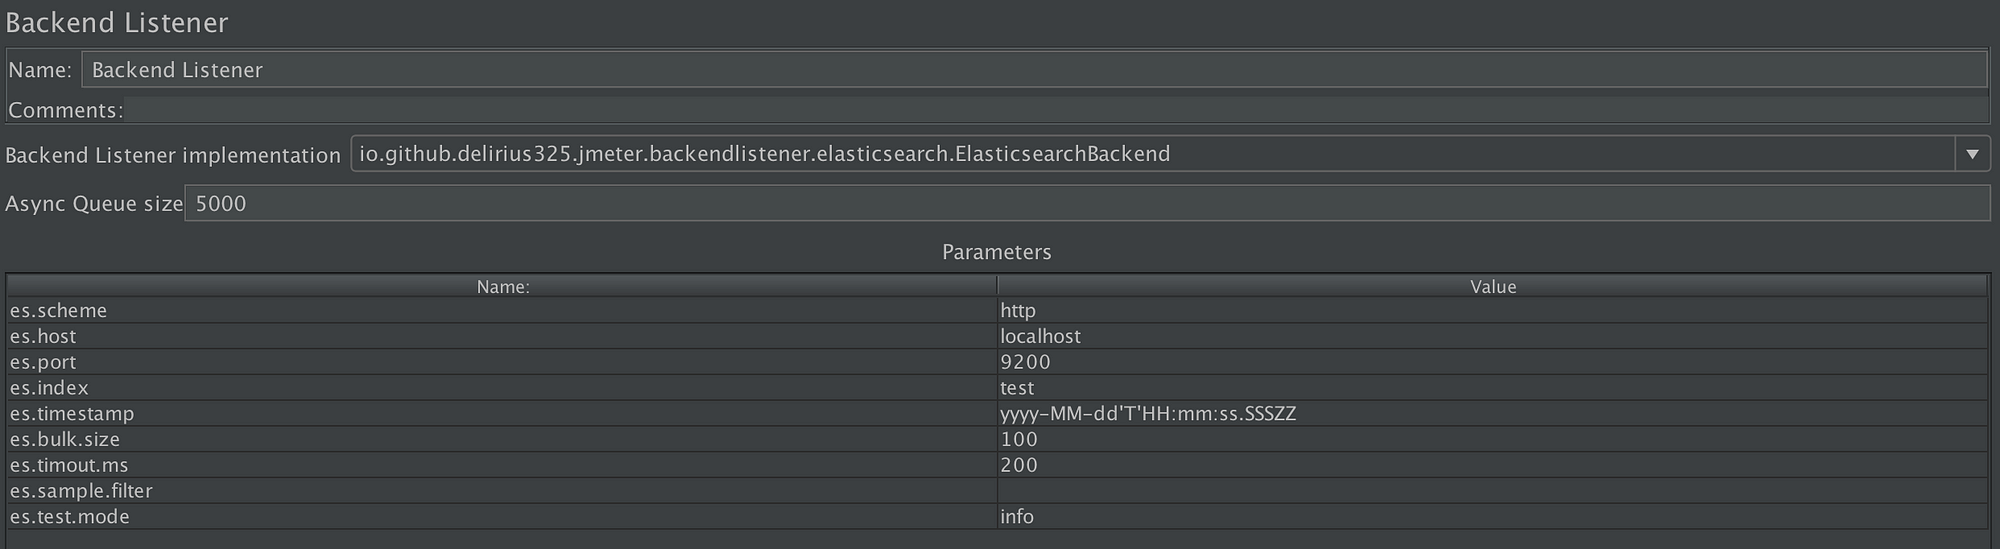
Sample Backend Listener configuration.
That’s it for the basic configuration! As you’ve set it up right now, executing the tests would send the results to ElasticSearch. But we still have some more things we need to take care of...!
Creating the Data Source on Grafana
First open up Grafana (if you’re experimenting locally: http://localhost:3000/).
- On the left-side menu, hover over the “gear” icon and click on “Data Sources”
- Click on the green “Add data source” button
- Fill the field “name,” let’s call it “test”
- Change the type to “ElasticSearch”
- Change the “url” field: “http://localhost:9200”
- Scroll to the bottom and fill the index field: “test”
- Change the “Time field name” to “Timestamp”
- Change the version to the one you’re using, most likely “5.6+”
- Click the green “Save & Test” button
Importing the Grafana Dashboard
- On the left-side menu, click on the “+” icon and then on “Import”
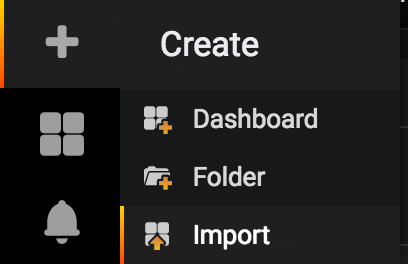
Import button.
2. In the “Or paste JSON” text area, paste this JSON data
3. Click on the blue “Load Button”
Start the Test!
Go back to JMeter and start your test! (if you need a sample JMX file, download this one). Once the test is started, go back to Grafana and you should see something like this:
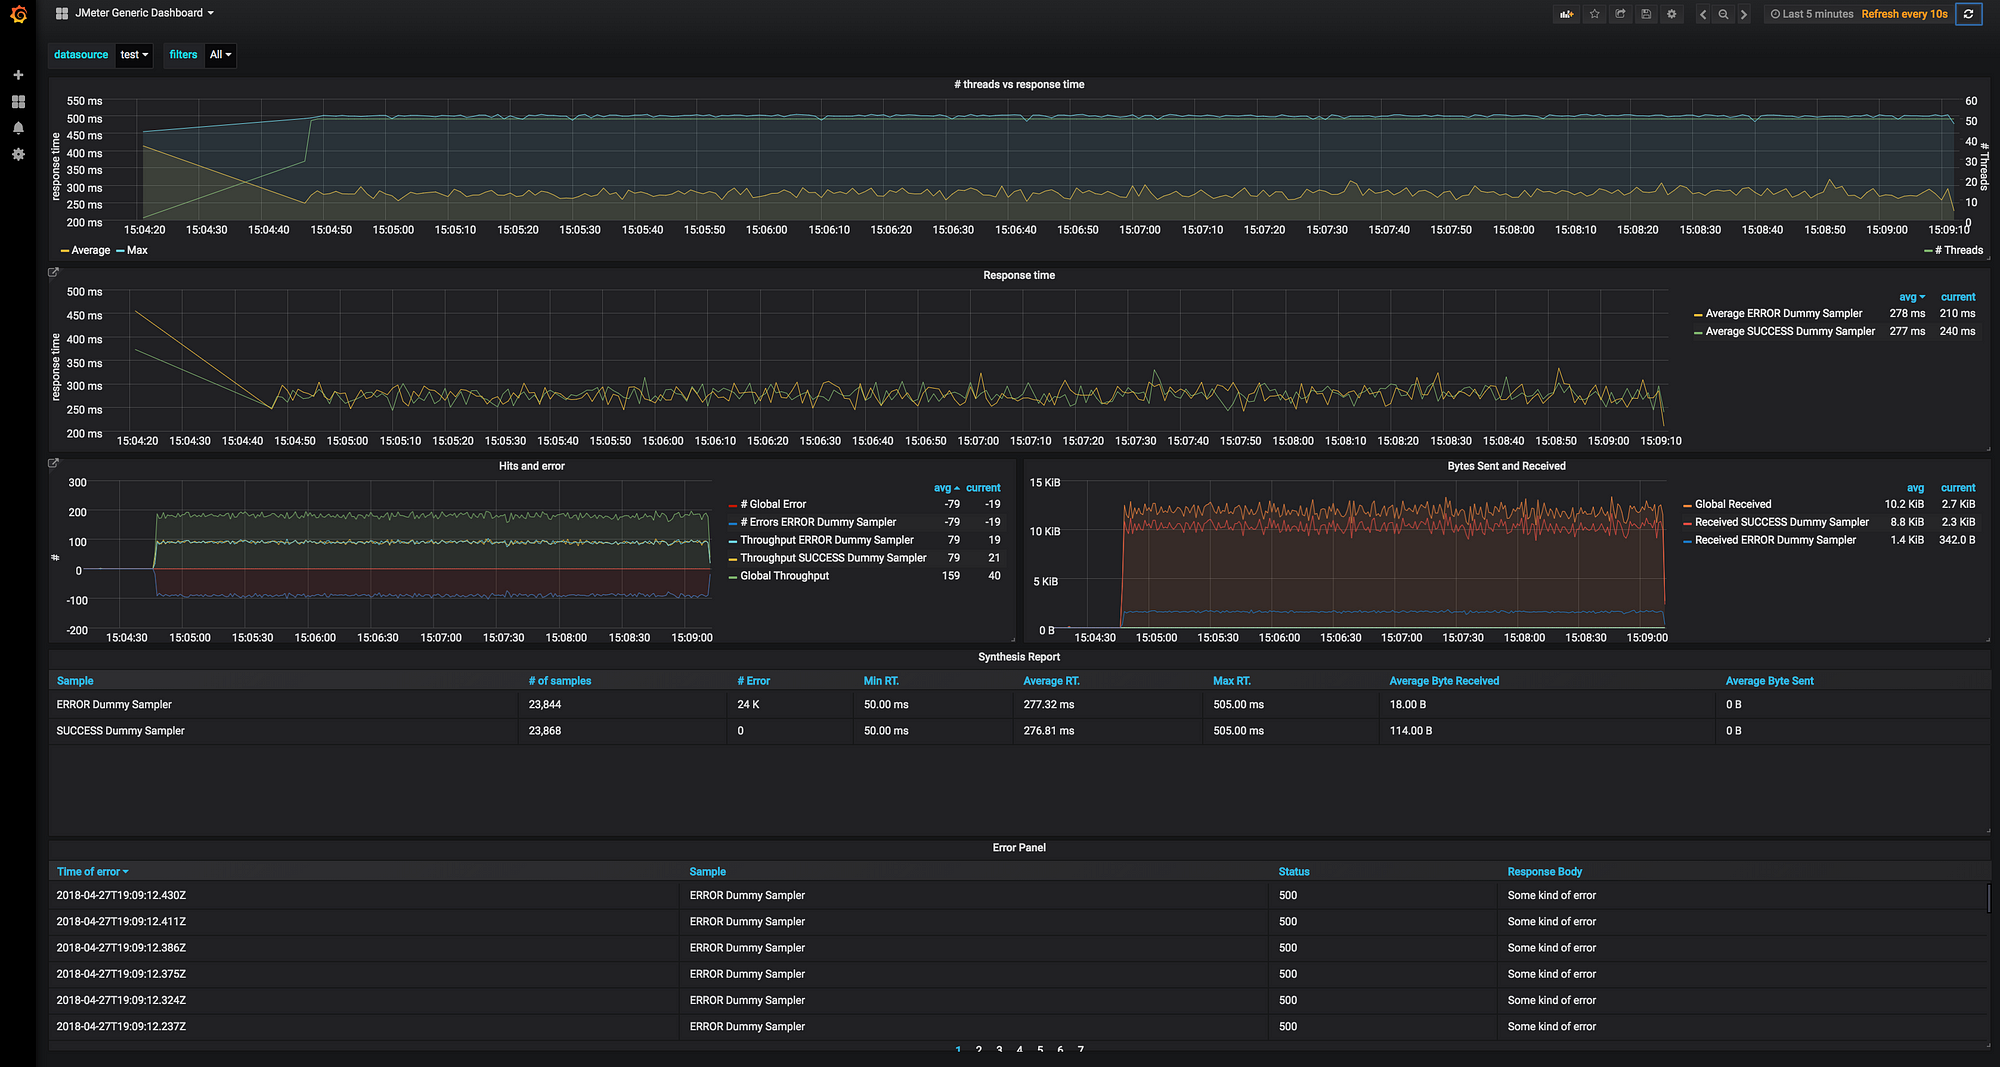
Grafana JMeter Generic Dashboard.
Advanced Features of the Plugin
The plugin has a few advanced features that can be useful in a multitude of circumstances :
Bulk Requests
To avoid making constant requests to the ElasticSearch engine, the plugin adds the results to a list until it reaches a certain amount. That certain amount is defined by the “es.bulk.size” parameter. The lower the value of this parameter, the faster your results will be sent to the ES engine — at the potential cost of impacting your test results.
Filters
You might want to send only certain samples to the ElasticSearch engine. That’s possible through the “es.sample.filter” parameter. All you need to do is specify them in one of (or a mix of) the following manners:
filter1;filter2;filter3or
filter1_samples_must_contain_this;filter2;filter3Detail Modes
The plugin supports three different detail modes. Detail modes define what and how the plugin will send certain information to the ES engine. Here are the three modes.
- info: sends the request body and headers, as well as the response body and headers for samplers that resulted in errors.
- debug: sends the request body and headers, as well as the response body and headers for all samplers.
- quiet: will not send any request or response body/headers.
Update!
As of version 2.3.0, the plugin now supports a new mode:
4. error: will only send the data of the failing samplers to the ElasticSearch engine
Continuous Integration (CI) Support
If you’re using this plugin in your CI environment, you’ll probably want to know the performance trend of your application. You’ll be happy to hear that this plugin supports the use of build numbers. All you have to do is provide your JMeter command line execution with the correct property.
Here’s a little guide for Jenkins, CircleCI, and TravisCI.
Personally, I’ve developed a Jenkins Groovy pipeline that executes the tests on dynamically provided Docker containers. 90% of the process is therefore automated and I basically never open up a terminal to launch tests anymore.
Maven
The plugin is available on Maven, again this can be very useful for your continuous integration environment. Here is the XML to add to your pom file:
<dependency>
  <groupId>io.github.delirius325</groupId>
  <artifactId>jmeter.backendlistener.elasticsearch</artifactId>
  <version>2.4.3</version>
</dependency>
Conclusion
So there you have it, this is how you can enable live monitoring of JMeter tests with ElasticSearch. I try to update the plugin with bug fixes and improvements as much as I can.
If you have any questions, suggestions, or comments, feel free to communicate with me!
Opinions expressed by DZone contributors are their own.
Comments