When Kubernetes Says "All Green" But Your System Is Already Failing
Learn about how standard cluster observability misses the failure signals that matter most during real incidents, outages, and postmortems.
Join the DZone community and get the full member experience.
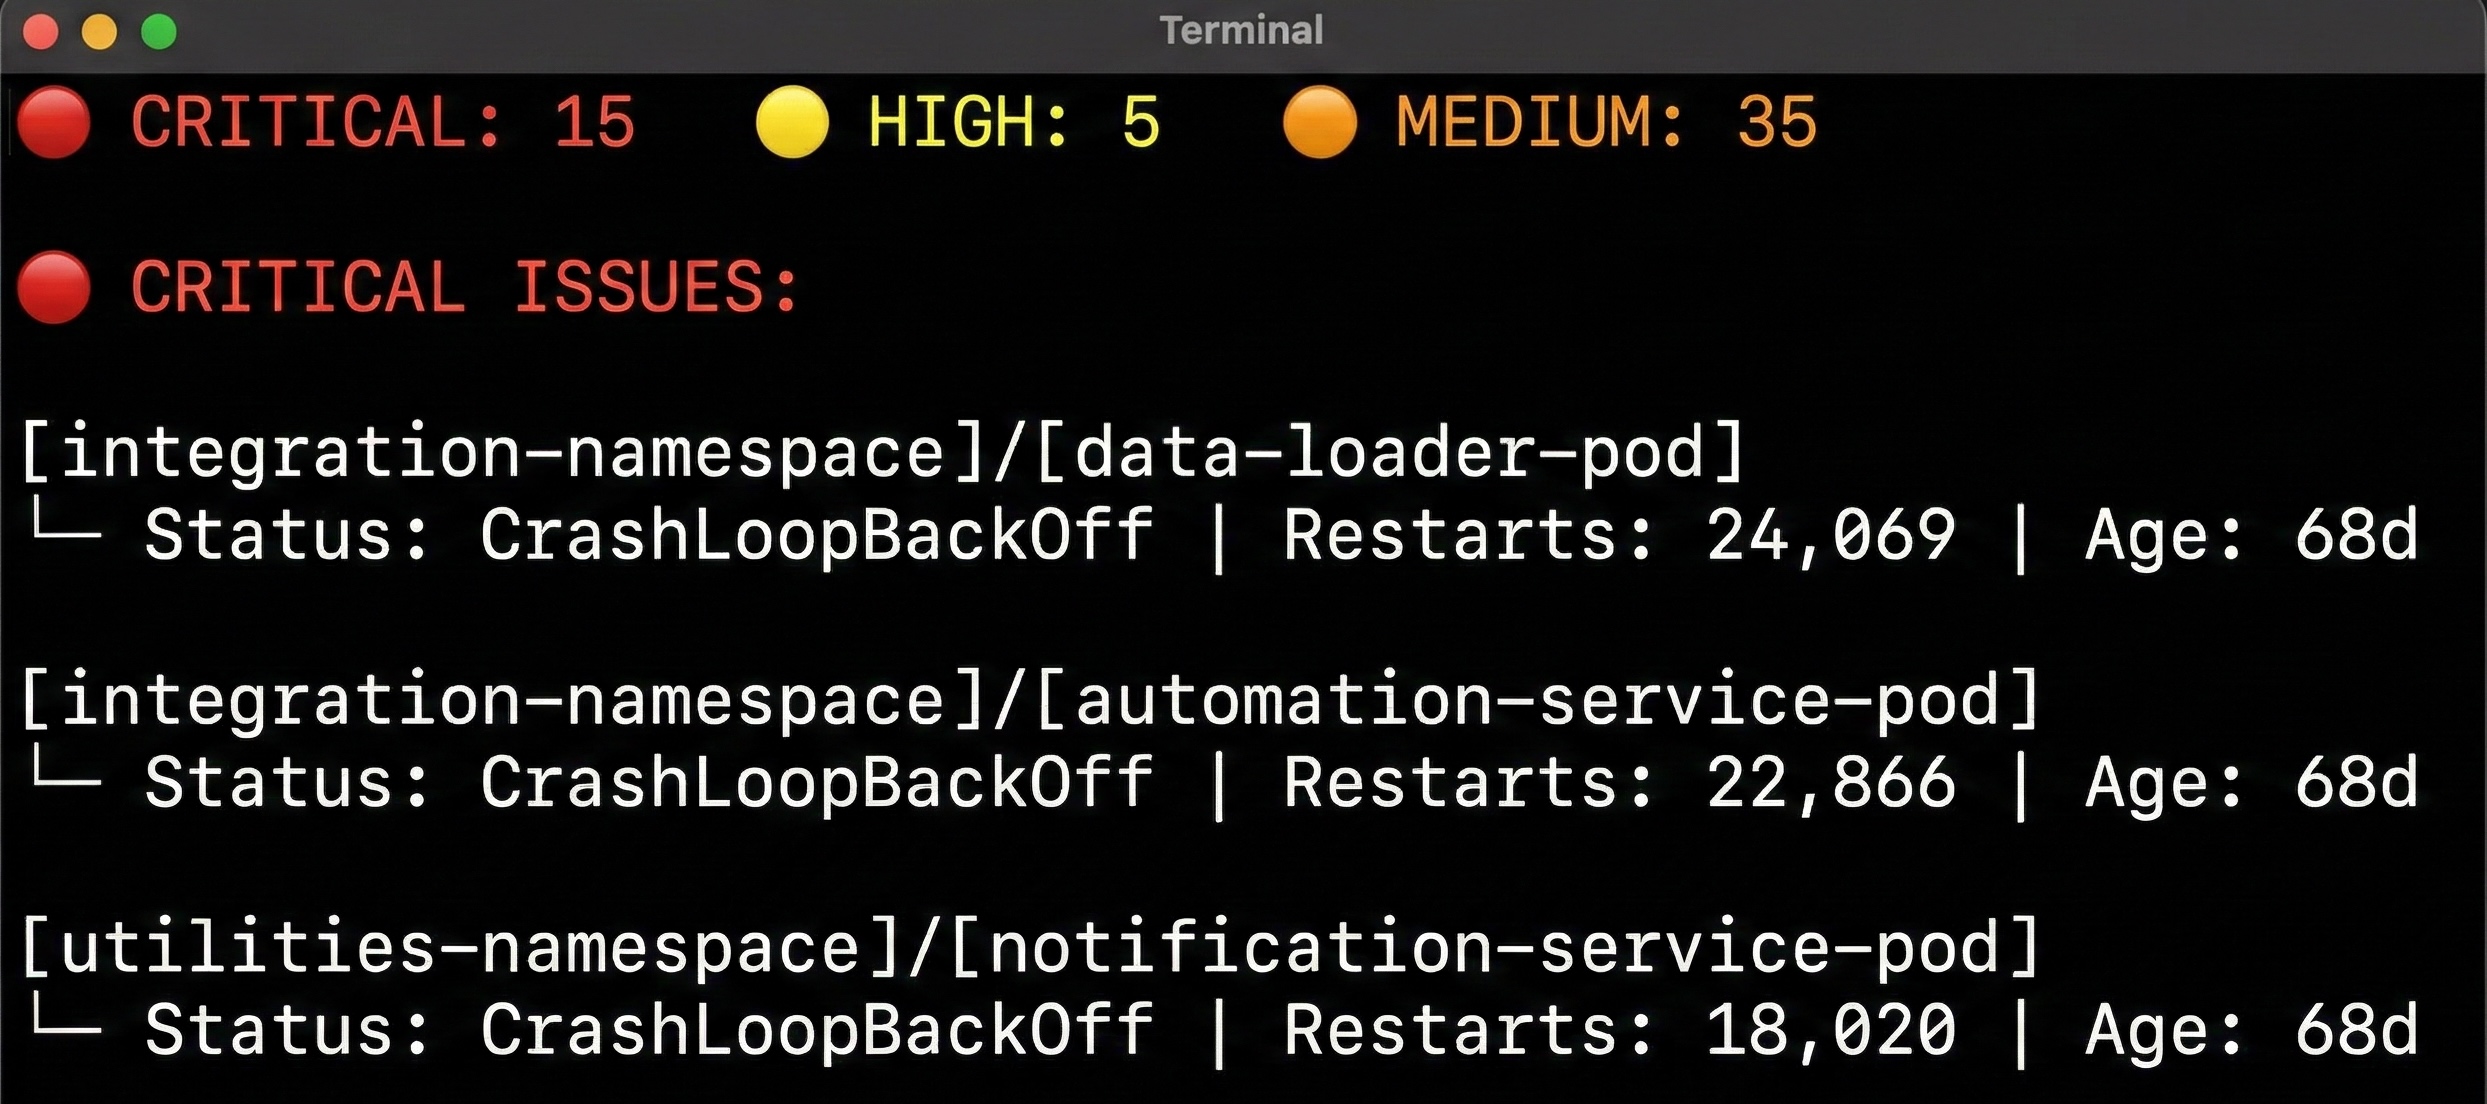
Join For FreeIt's not a theoretical scenario. The cluster health checks all come back "green." Node status shows Ready across the board. Your monitoring stack reports nominal CPU and memory utilization. And somewhere in a utilities namespace, a container has restarted 24,069 times over the past 68 days — every five minutes, quietly, without triggering a single critical alert.
That number — 24,069 restarts — came from a real non-production cluster scan run last week, an open-source Kubernetes scanner that operates with read-only permissions — it can see the state of the cluster, but it cannot and did not change a single thing. The failures we found were entirely of the cluster's own making. The namespace it lived in showed green in every dashboard the team monitored. No alert had fired. No ticket had been created. The workload had essentially been broken for over two months, and the cluster's observability layer had communicated exactly nothing about it.
This is not a tooling failure. It is an architectural characteristic of how Kubernetes surfaces health information — and understanding that characteristic is what separates reactive incident response from operational awareness.
The Illusion of Cluster Health
Kubernetes communicates health through a layered abstraction. At the top of that abstraction — the level most teams observe — are node status, pod phase, and deployment availability. These signals are accurate and fast. They answer one question well: Is the cluster currently able to run workloads?
What they do not answer is whether the workloads running on it are actually functioning.
A pod in CrashLoopBackOff is, from Kubernetes' perspective, operating normally. The controller is doing exactly what it was designed to do: restarting the failed container on an exponential backoff schedule. The pod exists. The namespace exists. The deployment reports its desired replica count. If your alerting threshold for restart counts is set to a reasonable number — say, 50 or 100 restarts — a workload that has been failing continuously for months will eventually coast past that threshold and simply become background noise.
This is not an edge case. In the scan that produced the 24,069-restart finding, there were fourteen additional containers in CrashLoopBackOff state across multiple namespaces, with restart counts ranging from 817 to 23,990. All of them were in a non-production environment. All of them had been failing for between three and sixty-eight days. The cluster health summary: nominal.
Why Control Plane Signals Lag Runtime Reality
The control plane knows what state it has requested. It reconciles against that desired state continuously. What it cannot observe — by design — is whether the application inside a running container is doing what it is supposed to do.
This creates a specific and predictable gap. Kubernetes will tell you a pod is Running. It will not tell you that the running pod is connected to a database that stopped accepting connections six hours ago. It will tell you that a container restarted 24,000 times. It will not tell you whether that matters to anyone, or whether the failure has been silently swallowing work since December.
The second failure type from the same scan illustrates a different dimension of this gap:
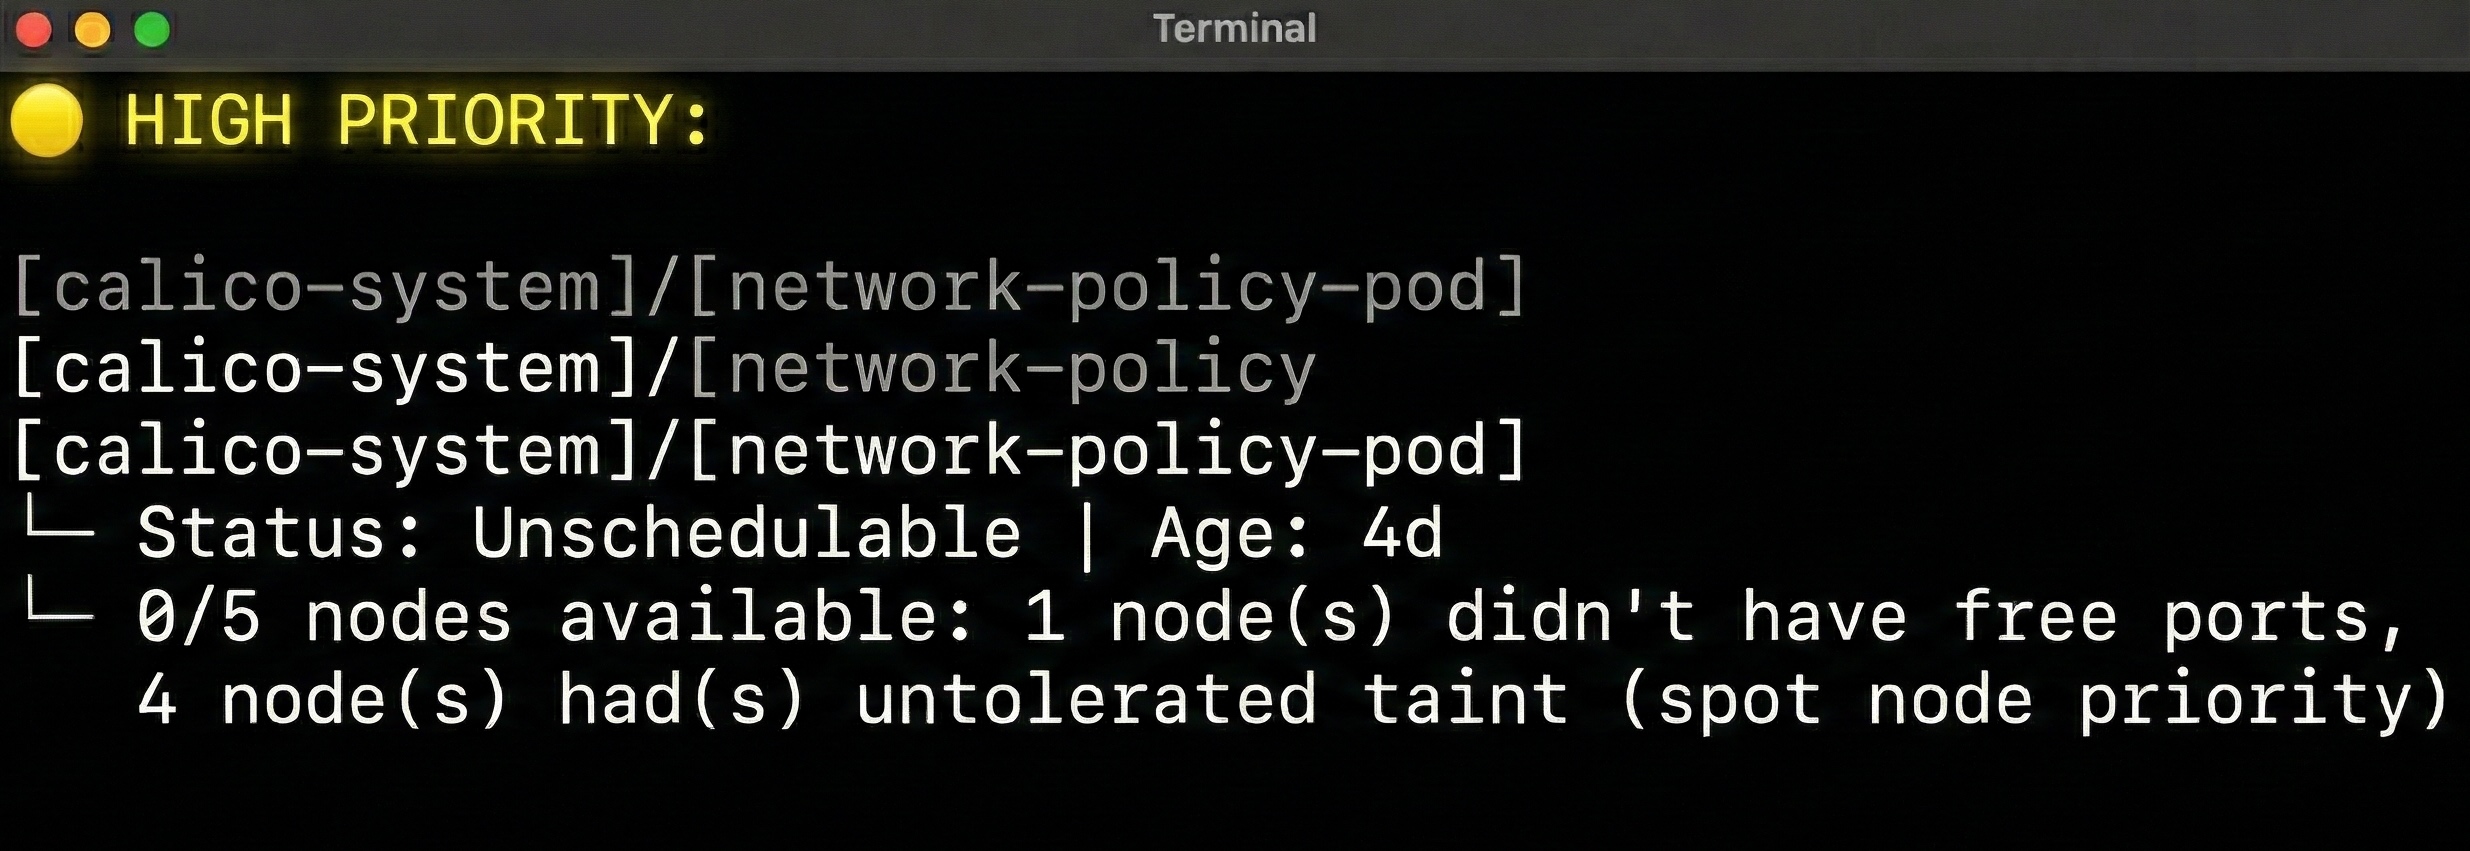
A networking component — unschedulable for four days. The control plane recorded the scheduling failure accurately. The cluster health dashboard showed the node pool as healthy because the nodes themselves were healthy. The pod simply could not land on any of them. Whether the existing running replica of this component was operating at reduced capacity, or whether the failure to schedule a replacement had any operational consequence, was not surfaced anywhere in the standard observability layer.
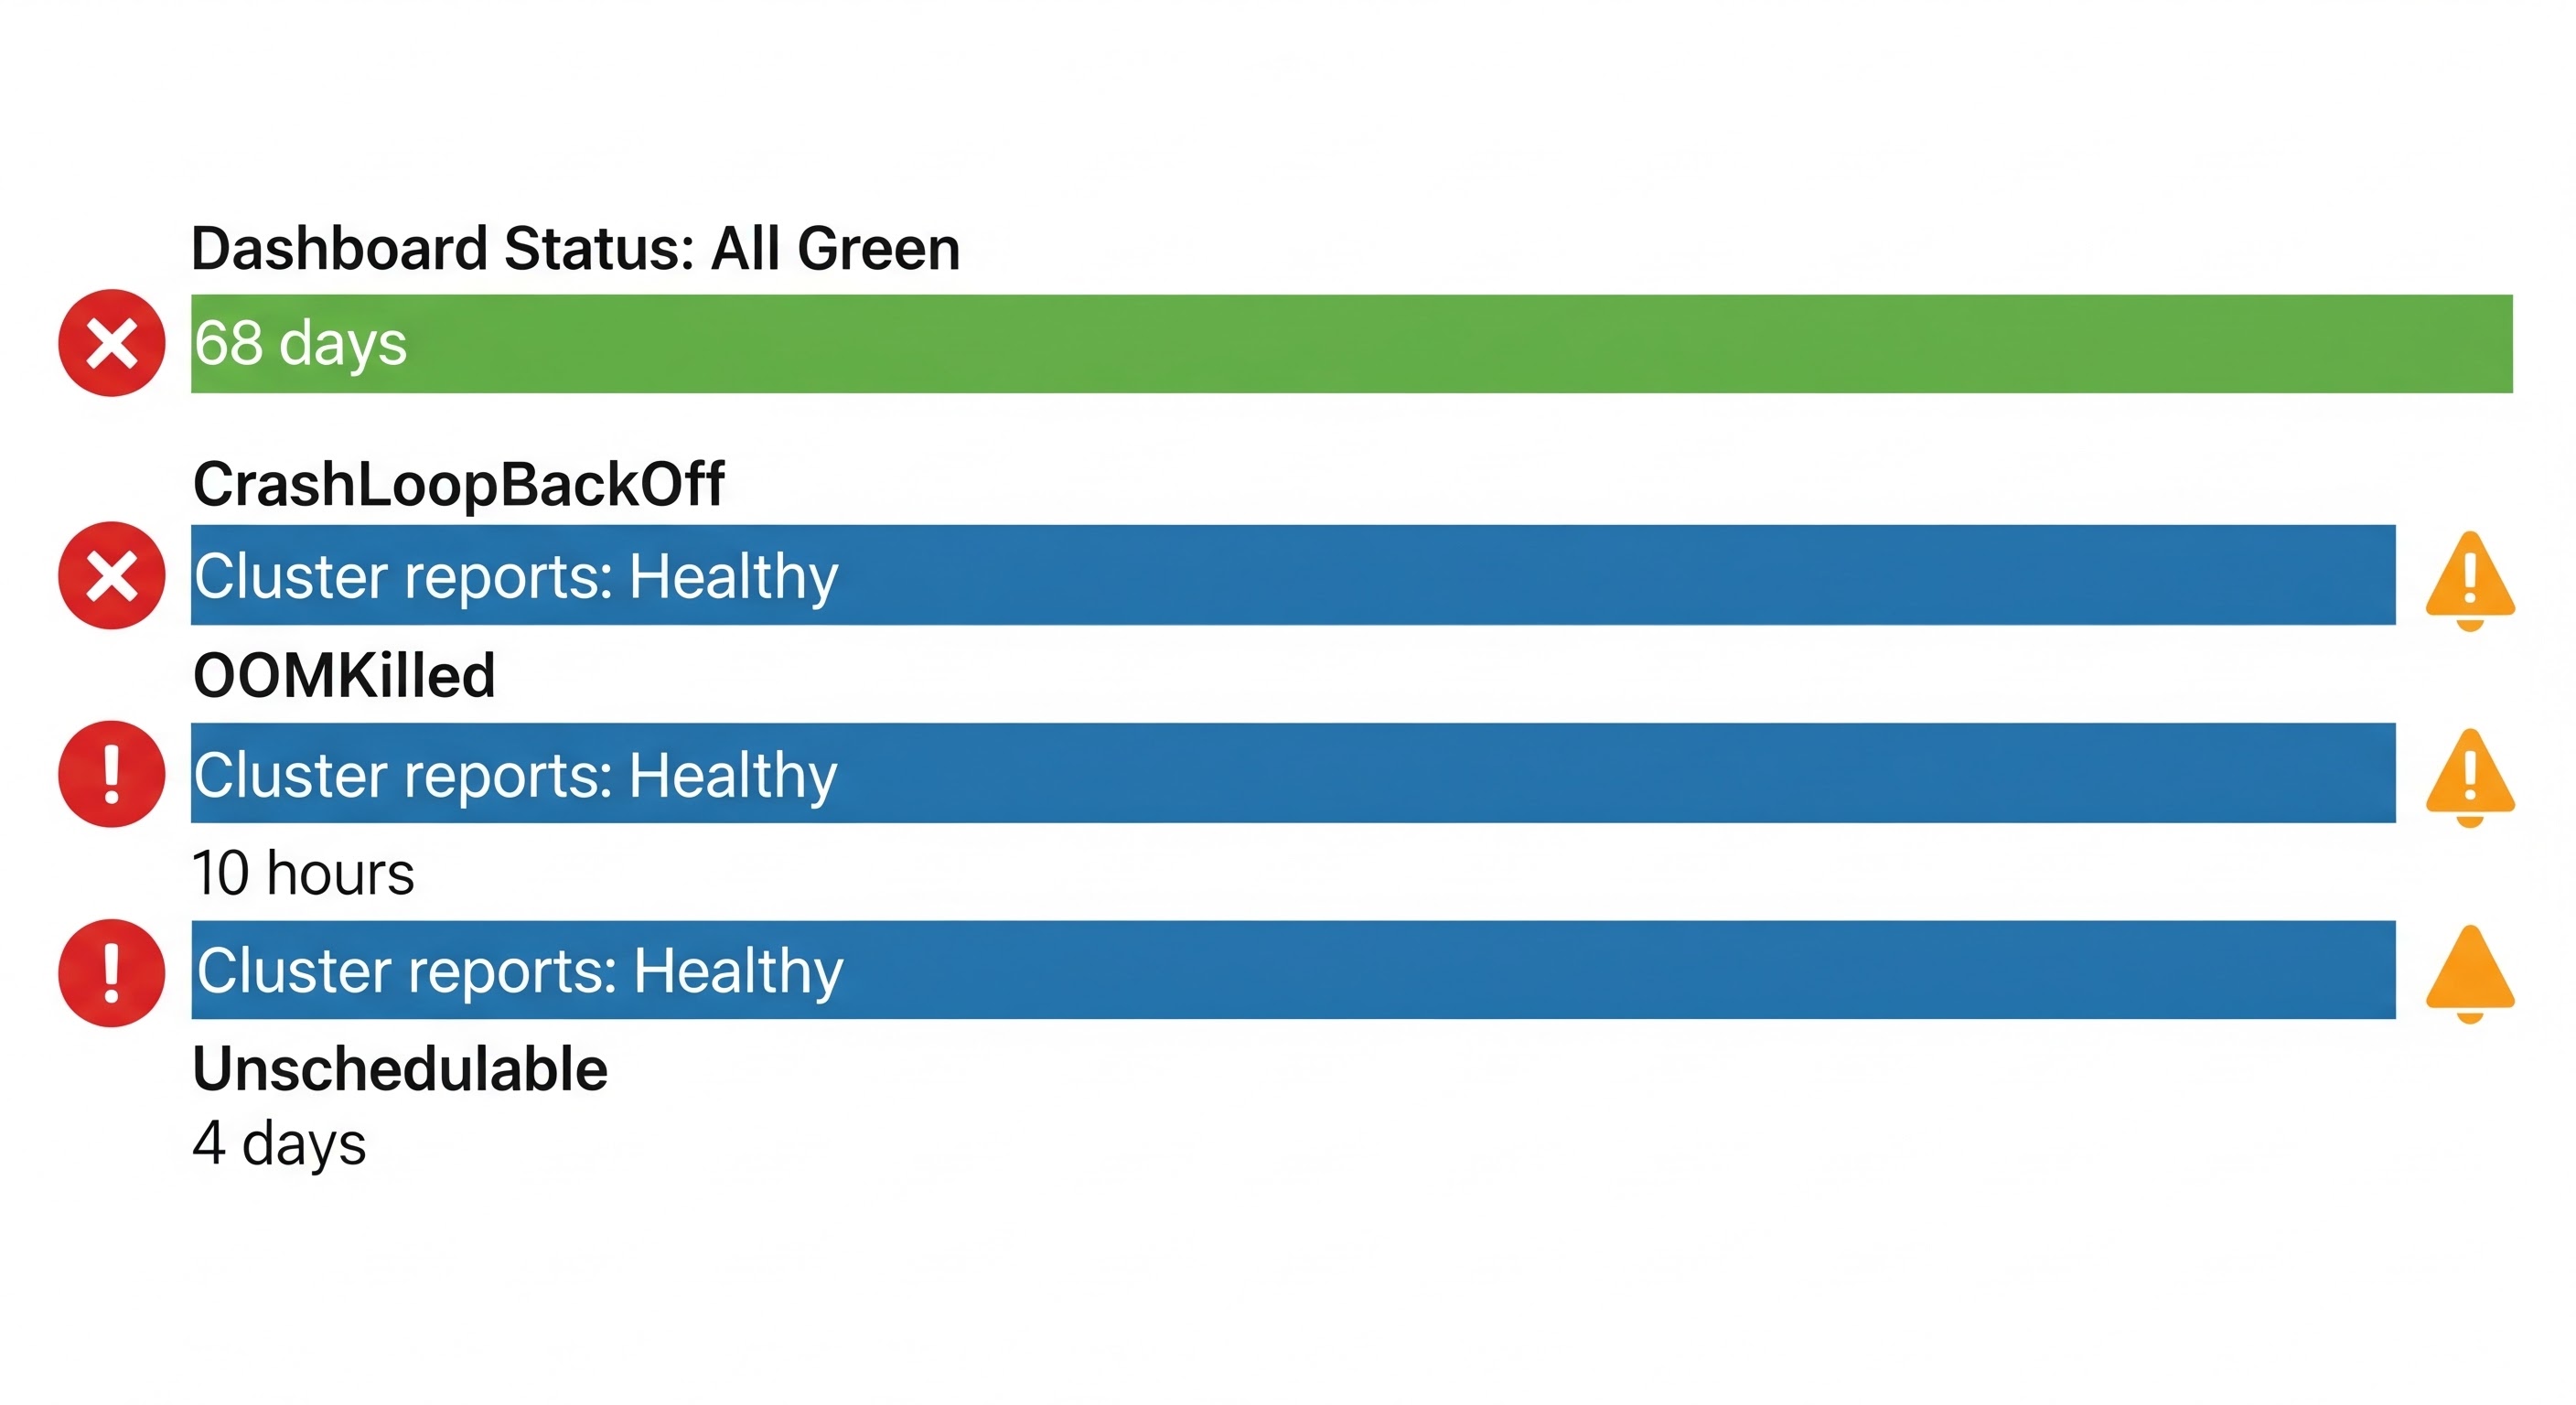
(Diagram: Control Plane Signal Timeline — from failure event to alert visibility across CrashLoopBackOff, OOMKill, and Unschedulable scenarios)
The OOMKill Signal You Almost Miss
Among the fifteen critical findings in the scan was a single OOMKill event in a system namespace:
kube-system]/[security-monitoring-pod]
└─ Status: OOMKilled | Restarts: 1 | Age: 10h
└─ Container killed due to out of memory
One restart. Ten hours old. Easy to overlook next to containers with five-digit restart counts. But the significance is different: this is a system-level component — a security monitoring agent — that was killed because it ran out of memory. One restart means it recovered. It also means there was a period, however brief, during which security event collection from those nodes was interrupted.
In a compliance-sensitive environment, that gap matters. Not because the sky fell, but because the gap exists and is not logged anywhere that post-incident reviewers would typically look. The restart count is 1. The container is Running. The audit trail of what happened in those nodes during the gap is incomplete.
This is precisely why OOMKill events deserve separate attention from CrashLoopBackOff events in incident analysis. The failure mode is different, the cause is different, and the window of exposure is bounded and often short, which makes it easy to dismiss and hard to account for later.
The Resource Allocation Gap
The resource picture from the same cluster adds a different dimension to the health illusion. The cluster reports 237 CPU cores and 1,877 GB of memory available. Requested allocation sits at 63% of CPU and 15% of memory.
Cluster Capacity:   237.1 CPU cores   1877.5 GB memory
Total Requested:    149.6 CPU cores    293.7 GB memory
                    (63.1%)            (15.6%)
The memory figure is the more interesting one. 15.6% of available memory is requested across the entire cluster, while multiple namespaces carry an OVER-PROV flag. The over-provisioned namespaces are not requesting too little — they are requesting CPU allocations that suggest the workloads were sized for a traffic profile that no longer exists, or never existed. The scheduler sees requests as the unit of resource accounting. A pod requesting 2.1 CPU cores holds 2.1 cores of schedulable capacity regardless of whether it is actually using 0.3.
This matters during incidents specifically because resource headroom feels like a safety margin. A cluster at 63% CPU requested feels like it has room to absorb load spikes. But if the workloads consuming that 63% are predominantly over-provisioned, the actual utilization is substantially lower, and the resource accounting is misleading when you are trying to understand whether a performance problem is capacity-related or configuration-related.
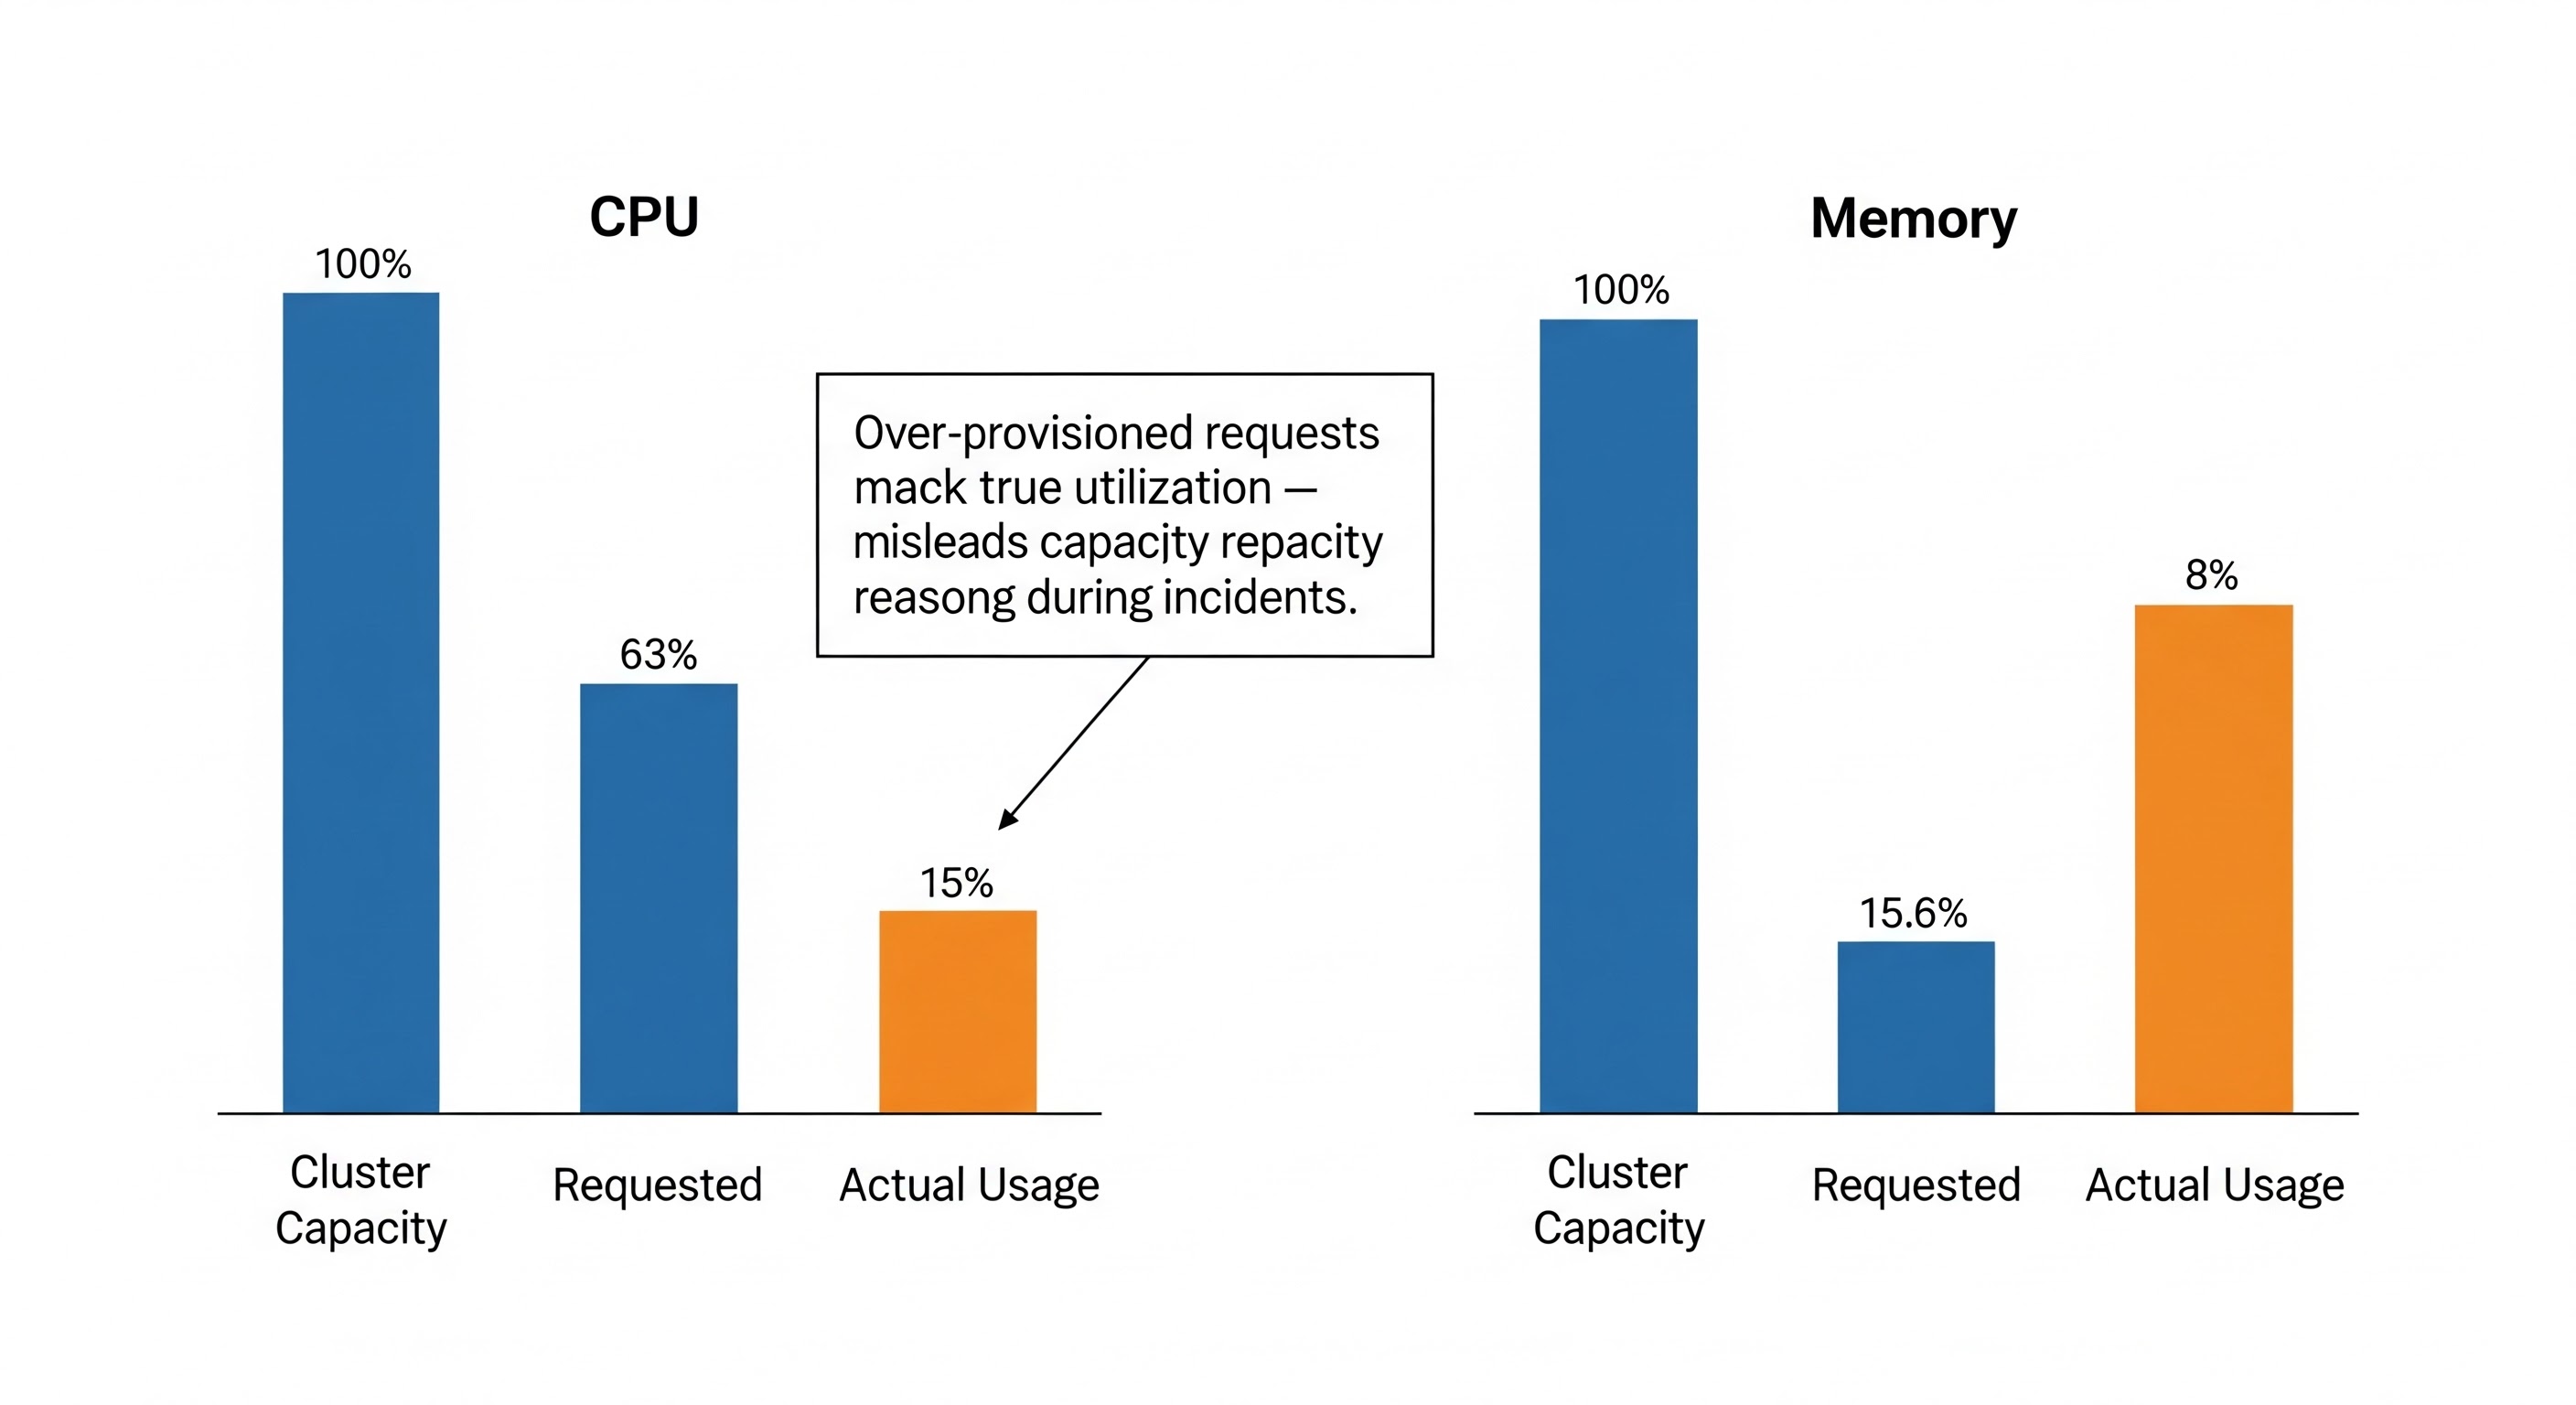
(Diagram: Requested vs Actual Resource Utilization — showing the gap between scheduled reservation and real consumption, and how that gap obscures diagnosis during load incidents)
What This Breaks in Post-Incident Analysis
The consequences of these observability gaps are most visible after incidents, not during them.
When a post-incident review asks "how long was this broken?", the answer depends on what signals were recorded and when. A container that has restarted 24,069 times over 68 days was broken on a specific day. Identifying that day requires correlating restart count history, deployment event timestamps, and application logs — none of which are surfaced in standard cluster health views. The cluster remembers the current state. It does not easily tell you when the current state began.
For teams using AI-assisted or automated remediation, this gap becomes a reliability problem. Automated systems that trigger on pod status or restart thresholds will respond to symptoms rather than causes. A restart count of 24,069 looks the same to an automation rule as a restart count of 50. The automation cannot distinguish between a container that has been in a known-broken state for months and one that just started failing. Acting on the high-restart pod without understanding its history risks masking a dependency failure, triggering unnecessary rollbacks, or creating the appearance of remediation without actually fixing anything.
The deeper issue is causal history. Kubernetes convergence is stateless in a useful sense: the system drives toward the desired state without preserving a record of how it got there. That property is what makes Kubernetes resilient. It is also what makes it difficult to reconstruct a failure timeline after the fact. The cluster that auto-recovered from an OOMKill ten hours ago left no evidence trail that most teams would find without specifically looking for it.
What Platform Teams Should Institutionalize
The gap described here is not closeable by any single tool. It is a structural property of how cluster health is defined and communicated. But it is manageable if teams build the right habits around it.
Restart count history needs a retention policy and a query pattern. A container at 24,069 restarts did not arrive there overnight. Most teams have the data in their metrics store — they simply do not have a standing query or alert that surfaces sustained CrashLoopBackOff conditions as distinct from transient ones. An alert that fires at 100 restarts and resolves when the pod recovers is different from a signal that tracks cumulative restart velocity over a 24-hour window.
OOMKill events in system namespaces warrant dedicated alerting. A security agent being OOMKilled is not the same severity event as an application container being OOMKilled, but it is not ignorable. System namespace OOMKills should route to a different channel than application health alerts.
Resource allocation audits should be treated as operational hygiene, not optimization exercises. The 63%/15% split between CPU and memory requests on this cluster is not a cost problem — it is a diagnostic problem. When requests do not reflect actual usage, resource-based reasoning during incidents becomes unreliable.
Finally, the question "how long has this been broken?" should have a fast answer. If it takes more than five minutes to determine when a CrashLoopBackOff condition started, the observability tooling is not configured to support incident response effectively. That question should be answerable from a single dashboard panel or query without log archaeology.
The Honest Question for Your Cluster
Every cluster of meaningful age and complexity carries some version of what this scan revealed. The combination of sustained crash loops, scheduling failures, and request/utilization gaps is not unusual — it is the natural state of a cluster that has been operated without systematic health archaeology.
The question worth asking of your own environment is not whether these conditions exist. They almost certainly do. The question is whether your current observability layer would surface them before they became incident preconditions — or whether you would find them the same way they were found here: by looking specifically and deliberately, rather than by being alerted.
If the answer is the latter, that is where the work is — and it starts with picking a namespace and looking deliberately. The 24,069-restart container in your cluster is waiting to be found.
The scan data in this article was collected from a real non-production Azure Kubernetes Service cluster. All namespace and resource names have been anonymized. Findings were produced using opscart-k8s-watcher, a read-only open-source Kubernetes scanner that observes cluster state without making changes. No cluster state was modified during the investigation.
Connect:
- Blog: https://opscart.com
- GitHub: https://github.com/opscart
- LinkedIn: linkedin.com/in/shamsherkhan
Published at DZone with permission of Shamsher Khan. See the original article here.
Opinions expressed by DZone contributors are their own.
Comments