Your Kubernetes Survival Kit: Master Observability, Security, and Automation
Master Kubernetes with this guide to observability (Tracestore), security (OPA), automation (Flagger), and custom metrics. Includes Java/Node.js examples.
Join the DZone community and get the full member experience.
Join For FreeKubernetes has become the de facto standard for orchestrating containerized applications. As organizations increasingly embrace cloud-native architectures, ensuring observability, security, policy enforcement, progressive delivery, and autoscaling is like ensuring your spaceship has enough fuel, oxygen, and a backup plan before launching into the vastness of production.
With the rise of multi-cloud and hybrid cloud environments, Kubernetes observability and control mechanisms must be as adaptable as a chameleon, scalable like your favorite meme stock, and technology-agnostic like a true DevOps pro. Whether you're managing workloads on AWS, Azure, GCP, or an on-premises Kubernetes cluster, having a robust ecosystem of tools is not a luxury — it's a survival kit for monitoring applications, enforcing security policies, automating deployments, and optimizing performance.
In this article, we dive into some of the most powerful Kubernetes-native tools that transform observability, security, and automation from overwhelming challenges into powerful enablers. We will explore tools for:
- Tracing and Observability: Jaeger, Prometheus, Thanos, Grafana Loki
- Policy Enforcement: OPA, Kyverno
- Progressive Delivery: Flagger, Argo Rollouts
- Security and Monitoring: Falco, Tetragon, Datadog Kubernetes Agent
- Autoscaling: Keda
- Networking and Service Mesh: Istio, Linkerd
- Deployment Validation and SLO Monitoring: Keptn
So, grab your Kubernetes control panel, adjust your monitoring dashboards, and let’s navigate the wild, wonderful, and sometimes wacky world of Kubernetes observability and reliability!
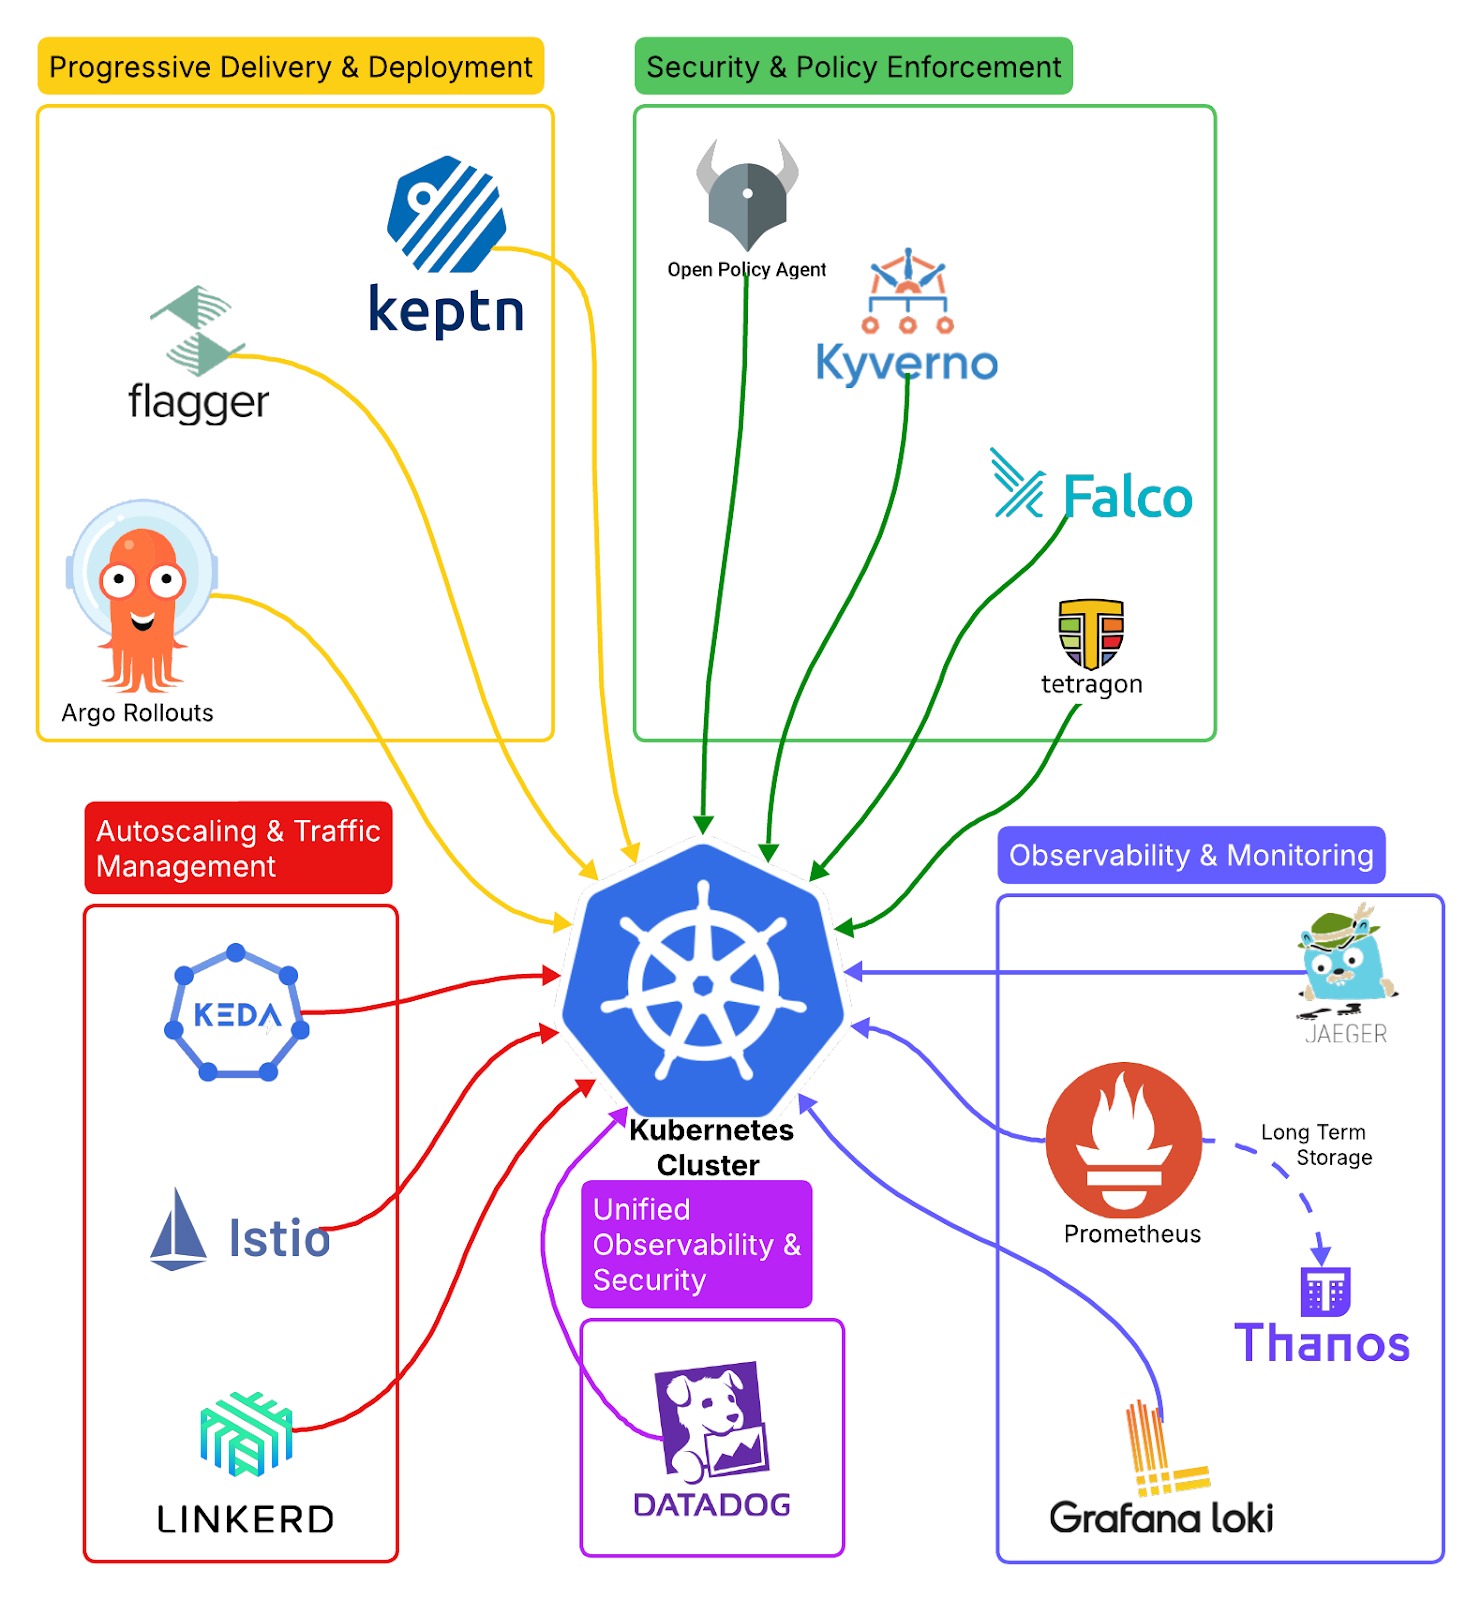 This diagram illustrates key Kubernetes tools for observability, security, deployment, and scaling. Each category highlights tools like Prometheus, OPA, Flagger, and Keda to enhance reliability and performance.
Why These Tools Matter in a Multi-Cloud Kubernetes World
Kubernetes is a highly dynamic system, managing thousands of microservices, scaling resources based on demand, and orchestrating deployments across different cloud providers. The complexity of Kubernetes requires a comprehensive observability and control strategy to ensure application health, security, and compliance.
Observability: Understanding System Behavior
Without proper monitoring and tracing, identifying bottlenecks, debugging issues, and optimizing performance becomes a challenge. Tools like Jaeger, Prometheus, Thanos, and Grafana Loki provide full visibility into distributed applications, ensuring that every microservice interaction is tracked, logged, and analyzed.
Policy Enforcement: Strengthening Security and Compliance
As Kubernetes clusters grow, managing security policies and governance becomes critical. Tools like OPA and Kyverno allow organizations to enforce fine-grained policies, ensuring that only compliant configurations and access controls are deployed across clusters.
Progressive Delivery: Reducing Deployment Risks
Modern DevOps and GitOps practices rely on safe, incremental releases. Flagger and Argo Rollouts automate canary deployments, blue-green rollouts, and A/B testing, ensuring that new versions of applications are introduced without downtime or major disruptions.
Security and Monitoring: Detecting Threats in Real Time
Kubernetes workloads are dynamic, making security a continuous process. Falco, Tetragon, and Datadog Kubernetes Agent monitor runtime behavior, detect anomalies, and prevent security breaches by providing deep visibility into container and node-level activities.
Autoscaling: Optimizing Resource Utilization
Kubernetes m offers built-in Horizontal Pod Autoscaling (HPA), but many workloads require event-driven scaling beyond CPU and memory thresholds. Keda enables scaling based on real-time events, such as queue length, message brokers, and custom business metrics.
Networking and Service Mesh: Managing Microservice Communication
In large-scale microservice architectures, network traffic management is essential. Istio and Linkerd provide service mesh capabilities, ensuring secure, reliable, and observable communication between microservices while optimizing network performance.
Deployment Validation and SLO Monitoring: Ensuring Reliable Releases
Keptn automates deployment validation, ensuring that applications meet service-level objectives (SLOs) before rolling out to production. This helps in maintaining stability and improving reliability in cloud-native environments.
Comparison of Key Tools
While each tool serves a distinct purpose, some overlap in functionality. Below is a comparison of some key tools that offer similar capabilities:
|
Category |
Tool 1 |
Tool 2 |
Key Difference |
|
Tracing and Observability |
Jaeger |
Tracestore |
Jaeger is widely adopted for tracing, whereas Tracestore is an emerging alternative. |
|
Policy Enforcement |
OPA |
Kyverno |
OPA uses Rego, while Kyverno offers Kubernetes-native CRD-based policies. |
|
Progressive Delivery |
Flagger |
Argo Rollouts |
Flagger integrates well with service meshes, Argo Rollouts is optimized for GitOps workflows. |
|
Security Monitoring |
Falco |
Tetragon |
Falco focuses on runtime security alerts, while Tetragon extends eBPF-based monitoring. |
|
Networking and Service Mesh |
Istio |
Linkerd |
Istio offers more advanced features but is complex; Linkerd is simpler and lightweight. |
1. Tracing and Observability With Jaeger
What is Jaeger?
Jaeger is an open-source distributed tracing system designed to help Kubernetes users monitor and troubleshoot transactions in microservice architectures. Originally developed by Uber, it has become a widely adopted solution for end-to-end request tracing.
Why Use Jaeger in Kubernetes?
- Distributed Tracing: Provides visibility into request flows across multiple microservices.
- Performance Bottleneck Detection: Helps identify slow service interactions and dependencies.
- Root Cause Analysis: Enables debugging of latency issues and failures.
- Seamless Integration: Works well with Prometheus, OpenTelemetry, and Grafana.
- Multi-Cloud Ready: Deployable across AWS, Azure, and GCP Kubernetes clusters for global observability.
Comparison: Jaeger vs. Tracestore
|
Feature |
Jaeger |
Tracestore |
|
Adoption |
Widely adopted in Kubernetes environments |
Emerging solution |
|
Open-Source |
Yes |
Limited information available |
|
Integration |
Works with OpenTelemetry, Prometheus, and Grafana |
Less integration support |
|
Use Case |
Distributed tracing, root cause analysis |
Similar use case but less proven |
Jaeger is the preferred choice for most Kubernetes users due to its mature ecosystem, active community, and strong integration capabilities.
How Jaeger is Used in Multi-Cloud Environments
Jaeger can be deployed in multi-cluster and multi-cloud environments by:
- Deploying Jaeger as a Kubernetes service to trace transactions across microservices.
- Using OpenTelemetry for tracing and sending trace data to Jaeger for analysis.
- Storing trace data in distributed storage solutions like Elasticsearch or Cassandra for scalability.
- Integrating with Grafana to visualize trace data alongside Kubernetes metrics.
In short, Jaeger is an essential tool for observability and debugging in modern cloud-native architectures. Whether running Kubernetes workloads on-premise or across multiple cloud providers, it provides a robust solution for distributed tracing and performance monitoring.
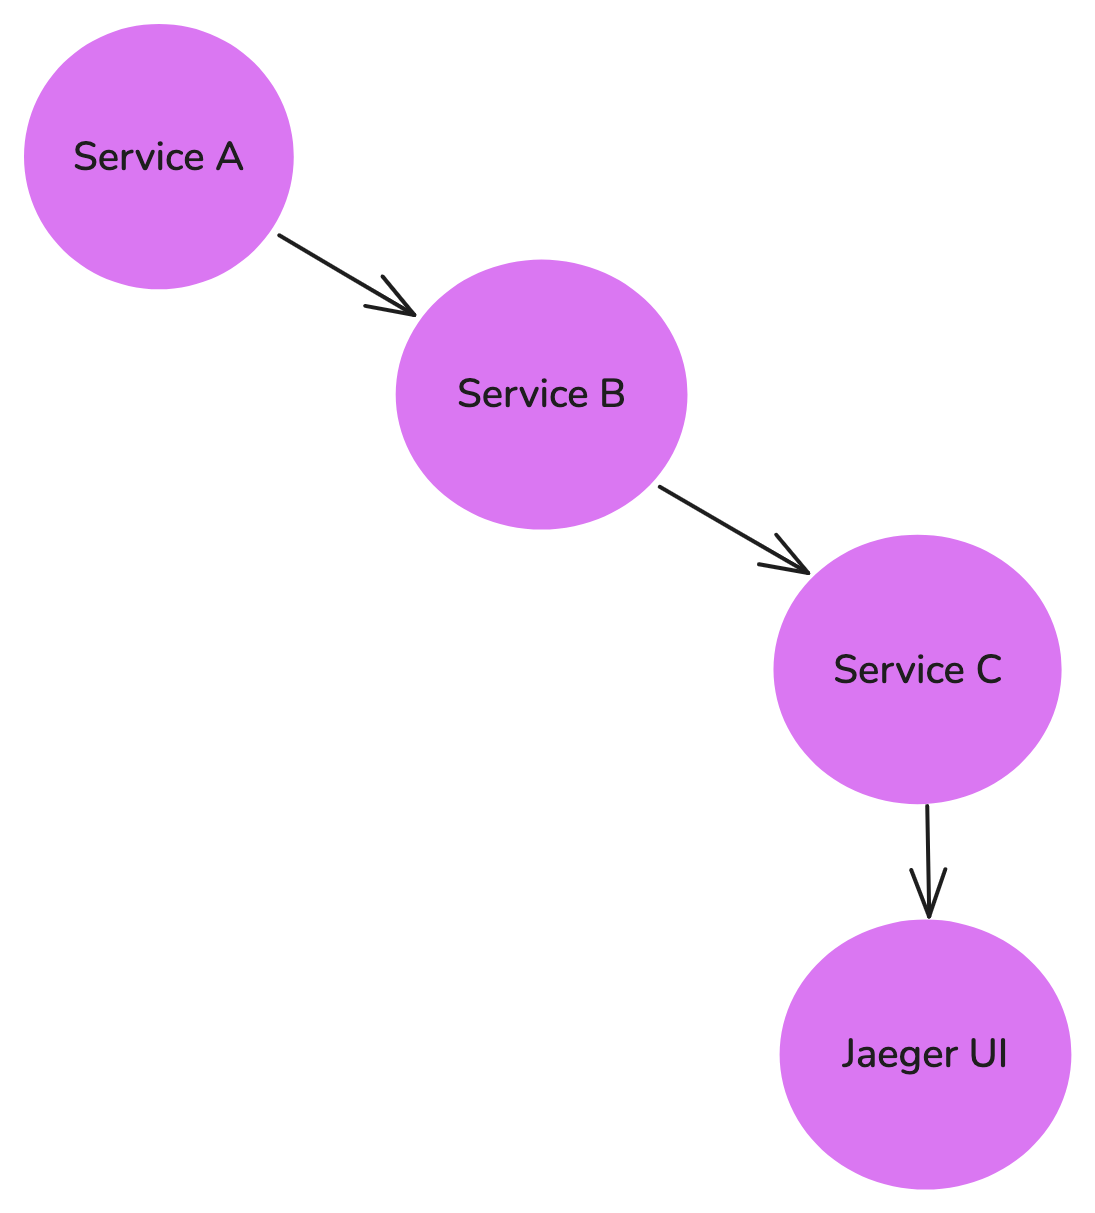
This diagram depicts Jaeger tracing the flow of requests across multiple services (e.g., Service A → Service B → Service C). Jaeger UI visualizes the traces, helping developers analyze latency issues, bottlenecks, and request paths in microservices architectures.
Observability With Prometheus
What is Prometheus?
Prometheus is an open-source monitoring and alerting toolkit designed specifically for cloud-native environments. As part of the Cloud Native Computing Foundation (CNCF), it has become the default monitoring solution for Kubernetes due to its reliability, scalability, and deep integration with containerized applications.
Why Use Prometheus in Kubernetes?
- Time-Series Monitoring: Captures metrics in a time-series format, enabling historical analysis.
- Powerful Query Language (PromQL): Allows users to filter, aggregate, and analyze metrics efficiently.
- Scalability: It handles massive workloads across large Kubernetes clusters.
- Multi-Cloud Deployment: Can be deployed across AWS, Azure, and GCP Kubernetes clusters for unified observability.
- Integration with Grafana: Provides real-time dashboards and visualizations.
- Alerting Mechanism: Works with Alertmanager to notify teams about critical issues.
How Prometheus Works in Kubernetes
Prometheus scrapes metrics from various sources within the Kubernetes cluster, including:
- Kubernetes API Server for node and pod metrics.
- Application Endpoints exposing Prometheus-formatted metrics.
- Node Exporters for host-level system metrics.
- Custom Metrics Exporters for application-specific insights.
How Prometheus is Used in Multi-Cloud Environments
Prometheus supports multi-cloud observability by:
- Deploying Prometheus instances per cluster to collect and store local metrics.
- Using Thanos or Cortex for long-term storage, enabling centralized querying across multiple clusters.
- Integrating with Grafana to visualize data from different cloud providers in a single dashboard.
- Leveraging Alertmanager to route alerts dynamically based on cloud-specific policies.
In short, Prometheus is the go-to monitoring solution for Kubernetes, providing powerful observability into containerized workloads. When combined with Grafana, Thanos, and Alertmanager, it forms a comprehensive monitoring stack suitable for both single-cluster and multi-cloud environments.
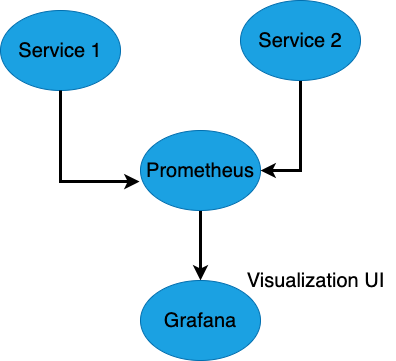
This diagram shows how Prometheus scrapes metrics from multiple services (e.g., Service 1 and Service 2) and sends the collected data to Grafana for visualization. Grafana serves as the user interface where metrics are displayed in dashboards for real-time monitoring and alerting.
Long-Term Metrics Storage With Thanos
What is Thanos?
Thanos is an open-source system designed to extend Prometheus' capabilities by providing long-term metrics storage, high availability, and federated querying across multiple clusters. It ensures that monitoring data is retained for extended periods while allowing centralized querying of distributed Prometheus instances.
Why Use Thanos in Kubernetes?
- Long-Term Storage: Retains Prometheus metrics indefinitely, overcoming local retention limits.
- High Availability: This ensures continued access to metrics even if a Prometheus instance fails.
- Multi-Cloud and Multi-Cluster Support: Enables federated monitoring across Kubernetes clusters on AWS, Azure, and GCP.
- Query Federation: Aggregates data from multiple Prometheus instances into a single view.
- Cost-Effective Storage: It supports object storage backends like Amazon S3, Google Cloud Storage, and Azure Blob Storage.
How Thanos Works With Prometheus
Thanos extends Prometheus by introducing the following components:
- Sidecar: Attaches to Prometheus instances and uploads data to object storage.
- Store Gateway: Allows querying of stored metrics across clusters.
- Querier: Provides a unified API for running queries across multiple Prometheus deployments.
- Compactor: Optimizes and deduplicates historical data.
Comparison: Prometheus vs. Thanos
|
Feature |
Prometheus |
Thanos |
|
Data Retention |
Limited (based on local storage) |
Long-term storage in object stores |
|
High Availability |
No built-in redundancy |
HA setup with global querying |
|
Multi-Cluster Support |
Single-cluster focus |
Multi-cluster observability |
|
Query Federation |
Not supported |
Supported across clusters |
In short, Thanos is a must-have addition to Prometheus for organizations running multi-cluster and multi-cloud Kubernetes environments. It provides scalability, availability, and long-term storage, ensuring that monitoring data is never lost and remains accessible across distributed systems.
Log Aggregation and Observability With Grafana Loki
What is Grafana Loki?
Grafana Loki is a log aggregation system designed specifically for Kubernetes environments. Unlike traditional log management solutions, Loki does not index log content, making it highly scalable and cost-effective. It integrates seamlessly with Prometheus and Grafana, allowing users to correlate logs with metrics for better troubleshooting.
Why Use Grafana Loki in Kubernetes?
- Lightweight and Efficient: It does not require full-text indexing, reducing storage and processing costs.
- Scalability: It handles high log volume across multiple Kubernetes clusters.
- Multi-Cloud Ready: Can be deployed on AWS, Azure, and GCP, supporting centralized log aggregation.
- Seamless Prometheus Integration: Allows correlation of logs with Prometheus metrics.
- Powerful Query Language (LogQL): Enables efficient filtering and analysis of logs.
How Grafana Loki Works in Kubernetes
Loki ingests logs from multiple sources, including:
- Promtail: A lightweight log agent that collects logs from Kubernetes pods.
- Fluentd/Fluent Bit: Alternative log collectors for forwarding logs to Loki.
- Grafana Dashboards: Visualizes logs alongside Prometheus metrics for deep observability.
Comparison: Grafana Loki vs. Traditional Log Management
|
Feature |
Grafana Loki |
Traditional Log Systems (ELK, Splunk) |
|
Indexing |
Only index labels (lightweight) |
Full-text indexing (resource-intensive) |
|
Scalability |
Optimized for large-scale clusters |
Requires significant storage and CPU |
|
Cost |
Lower cost due to minimal indexing |
Expensive due to indexing overhead |
|
Integration |
Works natively with Prometheus and Grafana |
Requires additional integrations |
|
Querying |
Uses LogQL for efficient filtering |
Uses full-text search and queries |
In short, Grafana Loki is a powerful yet lightweight log aggregation tool that provides scalable and cost-effective log management for Kubernetes environments. By integrating with Grafana and Prometheus, it enables full-stack observability, allowing teams to quickly diagnose issues and improve system reliability.
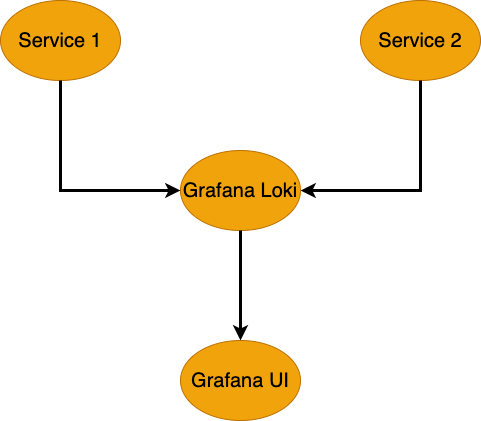
This diagram shows Grafana Loki collecting logs from multiple services (e.g., Service 1 and Service 2) and forwarding them to Grafana for visualization. Loki efficiently stores logs, while Grafana provides an intuitive interface for analyzing and troubleshooting logs.
2. Policy Enforcement With OPA and Kyverno
What is OPA?
Open Policy Agent (OPA) is an open-source policy engine that provides fine-grained access control and governance for Kubernetes workloads. OPA allows users to define policies using Rego, a declarative query language, to enforce rules across Kubernetes resources.
Why Use OPA in Kubernetes?
- Fine-Grained Policy Enforcement: Enables strict access control at all levels of the cluster.
- Dynamic Admission Control: Evaluates and enforces policies before resources are deployed.
- Auditability and Compliance: Ensures Kubernetes configurations follow compliance frameworks.
- Integration with CI/CD Pipelines: Validates Kubernetes manifests before deployment.
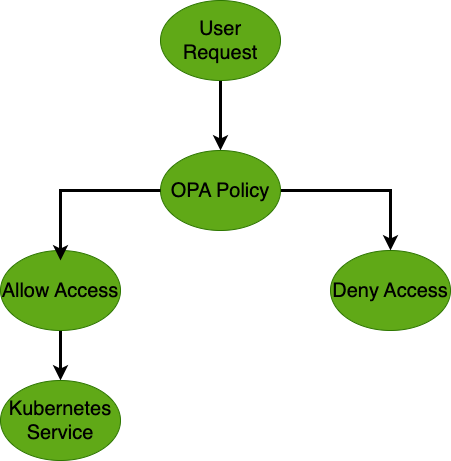
This diagram illustrates how OPA handles incoming user requests by evaluating security policies. Requests are either allowed or denied based on these policies. Allowed requests proceed to the Kubernetes service, ensuring policy enforcement for secure access control.
What is Kyverno?
Kyverno is a Kubernetes-native policy management tool that enforces security and governance rules using Kubernetes Custom Resource Definitions (CRDs). Unlike OPA, which requires learning Rego, Kyverno enables users to define policies using familiar Kubernetes YAML.
Why Use Kyverno in Kubernetes?
- Kubernetes-Native: Uses CRDs instead of a separate policy language.
- Easy Policy Definition: Allows administrators to write policies using standard Kubernetes configurations.
- Mutation and Validation: Can modify resource configurations dynamically.
- Simplified Governance: Enforces best practices for security and compliance.
Comparison: OPA vs. Kyverno
|
Feature |
OPA |
Kyverno |
|
Policy Language |
Uses Rego (custom query language) |
Uses native Kubernetes YAML |
|
Integration |
Works with Kubernetes and external apps |
Primarily for Kubernetes workloads |
|
Mutation |
No built-in mutation support |
Supports modifying configurations |
|
Ease of Use |
Requires learning Rego |
Simple for Kubernetes admins |
How OPA and Kyverno Work in Multi-Cloud Environments
Both OPA and Kyverno help maintain consistent policies across Kubernetes clusters deployed on different cloud platforms.
- OPA: Used in multi-cloud scenarios where policy enforcement extends beyond Kubernetes (e.g., APIs, CI/CD pipelines).
- Kyverno: Ideal for Kubernetes-only policy management across AWS, Azure, and GCP clusters.
- Global Policy Synchronization: Ensures that all clusters follow the same security and governance policies.
In short, both OPA and Kyverno offer robust policy enforcement for Kubernetes environments, but the right choice depends on the complexity of governance needs. OPA is powerful for enterprise-scale policies across various systems, while Kyverno simplifies Kubernetes-native policy enforcement.
3. Progressive Delivery With Flagger and Argo Rollouts
What is Flagger?
Flagger is a progressive delivery tool designed for automated canary deployments, blue-green deployments, and A/B testing in Kubernetes. It integrates with service meshes like Istio, Linkerd, and Consul to shift traffic between different application versions based on real-time metrics.
Why Use Flagger in Kubernetes?
- Automated Canary Deployments: Gradually shift traffic to a new version based on performance.
- Traffic Management: Works with service meshes to control routing dynamically.
- Automated Rollbacks: Detects failures and reverts to a stable version if issues arise.
- Metrics-Based Decision Making: Uses Prometheus, Datadog, or other observability tools to determine release stability.
- Multi-Cloud Ready: It can be deployed across Kubernetes clusters in AWS, Azure, and GCP.
What are Argo Rollouts?
Argo Rollouts is a Kubernetes controller for progressive delivery strategies, including blue-green deployments, canary releases, and experimentation. It is part of the Argo ecosystem, making it a great choice for GitOps-based workflows.
Why Use Argo Rollouts in Kubernetes?
- GitOps-Friendly: It integrates seamlessly with Argo CD for declarative deployments.
- Advanced Traffic Control: Works with Ingress controllers and service meshes to shift traffic dynamically.
- Feature-Rich Canary Deployments: Supports progressive rollouts with fine-grained control over traffic shifting.
- Automated Analysis and Promotion: Evaluates new versions based on key performance indicators (KPIs) before full rollout.
- Multi-Cloud Deployment: Works across different cloud providers for global application releases.
Comparison: Flagger vs. Argo Rollouts
|
Feature |
Flagger |
Argo Rollouts |
|
Integration |
Works with service meshes (Istio, Linkerd) |
Works with Ingress controllers, Argo CD |
|
Deployment Strategies |
Canary, Blue-Green, A/B Testing |
Canary, Blue-Green, Experimentation |
|
Traffic Control |
Uses service mesh for traffic shifting |
Uses ingress controllers and service mesh |
|
Rollbacks |
Automated rollback based on metrics |
Automated rollback based on analysis |
|
Best for |
Service mesh-based progressive delivery |
GitOps workflows and feature flagging |
How Flagger and Argo Rollouts Work in Multi-Cloud Environments
Both tools enhance multi-cloud deployments by ensuring safe, gradual releases across Kubernetes clusters.
- Flagger: Works best in service mesh environments, allowing traffic-based gradual deployments across cloud providers.
- Argo Rollouts: Ideal for GitOps-driven pipelines, making declarative, policy-driven rollouts across multiple cloud clusters seamless.
In short, both Flagger and Argo Rollouts provide progressive delivery mechanisms to ensure safe, automated, and data-driven deployments in Kubernetes. Choosing between them depends on infrastructure setup (service mesh vs. ingress controllers) and workflow preference (standard Kubernetes vs. GitOps).
4. Security and Monitoring With Falco, Tetragon, and Datadog Kubernetes Agent
What is Falco?
Falco is an open-source runtime security tool that detects anomalous activity in Kubernetes clusters. It leverages Linux kernel system calls to identify suspicious behaviors in real time.
Why Use Falco in Kubernetes?
- Runtime Threat Detection: Identifies security threats based on kernel-level events.
- Compliance Enforcement: Ensures best practices by monitoring for unexpected system activity.
- Flexible Rule Engine: Allows users to define custom security policies.
- Multi-Cloud Ready: Works across Kubernetes clusters in AWS, Azure, and GCP.
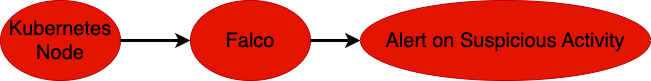
This diagram demonstrates Falco’s role in monitoring Kubernetes nodes for suspicious activities. When Falco detects unexpected behavior, it generates alerts for immediate action, helping ensure runtime security in Kubernetes environments.
What is Tetragon?
Tetragon is an eBPF-based security observability tool that provides deep visibility into process execution, network activity, and privilege escalations in Kubernetes.
Why Use Tetragon in Kubernetes?
- High-Performance Security Monitoring: Uses eBPF for minimal overhead.
- Process-Level Observability: Tracks container execution and system interactions.
- Real-Time Policy Enforcement: Blocks malicious activities dynamically.
- Ideal for Zero-Trust Environments: Strengthens security posture with deep runtime insights.
What is Datadog Kubernetes Agent?
The Datadog Kubernetes Agent is a full-stack monitoring solution that provides real-time observability across metrics, logs, and traces, integrating seamlessly with Kubernetes environments.
Why Use Datadog Kubernetes Agent?
- Unified Observability: Combines metrics, logs, and traces in a single platform.
- Security Monitoring: Detects security events and integrates with compliance frameworks.
- Multi-Cloud Deployment: Works across AWS, Azure, and GCP clusters.
- AI-powered alerts: Uses machine learning to identify anomalies and prevent incidents.
Comparison: Falco vs. Tetragon vs. Datadog Kubernetes Agent
|
Feature |
Falco |
Tetragon |
Datadog Kubernetes Agent |
|
Monitoring Focus |
Runtime security alerts |
Deep process-level security insights |
Full-stack observability and security |
|
Technology |
Uses kernel system calls |
Uses eBPF for real-time insights |
Uses agent-based monitoring |
|
Anomaly Detection |
Detects rule-based security events |
Detects system behavior anomalies |
AI-driven anomaly detection |
|
Best for |
Runtime security and compliance |
Deep forensic security analysis |
Comprehensive monitoring and security |
How These Tools Work in Multi-Cloud Environments
- Falco: Monitors Kubernetes workloads in real time across cloud environments.
- Tetragon: Provides low-latency security insights, ideal for large-scale, multi-cloud Kubernetes deployments.
- Datadog Kubernetes Agent: Unifies security and observability for Kubernetes clusters running across AWS, Azure, and GCP.
In short, each of these tools serves a unique purpose in securing and monitoring Kubernetes workloads. Falco is great for real-time anomaly detection, Tetragon provides deep security observability, and Datadog Kubernetes Agent offers a comprehensive monitoring solution.
5. Autoscaling with Keda
What is Keda?
Kubernetes Event-Driven Autoscaling (Keda) is an open-source autoscaler that enables Kubernetes workloads to scale based on event-driven metrics. Unlike traditional Horizontal Pod Autoscaling (HPA), which primarily relies on CPU and memory usage, Keda can scale applications based on custom metrics such as queue length, database connections, and external event sources.
Why Use Keda in Kubernetes?
- Event-Driven Scaling: Supports scaling based on external event sources (Kafka, RabbitMQ, Prometheus, etc.).
- Efficient Resource Utilization: Reduces the number of running pods when demand is low, cutting costs.
- Multi-Cloud Support: Works across Kubernetes clusters in AWS, Azure, and GCP.
- Works with Existing HPA: Extends Kubernetes' built-in Horizontal Pod Autoscaler.
- Flexible Metrics Sources: Can scale applications based on logs, messages, or database triggers.
How Keda Works in Kubernetes
Keda consists of two main components:
- Scaler: Monitors external event sources (e.g., Azure Service Bus, Kafka, AWS SQS) and determines when scaling is needed.
- Metrics Adapter: Passes event-based metrics to Kubernetes' HPA to trigger pod scaling.
Comparison: Keda vs. Traditional HPA
|
Feature |
Traditional HPA |
Keda |
|
Scaling Trigger |
CPU and Memory Usage |
External events (queues, messages, DB, etc.) |
|
Event-Driven |
No |
Yes |
|
Custom Metrics |
Limited support |
Extensive support via external scalers |
|
Best for |
CPU/Memory-bound workloads |
Event-driven applications |
How Keda Works in Multi-Cloud Environments
- AWS: Scales applications based on SQS queue depth or DynamoDB load.
- Azure: Supports Azure Event Hub, Service Bus, and Functions.
- GCP: Integrates with Pub/Sub for event-driven scaling.
- Hybrid/Multi-Cloud: Works across cloud providers by integrating with Prometheus, RabbitMQ, and Redis.
In short, Keda is a powerful autoscaling solution that extends Kubernetes's capabilities beyond CPU and memory-based scaling. It is particularly useful for microservices and event-driven applications, making it a key tool for optimizing workloads across multi-cloud Kubernetes environments.
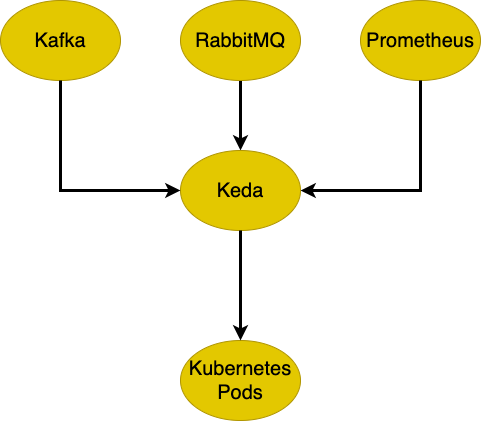
This diagram represents how Keda scales Kubernetes pods dynamically based on external event sources like Kafka, RabbitMQ, or Prometheus. When an event trigger is detected, Keda scales pods in the Kubernetes cluster accordingly to handle increased demand.
6. Networking and Service Mesh With Istio and Linkerd
What is Istio?
Istio is a powerful service mesh that provides traffic management, security, and observability for microservices running in Kubernetes. It abstracts network communication between services and enhances reliability through load balancing, security policies, and tracing.
Why Use Istio in Kubernetes?
- Traffic Management: Implements fine-grained control over traffic routing, including canary deployments and retries.
- Security and Authentication: Enforces zero-trust security with mutual TLS (mTLS) encryption.
- Observability: It integrates with tools like Prometheus, Jaeger, and Grafana for deep monitoring.
- Multi-Cloud and Hybrid Support: Works across Kubernetes clusters in AWS, Azure, and GCP.
- Service Discovery and Load Balancing: Automatically discovers services and balances traffic efficiently.
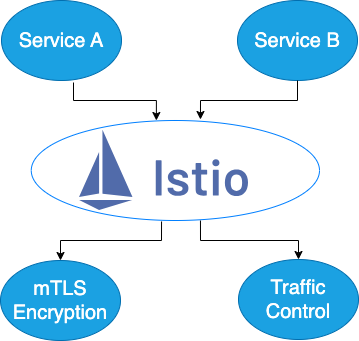
This diagram illustrates how Istio controls traffic flow between services (e.g., Service A and Service B). Istio enables mTLS encryption for secure communication and offers traffic control capabilities to manage service-to-service interactions within the Kubernetes cluster.
What is Linkerd?
Linkerd is a lightweight service mesh designed to be simpler and faster than Istio while providing essential networking capabilities. It offers automatic encryption, service discovery, and observability for microservices.
Why Use Linkerd in Kubernetes?
- Lightweight and Simple: Easier to deploy and maintain than Istio.
- Automatic mTLS: Provides encrypted communication between services by default.
- Low Resource Consumption: Requires fewer system resources than Istio.
- Native Kubernetes Integration: Uses Kubernetes constructs for streamlined management.
- Reliable and Fast: Optimized for performance with minimal overhead.
Comparison: Istio vs. Linkerd
|
Feature |
Istio |
Linkerd |
|
Complexity |
Higher complexity, more features |
Simpler, easier to deploy |
|
Security |
Advanced security (mTLS, RBAC) |
Lightweight mTLS encryption |
|
Observability |
Deep integration with tracing and monitoring tools |
Basic logging and metrics support |
|
Performance |
More resource-intensive |
Lightweight, optimized for speed |
|
Best for |
Large-scale enterprise deployments |
Teams needing a simple service mesh |
How Istio and Linkerd Work in Multi-Cloud Environments
- Istio: Ideal for enterprises running multi-cloud Kubernetes clusters with advanced security, routing, and observability needs.
- Linkerd: Suitable for lightweight service mesh deployments across hybrid cloud environments where simplicity and performance are key.
In short, both Istio and Linkerd are excellent service mesh solutions, but the choice depends on your organization's needs. Istio is best for feature-rich, enterprise-scale networking, while Linkerd is ideal for those who need a simpler, lightweight solution with strong security and observability.
7. Deployment Validation and SLO Monitoring With Keptn
What is Keptn?
Keptn is an open-source control plane that automates deployment validation, service-level objective (SLO) monitoring, and incident remediation in Kubernetes. It helps organizations ensure that applications meet predefined reliability standards before and after deployment.
Why Use Keptn in Kubernetes?
- Automated Quality Gates: Validates deployments against SLOs before full release.
- Continuous Observability: Monitors application health using Prometheus, Dynatrace, and other tools.
- Self-Healing Capabilities: Detects performance degradation and triggers remediation workflows.
- Multi-Cloud Ready: Works across Kubernetes clusters on AWS, Azure, and GCP.
- Event-Driven Workflow: Uses cloud-native events to trigger automated responses.
How Keptn Works in Kubernetes
Keptn integrates with Kubernetes to provide automated deployment verification and continuous performance monitoring:
- Quality Gates: Ensures that applications meet reliability thresholds before deployment.
- Service-Level Indicators (SLIs): Monitors key performance metrics (latency, error rate, throughput).
- SLO Evaluation: Compares SLIs against pre-defined objectives to determine deployment success.
- Remediation Actions: Triggers rollback or scaling actions if service quality degrades.
Comparison: Keptn vs. Traditional Monitoring Tools
|
Feature |
Keptn |
Traditional Monitoring (e.g., Prometheus) |
|
SLO-Based Validation |
Yes |
No |
|
Automated Rollbacks |
Yes |
Manual intervention required |
|
Event-Driven Actions |
Yes |
No |
|
Remediation Workflows |
Yes |
No |
|
Multi-Cloud Support |
Yes |
Yes |
How Keptn Works in Multi-Cloud Environments
- AWS: Works with AWS Lambda, EKS, and CloudWatch for automated remediation.
- Azure: It integrates with Azure Monitor and AKS for SLO-driven validation.
- GCP: Supports GKE and Stackdriver for continuous monitoring.
- Hybrid Cloud: Works across multiple Kubernetes clusters for unified service validation.
In short, Keptn is a game-changer for Kubernetes deployments, enabling SLO-based validation, self-healing, and continuous reliability monitoring. By automating deployment verification and incident response, Keptn ensures that applications meet performance and availability standards across multi-cloud Kubernetes environments.
Conclusion
Kubernetes observability and reliability are essential for ensuring seamless application performance across multi-cloud and hybrid cloud environments. The tools discussed in this guide — Jaeger, Prometheus, Thanos, Grafana Loki, OPA, Kyverno, Flagger, Argo Rollouts, Falco, Tetragon, Datadog Kubernetes Agent, Keda, Istio, Linkerd, and Keptn — help organizations optimize monitoring, security, deployment automation, and autoscaling.
By integrating these tools into your Kubernetes strategy, you can achieve enhanced visibility, automated policy enforcement, secure deployments, and efficient scalability, ensuring smooth operations in any cloud environment.
Published at DZone with permission of Prabhu Chinnasamy. See the original article here.
Opinions expressed by DZone contributors are their own.
Comments