Data Pipeline Architectures: Lessons from Implementing Real-Time Analytics
Real-time pipelines sound great — until you're buried in Kafka ops, broken joins, and silent delays. Here's what actually works, and when simpler tools win.
Join the DZone community and get the full member experience.
Join For FreeNot long ago, real-time analytics was considered a luxury reserved for tech giants and hyper-scale startups—fraud detection in milliseconds, live GPS tracking for logistics, or instant recommendation engines that adapt as users browse.
Today, the landscape has shifted dramatically.
In an increasingly competitive digital environment, real-time visibility has become essential for businesses of all sizes. Whether you operate a food delivery platform, a fintech application, or an e-commerce store, live metrics are no longer optional — they are critical for detecting anomalies, preventing operational failures, and responding faster than competitors.
But there’s a catch:
Building real-time data pipelines is significantly more complex than traditional batch processing or log-based dashboards. The challenges — latency, scalability, and reliability — require careful architectural decisions.
In this article, I’ll share practical lessons from implementing real-time analytics in production environments: what worked, what failed, and the key takeaways for building robust streaming systems.
Why Real-Time? What’s the Catch?
Batch ETL works until it doesn’t.
|
Use Case |
Why Real-Time Wins |
|
Fraud Detection |
Spot anomalies as they happen |
|
Supply Chain |
Live inventory, shipment tracking |
|
User Behavior |
Real-time funnels, alerts |
|
Finance |
Microsecond trade analysis |
But real-time systems are complex: they fail harder, cost more, and demand tighter observability.
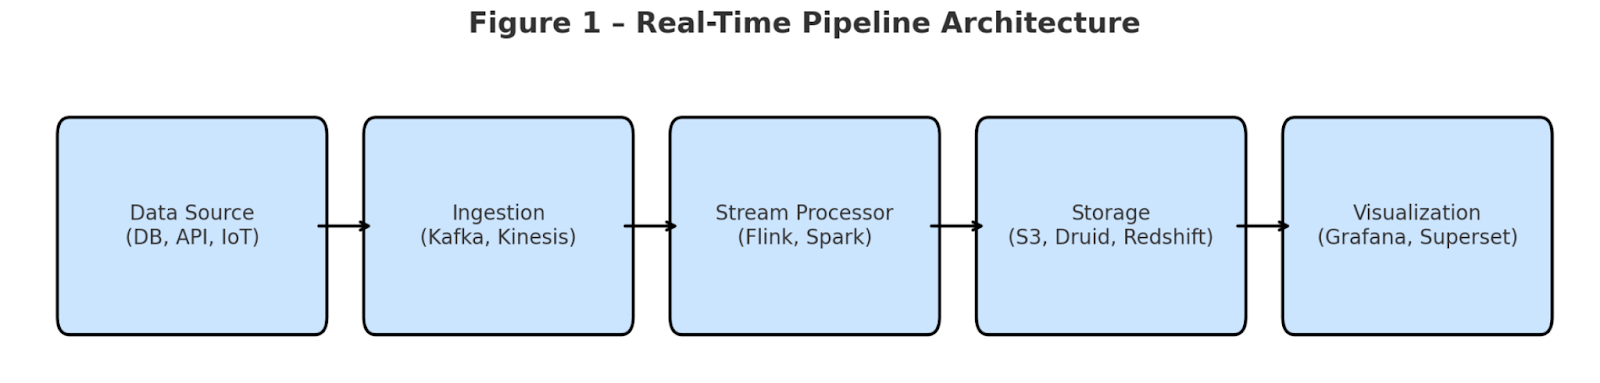
Architecture Overview
A basic real-time pipeline includes:
- Data Sources (e.g., app logs, DB CDC, sensors)
- Ingestion Layer (Kafka, Kinesis, Pub/Sub)
- Stream Processing (Apache Flink, Spark Streaming, Materialize)
- Storage (S3, Redshift, Druid, ClickHouse)
- Serving Layer (Grafana, Superset, API)
Real-World Stack That Worked
Here's one full stack I’ve implemented:
|
Layer |
Tools Used |
|
Ingestion |
Kafka + Schema Registry |
|
Processing |
Flink on Kubernetes |
|
Raw Storage |
Amazon S3 |
|
Query Storage |
Apache Druid |
|
BI Layer |
Apache Superset |
|
Alerting |
Prometheus + Grafana + Slack |
Key Lessons From the Field
1. Not Every Use Case Needs Kafka
Kafka is no doubt powerful — it's the go-to solution for scalable, durable event streaming. But the truth is, not every project needs that kind of heavyweight setup. Just because Netflix, Uber, or LinkedIn use Kafka doesn’t mean you should too.
Many teams get caught in the hype and realize too late that Kafka brings serious overhead: managing clusters, dealing with Zookeeper or Kraft setup, fixing partition issues, tuning consumer groups, and handling schema changes with Avro or Protobuf. Before long, your dev team ends up spending more time babysitting Kafka than building features.
Kafka is useful when:
- You need sub-second latency
- You expect millions of events per minute
- You need multiple consumers replaying or reading data independently
- Your architecture depends on durability, partitioning, and ordering guarantees
- You need exact-once semantics with stream joins or transactions
Example:
If you're building a fraud detection system where a1-second delay = financial loss, Kafka might be your best friend.
But sometimes, simple is better.
Let’s say you’re:
- Logging user events
- Syncing data every 10 seconds
- Handling IoT sensor readings every minute
- Pushing metrics to a dashboard with <10s lag tolerance
Do you really need to deal with partitions, topics, brokers, and rebalancing?
Enter managed alternatives:
Tool
Notes
Amazon Kinesis
Fully managed, easy to scale, no cluster headaches
Google Pub/Sub
Great for push/pull + auto-scaling
Azure Event Hubs
Kafka-compatible, enterprise-ready
Redis Streams
Lightweight, fast, perfect for <5 consumers
| Tool | Notes |
|
Amazon Kinesis |
Fully managed, easy to scale, no cluster headaches |
|
Google Pub/Sub |
Great for push/pull + auto-scaling |
| Azure Event Hubs | Kafka-compatible, enterprise-ready |
| Redis Streams | Lightweight, fast, perfect for <5 consumers |
Real Comparison: Kafka vs. Kinesis
|
Feature |
Kafka (Self-managed) |
Amazon Kinesis |
|
Latency |
<1s |
~1s–2s |
|
Scaling |
Manual |
Auto (shards) |
|
Replayability |
Strong (offsets) |
Good (24hr+ retention) |
|
Setup Time |
Days (infra + tuning) |
Minutes |
|
Dev Effort |
High |
Low |
2. Stream Joins are Tough
Joining two real-time streams — like an order stream and an inventory stream — sounds simple in theory, but it's one of the trickiest parts of stream processing in practice. Unlike batch joins, where all data is available at once, stream joins deal with events arriving continuously and sometimes out of order.
One of the biggest headaches is handling late-arriving data — imagine an inventory update that reaches your stream processor 10 seconds after the related order has already passed through. Without careful handling, that event is either dropped or causes incorrect results.
To fix this, you need to join streams using event time (not processing time), define proper window durations (like 5-minute sliding or tumbling windows), and use watermarks to manage lateness. Even then, there’s the risk of state size exploding if windows are too wide or events too delayed.
It becomes even harder when you introduce deduplication and out-of-order replays into the mix. If not designed carefully, stream joins will silently cause data mismatches and kill the reliability of your pipeline.
3. SQL for the Win
Look, we’ve all seen those massive Flink or Spark jobs with hundreds of lines just to do a basic join or aggregation. But here’s the thing — you don’t need to write all that anymore. Today, tools like Materialize, Flink SQL, and even Athena over streaming S3 logs let you write real-time logic using just plain old SQL.
And that is really powerful.
Why burn days building a Flink job from scratch when a single SQL view can give you the same result — with better readability, easier debugging, and fewer moving parts? I’ve worked on pipelines where just replacing code with SQL dropped our dev time by 70%. Plus, when you’re working in a team — analysts, data engineers, even PMs — everyone understands SQL. Not everyone wants to read Java + state stores + watermark logic.
Today’s engines handle all that behind the scenes: incremental processing, event-time joins, deduplication, late arrivals, the whole deal. So yeah, before reaching for the big guns, ask yourself — can this be solved with just a SQL view? Because chances are… it can.
4. Storage: Cold + Hot
Always store raw logs in cold storage (S3) and processed aggregates in hot storage (Druid/ClickHouse).
- Cold = replay, audits, ML training
- Hot = dashboards, alerts, low-latency queries
5. Monitoring Isn’t Optional
If ingestion lags, schema breaks, or your Flink job silently crashes — no one will know until it’s too late
Designing a real-time data pipeline is only half the job — ensuring it stays reliable under production load is just as critical. These systems often don’t throw errors when something goes wrong. Instead, they degrade quietly: consumer lag increases, throughput drops, or events get delayed without immediate visibility. That’s why effective monitoring is essential.
Grafana, when integrated with sources like Prometheus, JMX Exporter, Kafka Exporter, or Flink TaskManager metrics, allows teams to track detailed system health, data flow performance, and quality indicators — all in one dashboard..
Image courtesy of Grafana.com – Kafka Integration Dashboard Source
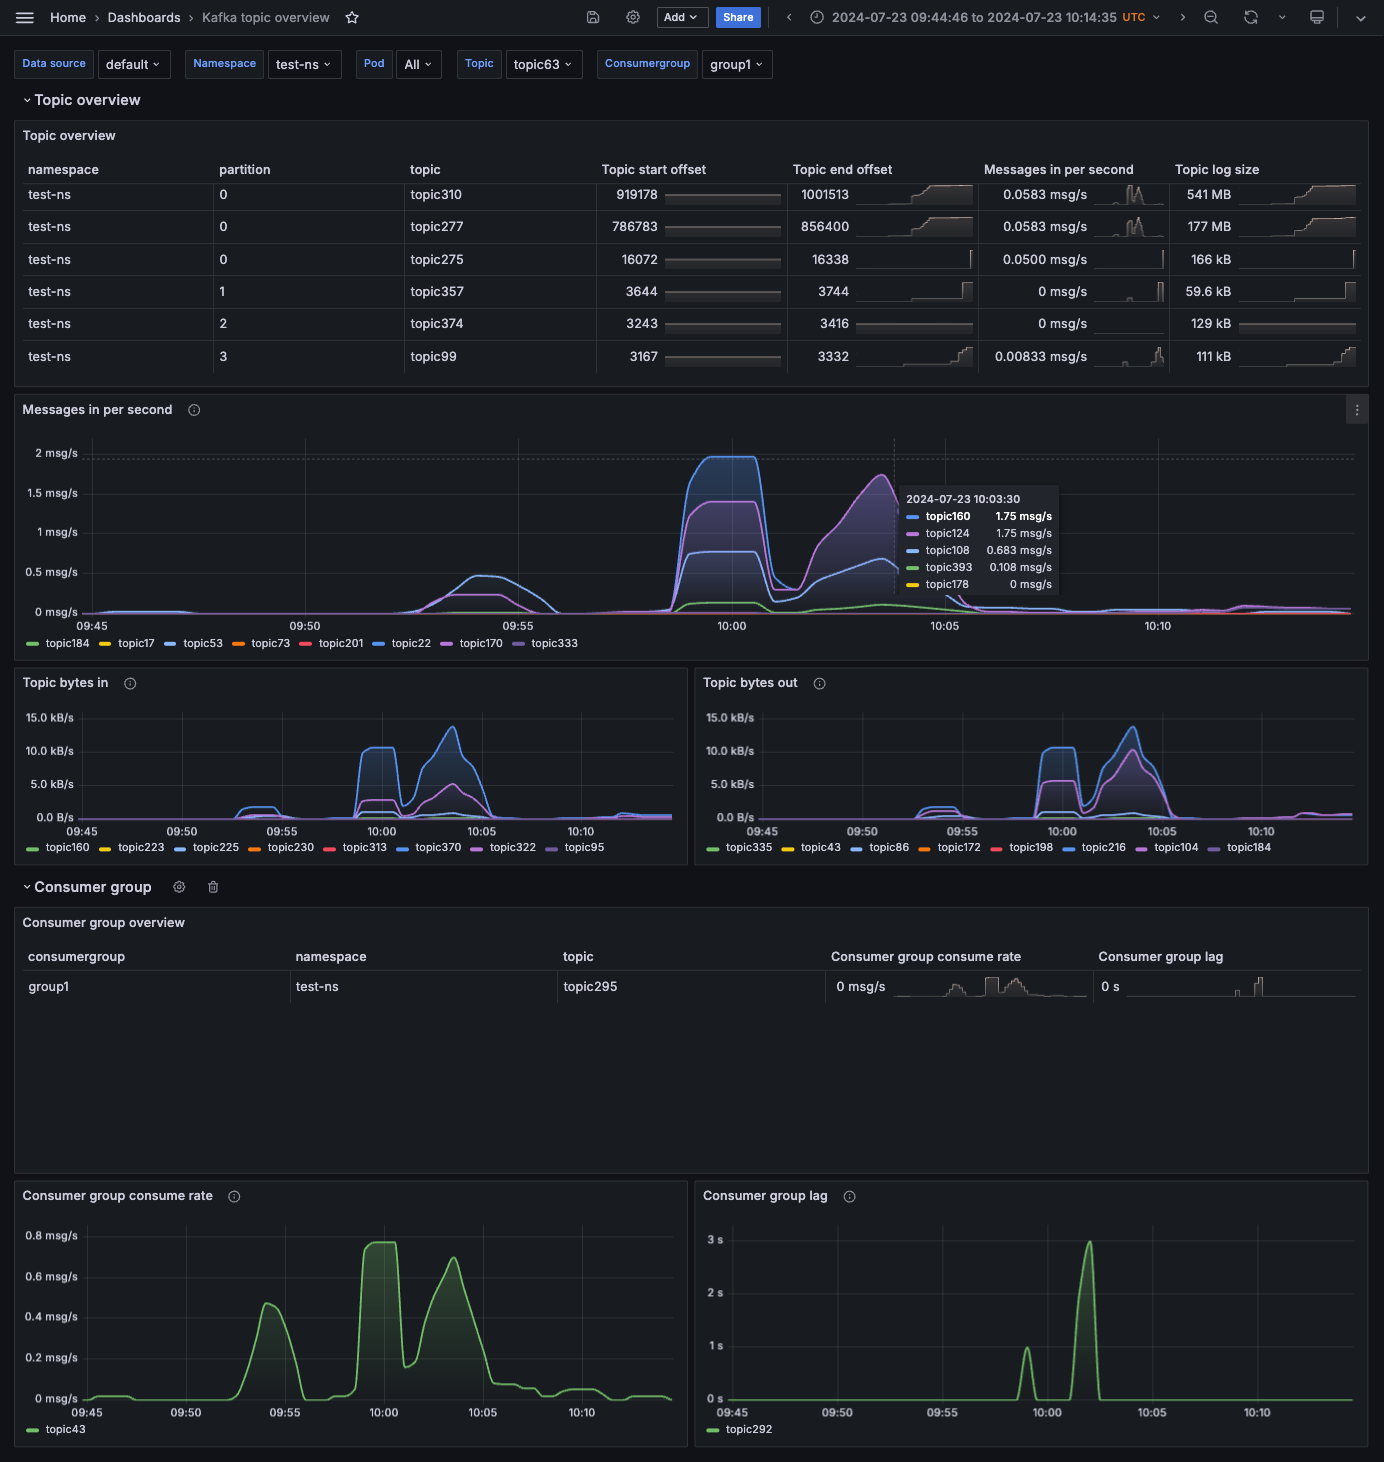
Below are the key metrics categories you should monitor for real-time pipelines, each one helping to detect issues before they impact downstream consumers or users.
Data Ingestion
- Kafka consumer lag: <2s (optimal), 2-5s (warning), >5s (critical)
- Message throughput: [X] msgs/sec (expected: [Y] msgs/sec)
- Schema validation errors: [count] per hour
Stream Processing
- Flink checkpoint success rate: [X]% (target >99%)
- Average event processing time: [X] ms
- Backpressure indicators: [true/false]
System Health
- CPU utilization: [X]% (threshold: 70%)
- Memory utilization: [X]% (threshold: 80%)
- JVM GC pauses: [X] ms (threshold: 100ms)
Data Quality
- Dead letter queue size: [X] messages
- Late arriving events: [X] per hour
- End-to-end latency: [X]s (target <1s)
Alerting
- Primary notification channel: Slack (#alerts-real-time)
- Secondary escalation: PagerDuty (SEV-2+)
- Alert suppression window: 5 minutes
Final Thoughts
Real-time analytics can be game-changing — powering faster decisions, better customer experiences, and tighter feedback loops. But the tech stack behind it needs to be chosen carefully. One of the most important lessons? Kafka isn’t always required.
Yes, Kafka is powerful and highly flexible, but it also demands serious engineering effort: tuning partitions, managing brokers, handling failovers, and monitoring lag. If you’re not solving a problem that specifically needs that level of control or customization, it might be overkill.
For very large-scale, fully managed services like Amazon Kinesis, Google Pub/Sub, or Redis Streams are a better fit. They offer the performance and scalability needed for production workloads, but with significantly less operational complexity. That means your team spends more time focusing on business logic and delivery, not infrastructure management.
Start simple, build observability early, and always keep a replay mechanism (like S3). Real-time should empower your team, not exhaust it.
Opinions expressed by DZone contributors are their own.
Comments