Lessons Learned While Building Near Real-Time Network Traffic Analyzer
How we built a real-time network traffic analyzer and what important points to pay attention to when developing high-performance network applications.
Join the DZone community and get the full member experience.
Join For FreeOnce before, we had to implement a software service for *nix systems to provide real-time and historical insights on the traffic passing through them.
At Plexteq, we develop complex networking and security applications. We would like to share how we approached the challenge and show what are important points to pay attention to when developing high-performance network applications.
Introduction
The following are just a few of the strict requirements we met:
- Fast and resource-efficient with decent bandwidth workloads (100-1000Mbps)
- Built to run cross-platform in the future with no significant efforts
- Stats written in a way to integrate with ETL and BI systems easily
Fast operation and a small memory footprint were the essential requirements, as the traffic analyzer clearly should have been an agent that helps understand the traffic flows better, without hindering the main processes those nodes were supposed to run. It was also decided to use C/C++ for the implementation.
The customer wanted to be able to run analytical processing and required the following dimensions to be supported:
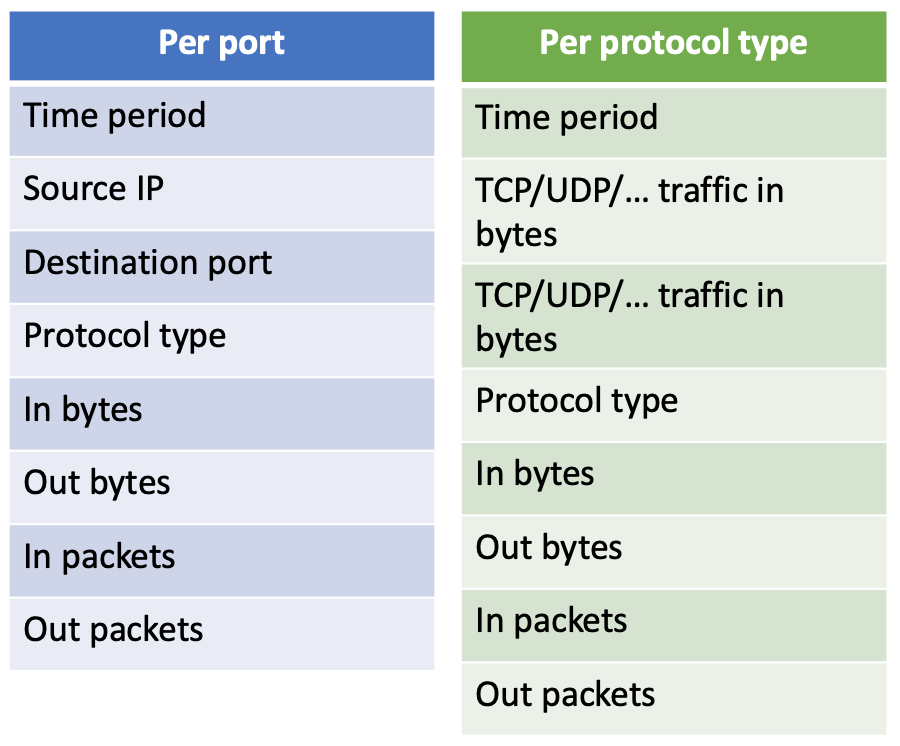
Following the given dimensions, it narrowed down the gathering of information about input/output network packets traveling at any time, including their type (i.e., UDP, TCP, ICMP) and size.
The high-level architecture looked as shown below. The parts in green are something we had to deliver. All other components are external and interact with the traffic analyzer through the data storage layer.
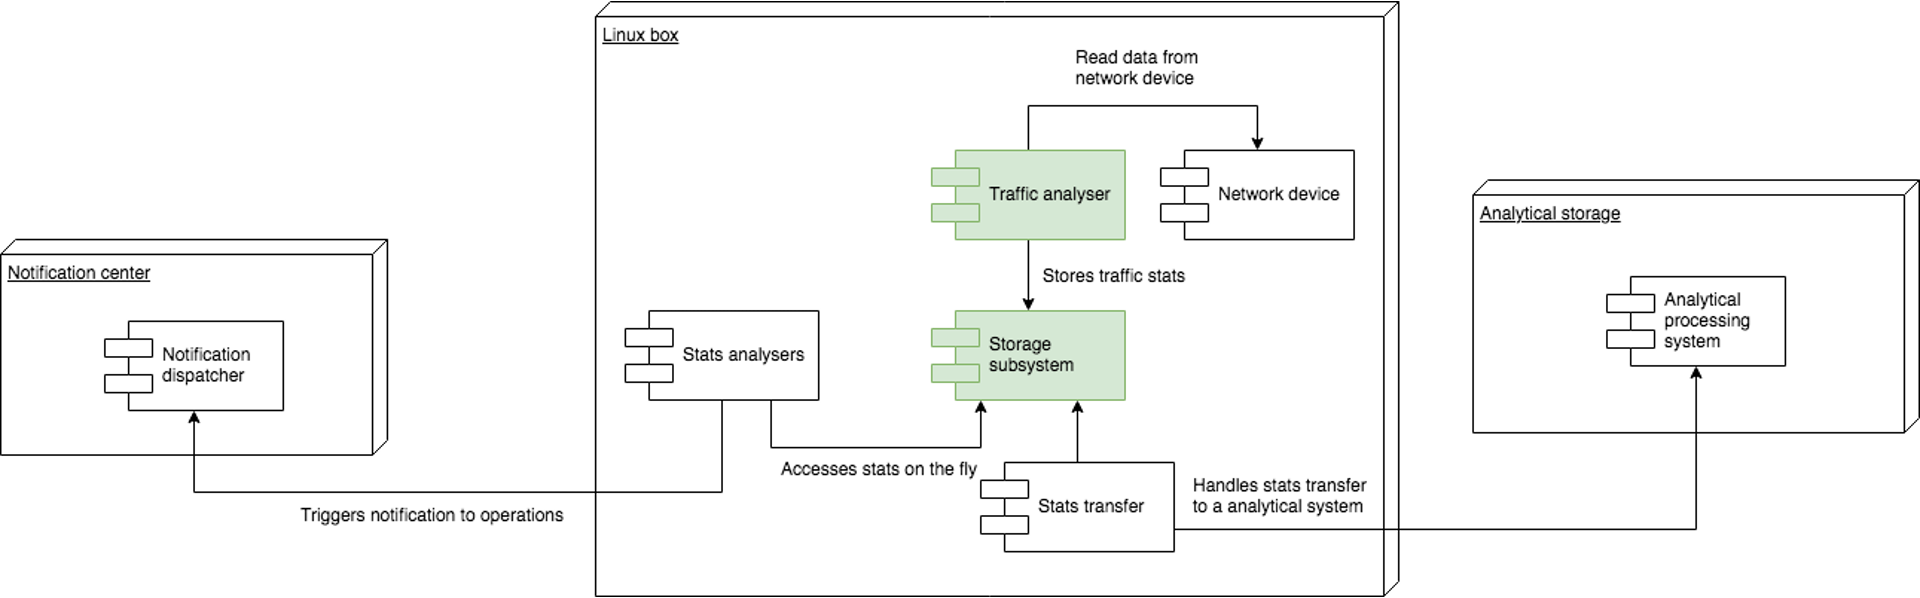
Under the storage layer, we understand persistent storage in an interoperable format, to which the traffic analyzer had to flush the statistics. It was essential to make that format usable by other components.
Therefore, our three significant challenges were:
- Ensure low footprint network traffic intercepting and analyzing
- Ensure efficient network traffic stats aggregation
- Implement stats persistence using an interoperable data format
Let’s briefly examine how we solved all of these problems above.
Network Traffic Intercepting and Analyzing
In Linux, there are many tools to grab the traffic - tcpdump, wireshark, iptables in the logging mode, and many more.
We have found that the most popular tools, such as tcpdump and wireshark, are pretty heavy on resources. So, using them for piping the output to some file or database takes a lot of system resources (like up to 60% of CPU), which was not a good fit for us.
While tcpdump is very powerful, something like the example below didn’t work for us from the performance considerations:
xxxxxxxxxx
$ tcpdump -i eth0
$ tcpdump tcp port 443
$ tcpdump tcp ‘port 443 or port 80’
$ tcpdump tcp ‘port 443 or port 80’ -w out-file
Iptables’ traffic logging approach could be accomplished by adding appropriate rules:
xxxxxxxxxx
$ iptables -A INPUT -p ICMP --icmp-type 8 -j LOG --log-prefix "Iptables: Ping detected: "
That command asks the kernel to log ICMP type 8 packets. The target file will consist of the following records for every packet received:
kernel: [122972.300408] Iptables: Ping detected: IN=eth0 OUT= MAC=00:64:d9:36:7b:d7:00:24:2d:a6:e2:43:08:91 SRC=xxx.xxx.xxx.xxx DST=xxx.xxx.xxx.xxx LEN=60 TOS=0x00 PREC=0x00 TTL=124 ID=23020 PROTO=ICMPTYPE=8 CODE=0 ID=33602 SEQ=2462
A technique such as this is resource-heavy as it dumps all packet metadata to a file. It completely exhausts I/O and free disk space. Another issue is that to make iptables log usable for analytical processing, we had to develop another tool for parsing that output and storing it in a format that matches the given requirements.
To summarize the issues with the approaches stated below:
tcpdump / wireshark
- Single-threaded
- Large disk space overhead
- Not possible to write with custom data format (extra parsing efforts of .pcap file is needed)
iptables
- Could work, but it will be hard to customize in the case of further feature requests
- Not a cross-platform
So it seemed like the existing means weren’t a match, and we needed to build a new bicycle. As passionate developers who love just that, we were quite excited.

Okay, so we want to capture traffic from the kernel, how do we accomplish that?
Analysis revealed a number of solutions available:
- raw sockets
- pf_ring
- 3rd party libraries
- libtins
- pcapplusplus
- libpcap
Raw Sockets
Applications that use raw sockets can read any inbound network packets, including those headed to other applications running on the system. Raw sockets provide a way to bypass the whole network stack traversal of a packet and deliver directly to a listening application.
To see what happens when we read data from sockets, let’s use this C program that sniffs packets entering the system and prints out some information about the packet as an example.
xxxxxxxxxx
int main()
{
// Structs that contain source IP addresses
struct sockaddr_in source_socket_address, dest_socket_address;
int packet_size;
// Allocate string buffer to hold incoming packet data
unsigned char *buffer = (unsigned char *)malloc(65536);
// Open the raw socket
int sock = socket (PF_INET, SOCK_RAW, IPPROTO_TCP);
if(sock == -1)
{
//socket creation failed, may be because of non-root privileges
perror("Failed to create socket");
exit(1);
}
while(1)
{
// recvfrom is used to read data from a socket
packet_size = recvfrom(sock , buffer , 65536 , 0 , NULL, NULL);
if (packet_size == -1) {
printf("Failed to get packets\n");
return 1;
}
struct iphdr *ip_packet = (struct iphdr *)buffer;
memset(&source_socket_address, 0, sizeof(source_socket_address));
source_socket_address.sin_addr.s_addr = ip_packet->saddr;
memset(&dest_socket_address, 0, sizeof(dest_socket_address));
dest_socket_address.sin_addr.s_addr = ip_packet->daddr;
printf("Incoming Packet: \n");
printf("Packet Size (bytes): %d\n",ntohs(ip_packet->tot_len));
printf("Source Address: %s\n", (char *)inet_ntoa(source_socket_address.sin_addr));
printf("Destination Address: %s\n", (char *)inet_ntoa(dest_socket_address.sin_addr));
printf("Identification: %d\n\n", ntohs(ip_packet->id));
}
return 0;
}
Now, with raw sockets, all packets coming in over the server’s network device can be read. Applications that open raw sockets have to filter out packets that are not relevant by parsing the TCP headers.
Drawbacks of the raw socket approach are:
- Kernel-to-userspace data copies. This results in excessive I/O. In the recent Linux kernels, this may be alleviated by using a memory-mapped approach with mmap syscall.
- A developer needs to be proficient with packet structure and low-level networking semantics, including endianness.
While the raw socket approach is a viable one, we did decide to investigate other options available. Nevertheless, we think that developers who are practicing their network programming skills should give raw sockets a try, at the suggestion of Ryan Dahl:
"You can never understand everything. But you should push yourself to understand the system"
- Ryan Dahl,
Creator of Node.js
PF_RING![]()
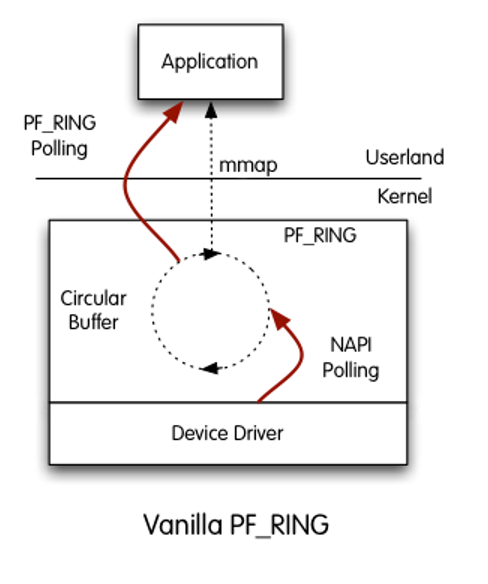
PF_RING is a Linux kernel module and user-space framework that supports high-throughput packet capture by using a kernel module and modified network device drivers. It makes use of a ring buffer under the hood that’s available to user-space, and requires applications to use its API or a modified version of libpcap.
In a nutshell, it allows you to bypass the kernel and read directly from the wire. Because the Linux kernel has too many bells and whistles, it presents a kind of “bottleneck” for high-volume traffic processing. For instance, vanilla Linux kernel can process up to 1-2Mpps traffic on decent hardware. At the same time, PF_RING developers claim it can process up to 15Mpps.
Pros:
- Can handle huge workloads
- Could be used for network server application development
- Utilizes zero-copy technique
Cons:
- Complicated API
- Support on network card driver level is preferred (Intel cards are preferred)
- Not cross-platform
- Requires specific kernel module and network driver
- Not an open-source
- Not free, you need to pay for a license
Therefore the PF_RING solution might be a perfect match for building a high-throughput network software that runs under specific hardware like a network router or firewall. However, it’s overkill for a general-purpose traffic stats collecting application that we were implementing.
3rd Party Open-Source Libraries
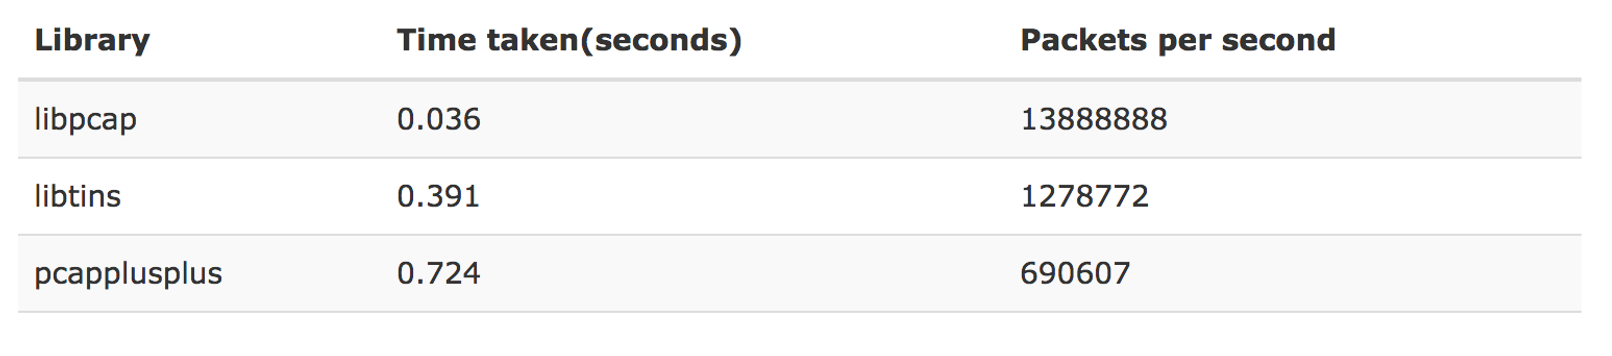
There are quite a lot of 3rd party libraries available. We have picked a few of them and ran a synthetic test to examine how many packets they may pump through. And the winner is: libpcap.
Pros:
- Cross-platform
- Supports PF_RING
- Supports PACKET_MMAP
- The most fast implementation
- Well maintained
- Relatively easy API
PACKET_MMAP is a Linux API for fast packet sniffing, available in vanilla kernels since version 2.6. It utilizes a circular buffer mapped in user space (yay, no kernel to userspace copies which means no context switches!) for sending or receiving packets. Performance-wise, it processes faster than raw sockets.
Plugging and using libpcap is actually a very simple process. There are only four easy steps:
- We begin by determining which interface we want to sniff. In Linux this may be something like eth0.
- Initialize pcap. This is where we actually tell pcap what device we are sniffing. We can, if we want to, sniff multiple devices.
- Finally, we tell pcap to enter its primary execution loop. In this state, pcap waits until it has received however many packets we want, or receive infinitely if we pass -1 to pcap_loop as a 2nd argument. Every time it gets a new packet in, it calls a callback function. The function that it calls can do anything we want.
- After our sniffing needs are satisfied, we close our session and it’s complete.
Let’s throw in some code and see how to get it to work:
xxxxxxxxxx
/* callback function when packet have captured */
static void mycb(u_char *user,
const struct pcap_pkthdr *h, const u_char *packet)
{
static int count = 1;
printf("Packet %d:\n", count);
printf(" user: %x\n", user);
printf(" h: %x\n", h);
printf(" h->ts: %d.%d\n", h->ts.tv_sec, h->ts.tv_usec);
printf(" h->caplen: %d\n", h->caplen);
printf(" h->len: %d\n", h->len);
printf(" packet: %x\n", packet);
if(count >= 3) {
pcap_breakloop((pcap_t*)user);
} else {
count += 1;
}
}
int main (int argc, char* argv[])
{
/* the error code buf of libpcap, PCAP_ERRBUF_SIZE = 256 */
char ebuf[PCAP_ERRBUF_SIZE];
char *dev;
pcap_t *pd;
int pcap_loop_ret;
/* grab a device to peak into */
dev = pcap_lookupdev(ebuf);
if (dev == NULL) {
/* e.g. "no suitable device found" */
printf("pcap_lookupdev error: %s\n", ebuf);
abort();
} else {
printf("pcap_lookupdev returned: %s\n", dev);
}
/* create capture handler of libpcap */
pd = pcap_open_live(dev, 1024, 0, 1000, ebuf);
if (pd == NULL) {
/* e.g. "Operation not permitted" */
printf("pcap_open_live error: %s\n", ebuf);
abort();
}
/* start the loop of capture */
pcap_loop_ret = pcap_loop(pd, -1, mycb, (u_char*)pd);
printf("pcap_loop returned: %d\n", pcap_loop_ret);
pcap_close(pd);
return 0;
}
That’s already something! It satisfied our needs, and we moved further along to solve other challenges we had.
Network Stats Storage Layer
For storing network traffic statistics, we were looking for a solution that matches the following requirements:
- Fast with a small footprint
- Preferably a one file database
- Embeddable (i.e., doesn’t require a standalone server setup)
- Supports SQL
- Supports B-tree indices and advanced querying

We didn’t want to use a standalone full-fledged network SQL server, which would have been a significant resource overkill. As we had a previous experience with SQLite, we decided to go for it, as it perfectly matched our requirements.
The only significant drawback of SQLite is the lack of thread-safety on data writes - only one thread can modify data at a time. The reason is simple - SQLite, in a nutshell, is a fopen replacement, and there is no built-in write concurrency management.
Working with SQLite is straightforward.
The following sample shows how to open/close a database.
xxxxxxxxxx
int main(int argc, char* argv[])
{
sqlite3 *db;
char *zErrMsg = 0;
int rc;
rc = sqlite3_open("test.db", &db);
if (rc) {
fprintf(stderr, "Can't open database: %s\n", sqlite3_errmsg(db));
return(0);
} else {
fprintf(stderr, "Opened database successfully\n");
}
sqlite3_close(db);
}
Inserting data is easy-peasy too.
xxxxxxxxxx
/* Create SQL statement */
sql = "INSERT INTO COMPANY (ID,NAME,AGE,ADDRESS,SALARY) " \
"VALUES (1, 'Paul', 32, 'California', 20000.00 ); " \
"INSERT INTO COMPANY (ID,NAME,AGE,ADDRESS,SALARY) " \
"VALUES (2, 'Allen', 25, 'Texas', 15000.00 ); " \
"INSERT INTO COMPANY (ID,NAME,AGE,ADDRESS,SALARY)" \
"VALUES (3, 'Teddy', 23, 'Norway', 20000.00 );" \
"INSERT INTO COMPANY (ID,NAME,AGE,ADDRESS,SALARY)" \
"VALUES (4, 'Mark', 25, 'Rich-Mond ', 65000.00 );";
/* Execute SQL statement */
rc = sqlite3_exec(db, sql, callback, 0, &zErrMsg);
if (rc != SQLITE_OK) {
fprintf(stderr, "SQL error: %s\n", zErrMsg);
sqlite3_free(zErrMsg);
} else {
fprintf(stdout, "Records created successfully\n");
}
Data selection requires a dedicated callback function:
x
static int callback(void *data, int argc, char **argv, char **azColName)
{
int i;
fprintf(stderr, "%s: ", (const char*)data);
for(i = 0; i < argc; i++) {
printf("%s = %s\n", azColName[i], argv[i] ? argv[i] : "NULL");
}
printf("\n");
return 0;
}
int main(int argc, char* argv[])
{
// initialization code goes here
// ...
/* Create SQL statement */
sql = "SELECT * from COMPANY";
/* Execute SQL statement */
rc = sqlite3_exec(db, sql, callback, (void*)data, &zErrMsg);
if (rc != SQLITE_OK) {
fprintf(stderr, "SQL error: %s\n", zErrMsg);
sqlite3_free(zErrMsg);
} else {
fprintf(stdout, "Operation done successfully\n");
}
// finalization code goes here
// ...
}
More complicated samples are available on the official SQLite documentation.
We liked the API, syntax, low complexity, and rich feature set.
Since we did pick up a toolchain to grab the traffic and store the stats, we moved forward to finally glue it altogether.
Network Traffic Stats Aggregation
We started with the most straightforward implementation so that the callback function delegates packet metadata to an aggregator module that flushes data to an SQLite every 500 milliseconds.
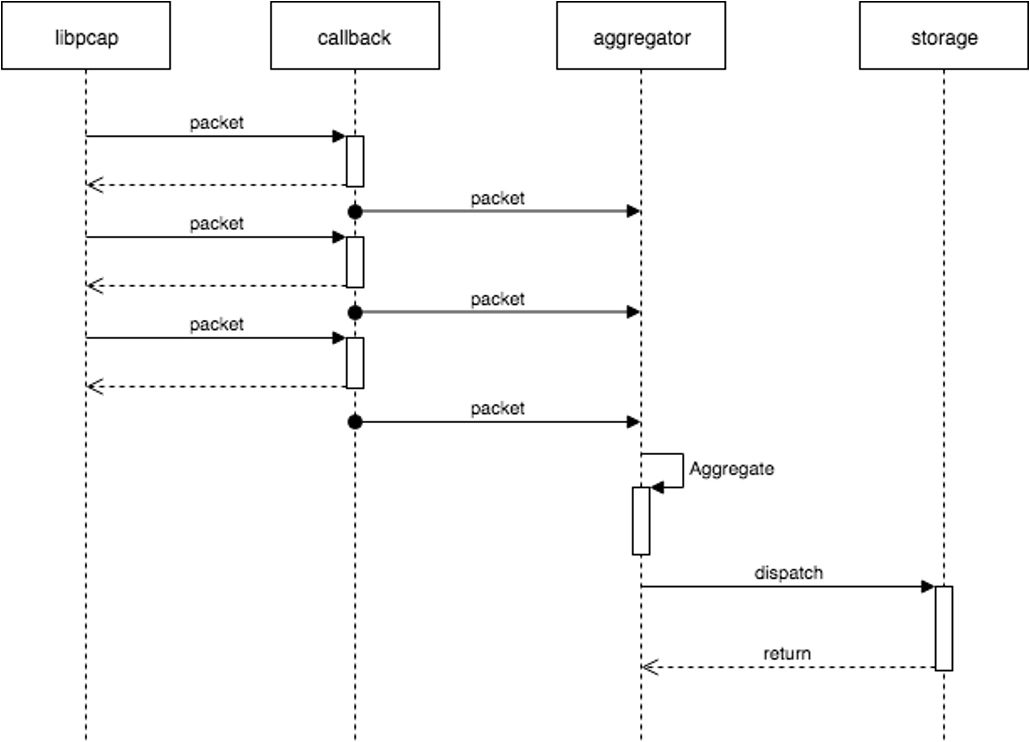
However, we hit a bottleneck: the aggregator was not following up on traffic bandwidth that is more than 25Mbps. We got a continually increasing delay between incoming traffic and flushed stats.
This is a classic example of a producer-consumer problem. Where libpcap is a high-performing producer and aggregator is a single slow consumer.
The solution was straightforward:
- Separate producer and consumer threads
- Implement multiple consumers that run each in a separate thread
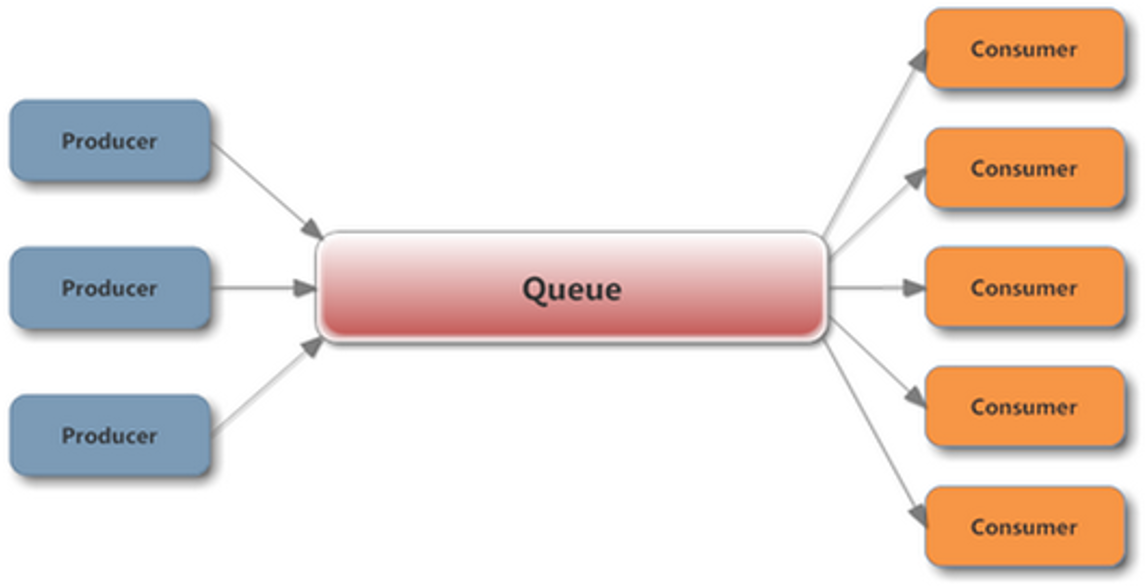
Such a problem could be solved using these different approaches:
- A ring buffer
- A blocking queue
Both the solutions mentioned applied to our case. Tests didn’t reveal a leader - both of them showed almost the same performance level.
We decided to go with a blocking queue. We picked up an implementation from the APR (Apache Portable Runtime) library used by the Apache web server as it perfectly matched the footprint and cross-platform requirements.
xxxxxxxxxx
// ...
apr_pool_t *queuePool = NULL
apr_allocator_t *poolAllocator = NULL;
apr_queue_t *queue = NULL;
apr_pool_create(&queuePool, NULL);
poolAllocator = apr_pool_allocator_get(queuePool);
apr_allocator_max_free_set(poolAllocator, POOL_MAX_FREE_BLOCKS);
apr_queue_create(&queue, QUEUE_MAX_ELEMENTS, queuePool);
// pushing by void pointer to the queue
// this is to be done in producer thread
// call with block if queue is full
apr_queue_push(queue, (void*) e);
// retrieving element from the queue
// this is to be done in consumer threads
// call with block if queue is empty
int s = apr_queue_pop(queue, (void**) e);
if (s != APR_SUCCESS) *e = NULL;
After we implemented the blocking queue mechanism, we saw a drastic improvement in the performance. Adding the blocking queue helped to reach the performance balance between data production and consumption.
Results:
- Application was now capable to handle about 82Mbps of traffic flow
- CPU usage was 100+% utilized by our app
100+% CPU utilization didn’t look good. We profiled the app and found that CPU time was “eaten” by a tremendous amount of malloc calls.
Our problem was in allocating a small memory chunk to store packet metadata for every packet we were getting from libpcap. Therefore, we focused on reducing the malloc calls.
We redesigned the layout of our structures, but we still had many malloc calls hogging the CPU. We decided to use the memory pooling technique. This way, memory allocations within a single batch persisted to an SQLite to be performed against a preallocated pool.
As a result, we got a single large allocation completed upon a batch initialization. All the subsequent allocations cost dropped to pointer arithmetic. The memory release for the packet metadata time was also simplified to just one operation.
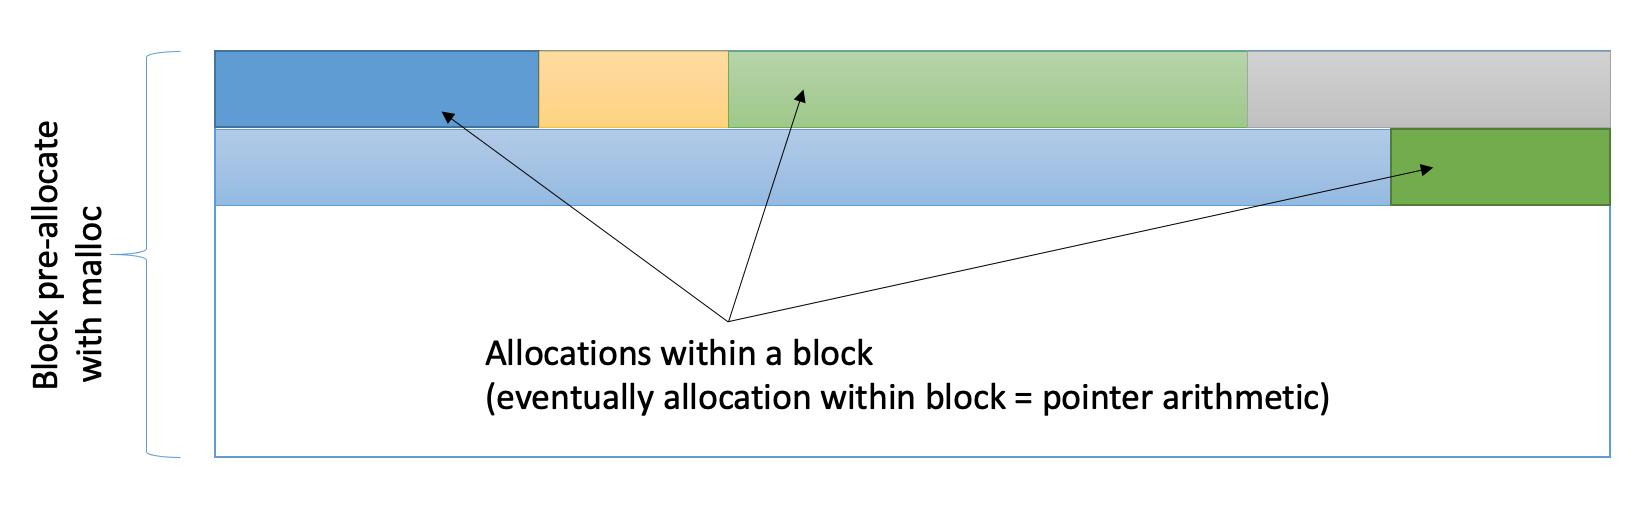
There are multiple open-source memory pool implementations available. However, we did pick up the one from the APR library as we were already using it for blocking queues.
Using APR memory pool API is pretty simple:
xxxxxxxxxx
apr_pool_t *pool;
// initializing pool
apr_pool_create(&pool, NULL);
// making an allocation on the pool
struct proto_stats *icmp;
icmp = (struct proto_stats *) apr_palloc(pool, sizeof(struct proto_stats));
memset(icmp, 0, sizeof(struct proto_stats));
// freeing the pool
apr_pool_destroy(pool);
The only drawback of the memory pool lies in the lack of possibility to free the individual elements. So it’s not possible to reuse previous allocations on it.
The integration of memory pooling allowed us to get rid of the malloc bottleneck. On four-core Xeon 2.8Ghz, we got the following testing results:
Linux
- Application is capable of handling ~1Gbps of traffic flow
- CPU usage is 10-15%
FreeBSD
- Application is capable of handling ~615Mbps of traffic flow
- CPU usage is 35%
Threads / Locking
CPU usage of 35% on the BSD wasn't acceptable for us. We went further and profiled our solution thoroughly.
We did spot a lot of thread synchroniza tion calls from our app, such as pthread_mutex_lock and pthread_mutex_unlock.
We indeed used POSIX mutexes for merging statistics coming from callbacks to guarantee the batch's consistency. It was the right time to improve it!
Investigation has shown that:
- pthread_mutex_* in Linux is implemented using futexes (fast user-space mutex), no locking, no context switching
- OSX/FreeBSD uses a heavier approach which incurs a context switching
You may ask why they have different implementations - it’s because POSIX is a standard. It doesn’t mandate a specific implementation. It just requires implementations to conform to the defined contract. Therefore, different operating systems are free to implement in the way they decide.
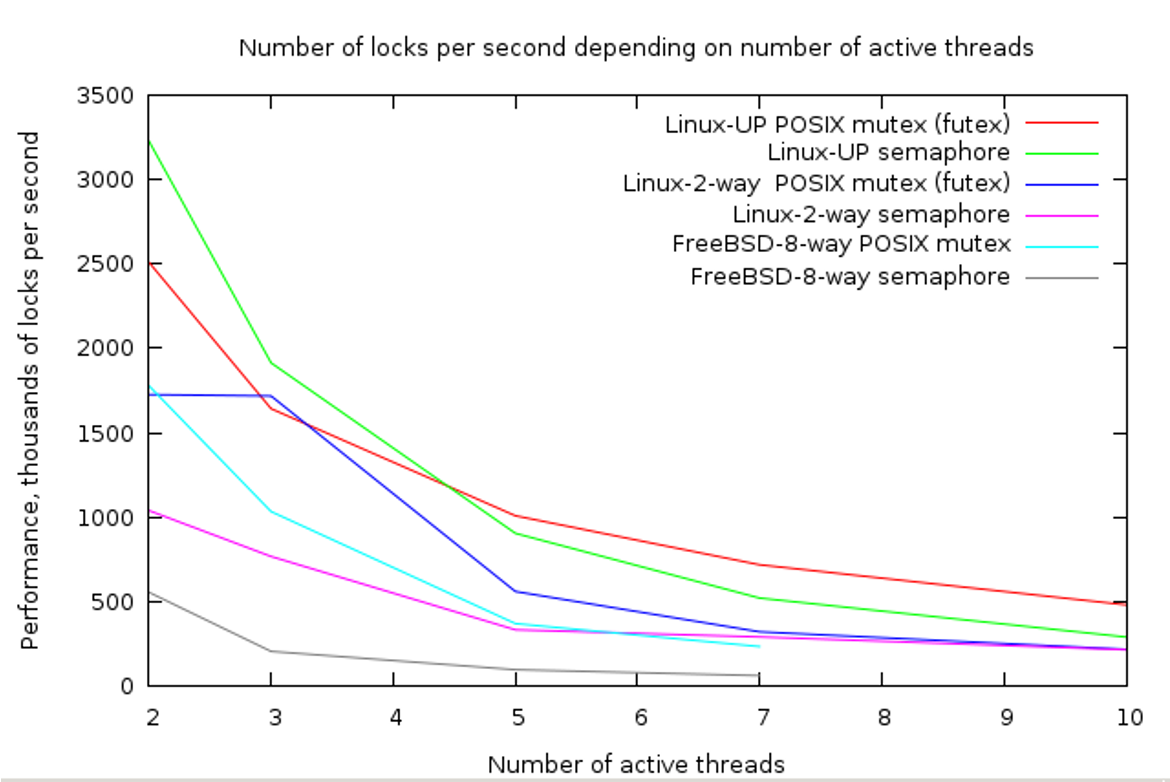
That brought us to our conclusion about why FreeBSD’s behavior varied from the one we’ve been observing on Linux.
The next step was to find an improvement to get rid of costly thread synchronization primitive.
If we check the common synchronization approaches, we’ll find that there are two main groups:
Lock based:
- Semaphore
- Mutex
Lock free:
- Futex (could lock in an edge case)
- Spinlock
- CAS based spinlock
Spinlocks cause the calling thread to wait in a loop ("spin") while repeatedly checking if the lock is available, instead of making a context switch and yielding execution to another thread. Since the thread remains active but is not performing a useful task, the use of such a lock is a kind of busy waiting.
Since our target critical-section didn't do I/O but just pointer operations and arithmetic operations, it was reasonable to use the spinlock as the cost of context switch is times more expensive.
Developers may try the spinlock by using a pthread_spin_lock or use CAS operations provided by compiler harnesses.
For instance GCC has following atomic built ins:
- __sync_lock_test_and_set
- __sync_lock_release
Example:
xxxxxxxxxx
volatile int lock = 0;
void *worker(void*)
{
while (__sync_lock_test_and_set(&lock, 1));
// critical section
__sync_lock_release(&lock);
}
Here’s how it works:
- Volatile suggests that “lock” may be changed by other threads
- __sync_lock_test_and_set, __sync_lock_release are atomic builtins which guarantee atomic memory access
- __sync_lock_test_and_set atomically sets 1 and returns 0
- If lock == 1, we keep looping until another thread calls __sync_lock_release
Introducing such a locking approach allowed FreeBSD results to improve drastically:
Linux
- Application is capable of handling ~1Gbps of traffic flow
- CPU usage is 9-13% on 4 core Xeon 2.8Ghz
FreeBSD
- Application is capable of handling ~1Gbps of traffic flow
- CPU usage is 8-12% on 4 core Xeon 2.8Ghz
Such results were acceptable for both platforms.
Eventually, this project was open-sourced by our team and currently is available on GitHub. Check it out here: https://github.com/plexteq/PQTrafficCollector.
Happy coding!
Opinions expressed by DZone contributors are their own.
Comments