How I Made My Liberty Microservices Load-Resilient
The journey of a cloud incident that transformed fragile Liberty microservices into a resilient, self-healing system that scales effortlessly under load.
Join the DZone community and get the full member experience.
Join For FreeIt started with an all-too-familiar problem: As the traffic spiked, our microservices started slowing down, some even crashing under the pressure. Users experienced frustrating delays and outright bulk API request failures, and reliability took a hit.
IBM Liberty gave us a solid, lightweight foundation, but we needed to do more. To keep things running smoothly, we had to fine-tune our architecture and make our services truly resilient to heavy loads.
This blog is a deep dive into how we optimized various layers of the architecture in a short span of time. We cover various strategies that helped prevent crashes and keep things running smoothly. By the end, you’ll see how we transformed our fragile microservices into a rock-solid, self-healing system that can take on anything we throw at it.
We started with two goals for ourselves:
- Increase the throughput to an acceptable level
- At peak load, the performance needs to gracefully degrade
Application Architecture
Here is a simplified version of the application architecture, highlighting the key components involved in the analysis.
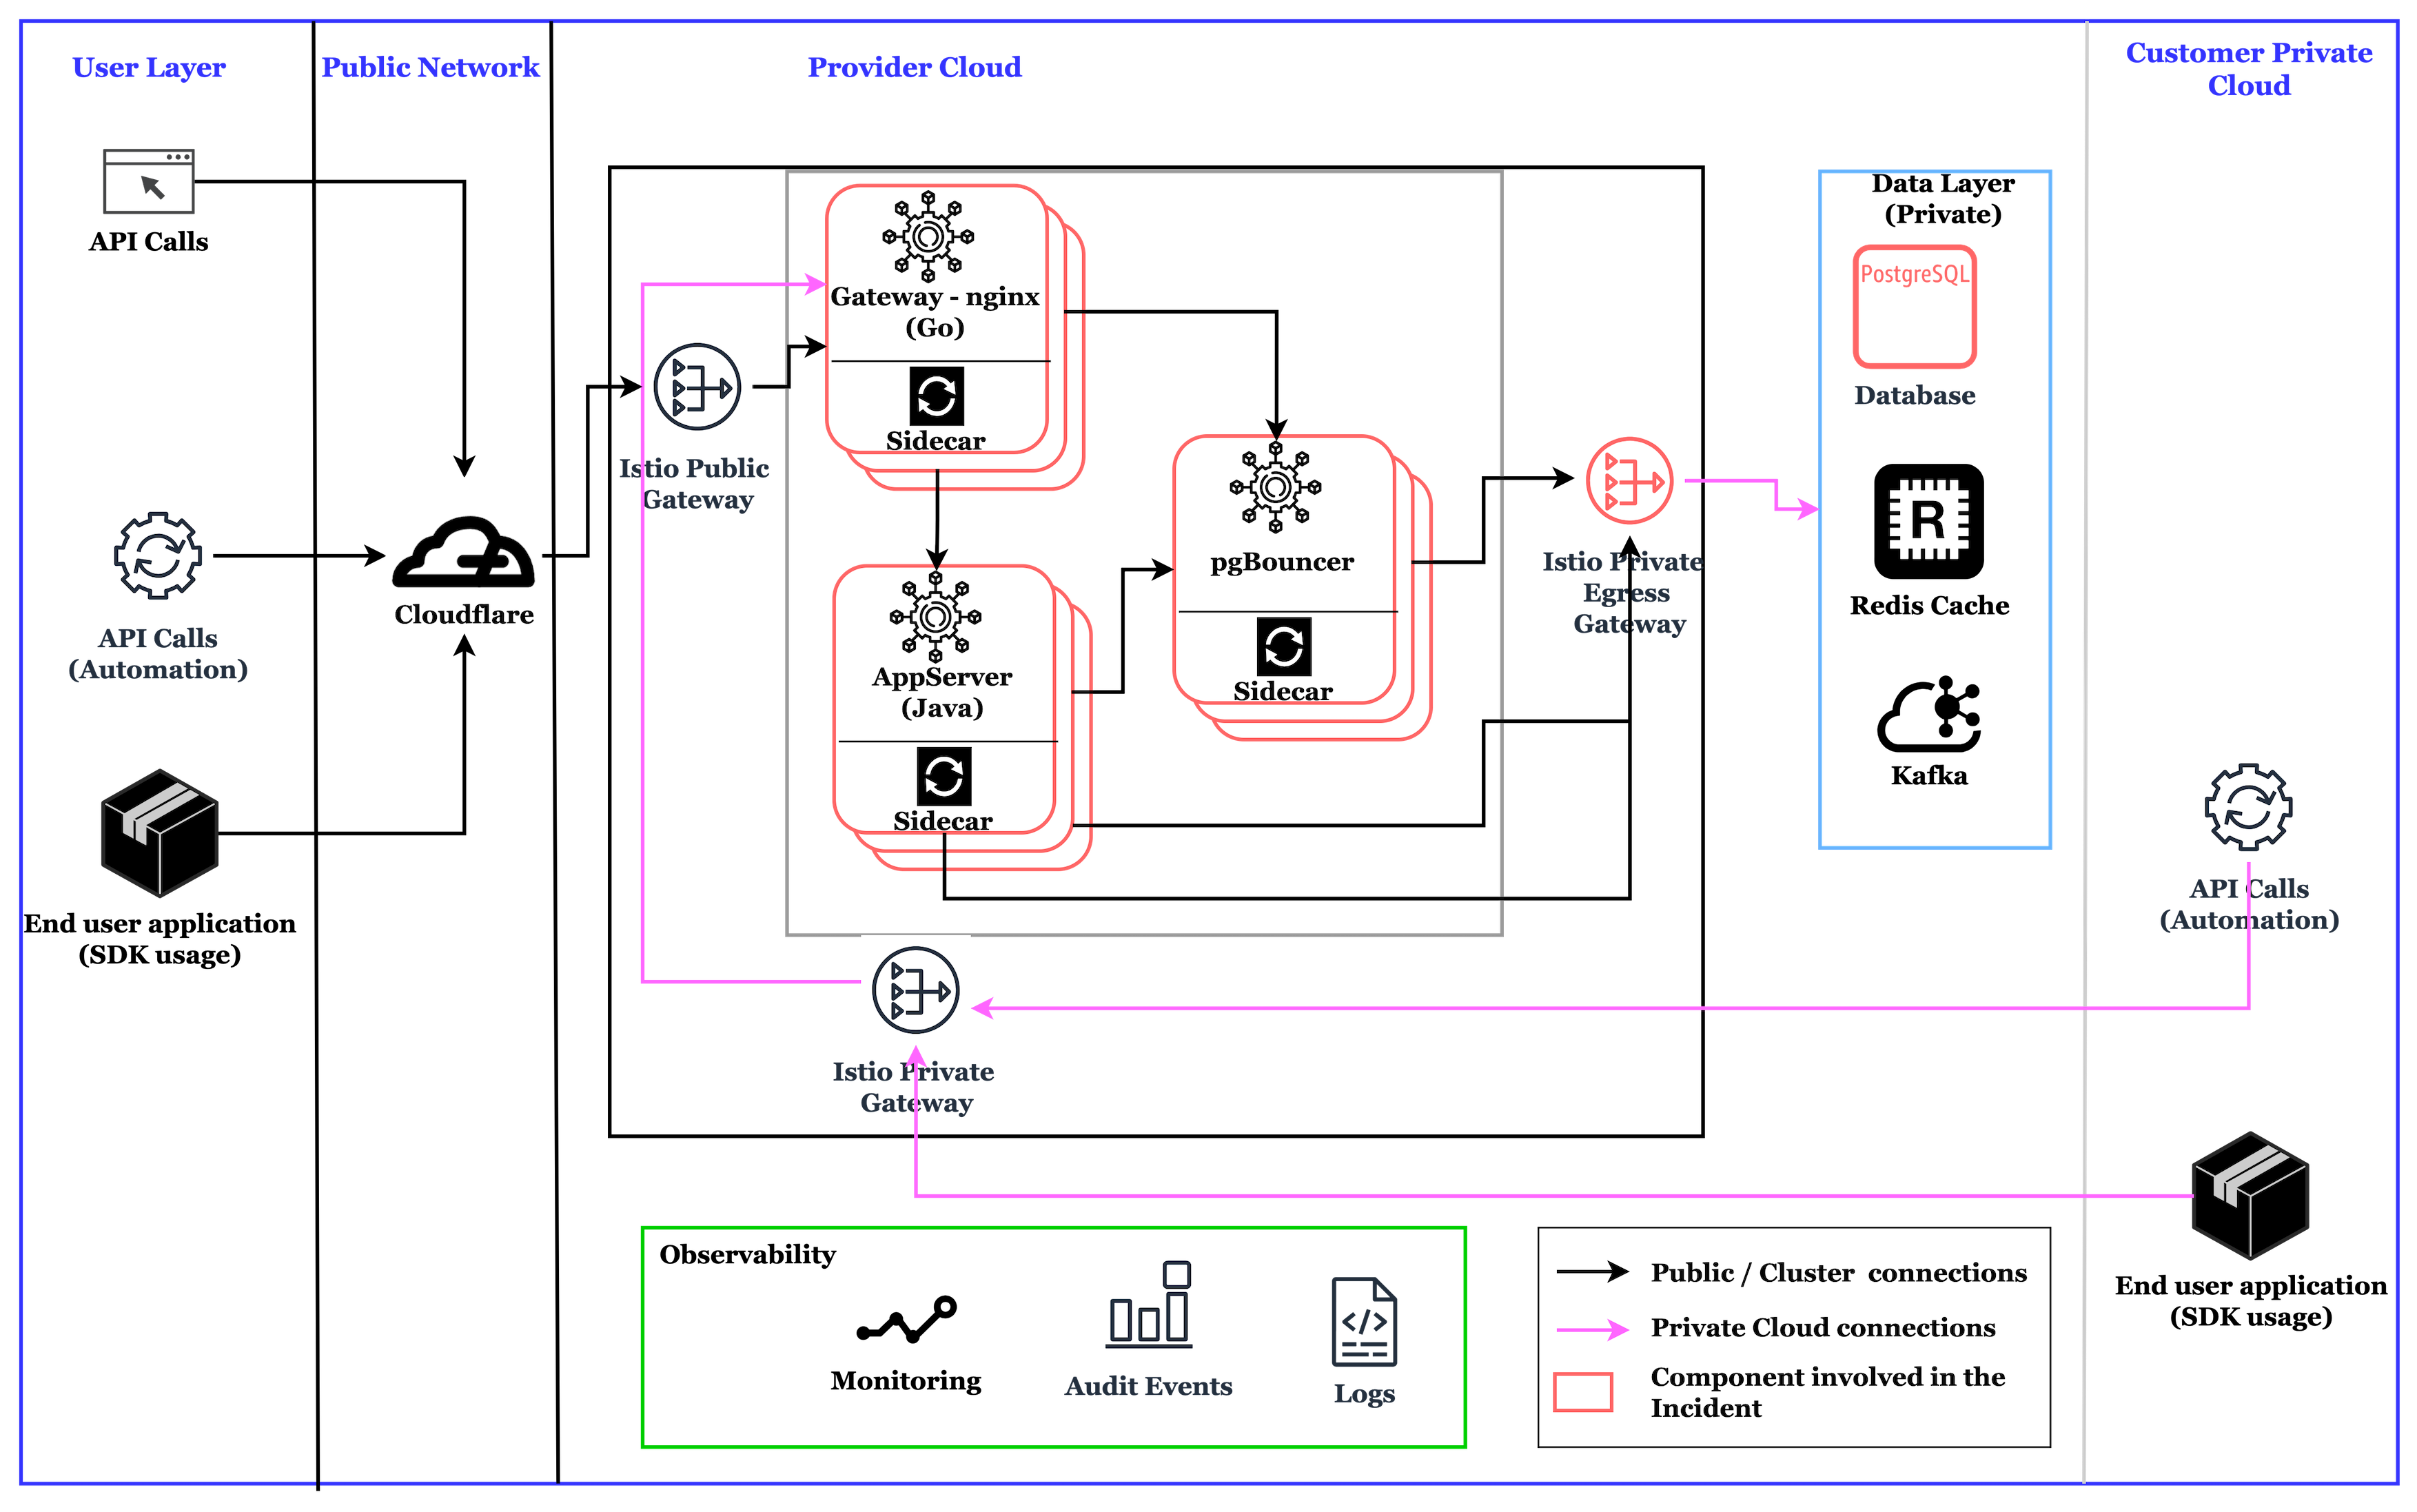
The following are the notable architectural elements and their implementation details:
Istio
A service mesh. This is a dedicated software layer that facilitates service-to-service communication using proxies.
- Security encrypts service-to-service communication using mTLS (Mutual TLS).
- Traffic management uses a virtual service for intelligent routing. Sidecar Proxy (Envoy) controls how traffic flows between services.
- Public Ingress Gateway exposes services inside the mesh to Cloudflare (a cloud internet service).
- Private Ingress Gateway controls access to services within a private network.
- Private Egress Gateway manages outgoing traffic from the mesh to other cloud services.
IBM Cloud Internet Services (CIS)
A set of services that help in addressing issues in exposing a microservice to the Internet.
- DNS resolved is used for resolving domain names.
- CDN (Content Delivery Network) caches website content globally to reduce latency.
- WAF (Web Application Firewall) protects against OWASP Top 10 vulnerabilities.
- DDoS mitigation prevents large-scale attacks from overwhelming services.
- A load balancer distributes traffic across multiple origins.
Kubernetes Cluster
A set of nodes that help in the orchestration of containerized applications using Kubernetes.
-
A cluster is used to run all the microservices.
-
The cluster is distributed across three zones to achieve high availability.
Data Layer
The layer in the architecture where all the persistent and ephemeral cache data resides.
-
PostgreSQL is used as the service storage to store data.
-
Redis cache is used as an in-memory data store.
User Layer (Public)
The interface layer that users interact using APIs.
-
API calls can be made by applications integrating the SDK provided by the service.
-
API calls can be made by automation scripts.
-
API calls can be made from browsers or API testing tools like Postman.
Customer Private Cloud
A network segment with direct "private" connectivity to the application without going to the Internet
-
API calls can be made by automation scripts via private networks.
-
API calls can be made by applications integrating the SDK provided by the service via a private network.
Details of the Incident
Following are the technical details of the incident:
- As the traffic spiked, the CPU and memory of our Java microservices spiked.
- Our Java microservices threads hung.
- Though we had rate limiting configured in CIS, we noticed the requests landing in our microservice more than what was configured.
- Though the number of requests grew, the number of connections to the database did not grow as expected.
- Requests timed out in JMeter when a load was initiated. (Load tested in our staging environment with the same configuration to reproduce the problem.)
- A particular tenant’s load grew exponentially as they were testing their application. And this tenant was connecting using a private endpoint.
- As the number of requests increased, the Go-based gateway nginx microservice was stable, but the Liberty-based Java app server hung.
Pre-Existing Resilience Measures
Here are the pre-existing resilience measures that were already implemented before the incident:
- Public traffic rate limiting. Public traffic enters from CIS. CIS rate-limiting configurations are enabled to manage the inflow of public endpoint requests.
- Microservices were running with a larger number of pods so that the high availability was built in.
- Gateway microservices were configured to run with three instances (pods).
- The app server was configured to run with three instances (pods).
- pgBouncer was configured to run with three instances (pods).
- PgBounceris a lightweight connection pooler for PostgreSQL that improves database performance, scalability, and resilience.
- Connection pooling is configured to limit the number of active database connections to prevent PostgreSQL from getting overwhelmed.
- Transaction and statement-level pooling. Configured with session pooling, where each client gets a dedicated database connection (default mode).
- Gateway nginx timeout. The timeout configured for
proxy_read_timeoutwas 30 seconds so that if the app server microservice does not return the response on time, the request gets a timeout in 30 seconds. - Istio ingress gateway timeout. The
timeoutconfigured for Istio was 60 seconds. If the gateway nginx does not return the response to Istio on time, the request gets timed out in 30 seconds. Timeouts were not in sync, and we noticed manyHTTP-504error codes as responses. - Resource requests and limits were configured for all our microservices correctly.
- Maximum number of allowed connections on PostgreSQL. For better management of connections and better resilience, the total number of connections allowed was set to 400 in PostgreSQL.
- Data that’s frequently retrieved is also stored in memory cache (Redis) to avoid latency to connect to PostgreSQL for data retrieval.
- SDK implements web sockets to get data on demand. SDK also caches the data from the server in the runtime memory of the customer application.
- SDK makes calls to the server only on any updates that are being made to the application data. On any data update, the server initiates a WebSocket event for the connected clients. These clients then make a GET call to the server to get up-to-date information.
Strategies Introduced to Improve Load Resilience
Here are the strategies we introduced to improve resilience during the incident:
Thread Pool Management
- Liberty thread pool management is enabled with
maxTotal(the maximum number of threads) set to control thread spawning. Without this limit, Liberty may continuously create new threads as demand rises, leading to high resource (CPU and memory) consumption. Excessive thread creation increases context-switching overhead, slowing down request processing and increasing the latency. If left uncontrolled, it could also exhaust JVM resources, potentially causing system instability. Along withmaxTotalother parameters related toInitialSize,MinIdle,MaxIdle, andMaxWaitMilliswere also set. - The maximum number of HTTP request threads available in Liberty is 200. So,
maxTotalis set to 200 to control the number of threads spawned by the server at runtime. - Setting the above configuration helped control the threads spawned, preventing thread hangs.
Connection Pool Management
- Pgbouncer thread pool management was configured with
pool_modeset tosessionandmax_client_connset to200. However, session mode did not perform as expected for our application, requiring an update totransactionmode, which is also the recommended configuration. - With three instances of pgBouncer and
max_client_connset to200, up to 600 connections could be established with the PostgreSQL database. However, since PostgreSQL is configured with a maximum of 400 connections for optimal performance, we needed to adjust themax_client_connto 100 per instance. - With the pgBouncer connection pool update, the connections established to the database were controlled with 300+ connections. Also, with the Liberty thread pool updates, the number of requests handled successfully, without thread hung, and without much latency increased.
Time Outs
- Nginx proxy_read_timeout was initially set to 30 seconds, matching the Istio timeout of 30 seconds. To maintain consistency, we increased both timeouts to 60 seconds. As a result, requests now time out at 60 seconds if no response is received from the upstream. This adjustment helped reduce 504 errors from Istio and allowed the server to handle more requests efficiently.
Rate Limiting
- Cloudflare rate limiting was in place for requests coming from the public end point to the service. However, rate limiting was missing on the Istio ingress private gateway. As traffic on the private end point increased, we immediately implemented rate limiting on the Istio private gateway, along with a Retry-After header. This effectively controlled the number of requests reaching the Nginx gateway microservice, ensuring better load management.
Latest Version Usage
- pgBouncer was running on an older version, so we upgraded to the latest version. While this did not have a direct impact on resilience, we used the opportunity to benefit from the new version.
Overall improvements achieved during the incident with the above configuration updates are:
- The latency of a GET request retrieving 122KB of data, which involves approximately 7-9 database calls, was improved from 9 seconds to 2 seconds even under a load of 400 concurrent requests to the API.
- The number of requests handled concurrently improved by 5x times.
- Errors reduced drastically. The customer started noticing only 429 (too many requests) if too many requests were hit within a specific period.
Results and Key Takeaways
- Teamwork drives fast recovery. The technical team collaborated effectively, analyzing each layer independently and ensuring a quick resolution to the incident. Cross-functional efforts played a crucial role in restoring stability.
- Logging is key. Comprehensive logging across various layers provided critical insights, allowing us to track:
- The total number of requests initiated
- The total number of failing requests
- Thread hangs and failures
- The number of requests hitting private endpoints
These logs helped us pinpoint the root cause swiftly.
- Monitoring enables real-time insights. With active monitoring, we could track live database connections, which helped us fine-tune the connection pool configurations accurately, preventing resource exhaustion.
- Master what you implement.
- Kubernetes expertise allowed us to access pods, tweak thread pools, and observe real-time behavior before rolling out a permanent fix.
- Istio rate limiting was applied immediately, helping balance the load effectively and preventing service degradation.
- Fail gracefully. Returning HTTP
504 Gateway Timeoutleft the API clients with not much option but to declare failure. Instead, we returned an HTTP429 Too Many Requests. This gave a more accurate picture, and the API clients can try after some time. - Feature flags for dynamic debugging. Running microservices behind feature flags enabled on-demand debugging without requiring server restarts. This played a vital role in identifying bottlenecks, particularly those caused by database connection limits, which in turn reduced MTTR.
Conclusion
Building resilient microservices is not just about choosing the right tools — it's about understanding and fine-tuning every layer of the system to handle unpredictable traffic spikes efficiently. Through this incident, we reinforced the importance of proactive monitoring, optimized configurations, and rapid collaboration in achieving high availability and performance.
By implementing rate limiting, thread pool management, optimized database connections, appropriate failure codes, and real-time observability, we transformed our fragile system into a self-healing, scalable, and fault-tolerant architecture. The key takeaway? Master what you implement — whether it's Kubernetes, Istio, or database tuning — deep expertise helps teams respond quickly and make the right decisions under pressure.
Resilience isn’t a one-time fix — it’s a mindset. Keeping a system healthy means constantly monitoring, learning from failures, and improving configurations. No more crashes — just a system that grows and adapts effortlessly, and in an unlikely situation, degrades gracefully!
Opinions expressed by DZone contributors are their own.
Comments