Log4j Thread Deadlock - A Case Study
By
 ·
·
Interview
·
·
Interview
Likes
(2)
Likes
There are no likes...yet! 👀
Be the first to like this post!
It looks like you're not logged in.
Sign in to see who liked this post!
Comment
Save
40.1K Views
Join the DZone community and get the full member experience.
Join For Free
This case
study describes the complete root cause analysis and resolution of an Apache
Log4j thread race problem affecting a Weblogic Portal 10.0 production
environment. It will also demonstrate the importance of proper Java classloader
knowledge when developing and supporting Java EE applications.
This article
is also another opportunity for you to improve your thread dump analysis skills
and understand thread race conditions.
Environment specifications
- Java EE server: Oracle Weblogic Portal 10.0
- OS: Solaris 10
- JDK: Oracle/Sun HotSpot JVM 1.5
- Logging API: Apache Log4j 1.2.15
- RDBMS: Oracle 10g
- Platform type: Web Portal
Troubleshooting tools
- Quest Foglight for Java (monitoring and alerting)
- Java VM Thread Dump (thread race analysis)
Problem overview
Major
performance degradation was observed from one of our Weblogic Portal production
environments. Alerts were also sent from the Foglight agents indicating a
significant surge in Weblogic threads utilization up to the upper default limit
of 400.
Gathering and validation of facts
As usual,
a Java EE problem investigation requires gathering of technical and non
technical facts so we can either derived other facts and/or conclude on the
root cause. Before applying a corrective measure, the facts below were verified
in order to conclude on the root cause:
- What is the client impact? HIGH
- Recent change of the affected platform? Yes, a recent deployment was performed involving minor content changes and some Java libraries changes & refactoring
- Any recent traffic increase to the affected platform? No
- Since how long this problem has been observed? New problem observed following the deployment
- Did a restart of the Weblogic server resolve the problem? No, any restart attempt did result in an immediate surge of threads
- Did a rollback of the deployment changes resolve the problem? Yes
Conclusion #1: The problem appears
to be related to the recent changes. However, the team was initially unable to
pinpoint the root cause. This is now what we will discuss for the rest of the
article.
Weblogic hogging thread report
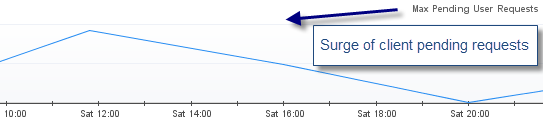
The
initial thread surge problem was reported by Foglight. As you can see below,
the threads utilization was significant (up to 400) leading to a high volume of
pending client requests and ultimately major performance degradation.

As usual, thread problems require proper thread dump analysis in order to pinpoint the source of threads contention. Lack of this critical analysis skill will prevent you to go any further in the root cause analysis.
For our
case study, a few thread dump snapshots were generated from our Weblogic
servers using the simple Solaris OS command kill -3 <Java PID>. Thread
Dump data was then extracted from the Weblogic standard output log files.
Thread Dump analysis
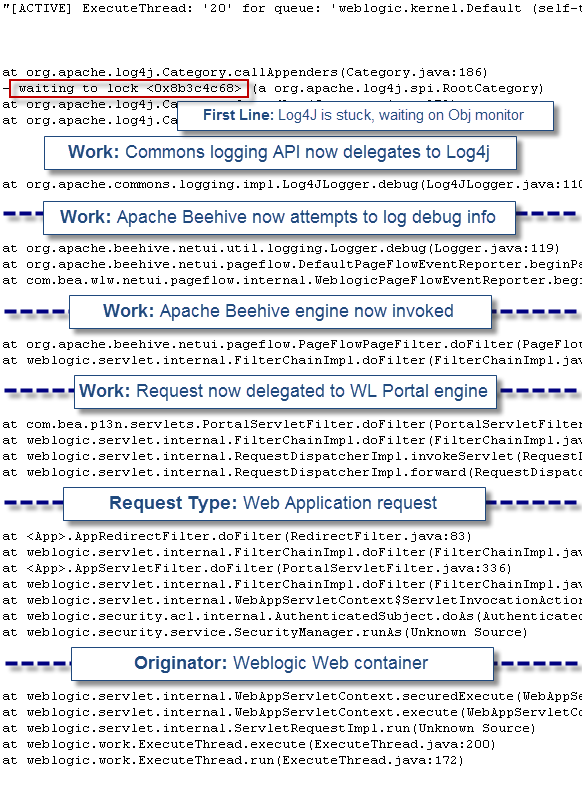
The first step of the analysis was to perform a fast scan of all stuck threads and pinpoint a problem “pattern”. We found 250 threads stuck in the following execution path:
 "[ACTIVE] ExecuteThread: '20' for queue: 'weblogic.kernel.Default (self-tuning)'" daemon prio=10 tid=0x03c4fc38 nid=0xe6 waiting for monitor entry [0x3f99e000..0x3f99f970]
       at org.apache.log4j.Category.callAppenders(Category.java:186)
       - waiting to lock <0x8b3c4c68> (a org.apache.log4j.spi.RootCategory)
       at org.apache.log4j.Category.forcedLog(Category.java:372)
       at org.apache.log4j.Category.log(Category.java:864)
       at org.apache.commons.logging.impl.Log4JLogger.debug(Log4JLogger.java:110)
       at org.apache.beehive.netui.util.logging.Logger.debug(Logger.java:119)
       at org.apache.beehive.netui.pageflow.DefaultPageFlowEventReporter.beginPageRequest(DefaultPageFlowEventReporter.java:164)
       at com.bea.wlw.netui.pageflow.internal.WeblogicPageFlowEventReporter.beginPageRequest(WeblogicPageFlowEventReporter.java:248)
       at org.apache.beehive.netui.pageflow.PageFlowPageFilter.doFilter(PageFlowPageFilter.java:154)
       at weblogic.servlet.internal.FilterChainImpl.doFilter(FilterChainImpl.java:42)
       at com.bea.p13n.servlets.PortalServletFilter.doFilter(PortalServletFilter.java:336)
       at weblogic.servlet.internal.FilterChainImpl.doFilter(FilterChainImpl.java:42)
       at weblogic.servlet.internal.RequestDispatcherImpl.invokeServlet(RequestDispatcherImpl.java:526)
       at weblogic.servlet.internal.RequestDispatcherImpl.forward(RequestDispatcherImpl.java:261)
       at <App>.AppRedirectFilter.doFilter(RedirectFilter.java:83)
       at weblogic.servlet.internal.FilterChainImpl.doFilter(FilterChainImpl.java:42)
       at <App>.AppServletFilter.doFilter(PortalServletFilter.java:336)
       at weblogic.servlet.internal.FilterChainImpl.doFilter(FilterChainImpl.java:42)
       at weblogic.servlet.internal.WebAppServletContext$ServletInvocationAction.run(WebAppServletContext.java:3393)
       at weblogic.security.acl.internal.AuthenticatedSubject.doAs(AuthenticatedSubject.java:321)
       at weblogic.security.service.SecurityManager.runAs(Unknown Source)
       at weblogic.servlet.internal.WebAppServletContext.securedExecute(WebAppServletContext.java:2140)
       at weblogic.servlet.internal.WebAppServletContext.execute(WebAppServletContext.java:2046)
       at weblogic.servlet.internal.ServletRequestImpl.run(Unknown Source)
       at weblogic.work.ExecuteThread.execute(ExecuteThread.java:200)
       at weblogic.work.ExecuteThread.run(ExecuteThread.java:172)
As you can
see, it appears that all the threads are waiting to acquire a lock on an Apache
Log4j object monitor (org.apache.log4j.spi.RootCategory) when attempting to log
debug information to the configured appender and log file. How did we figure
that out from this thread stack trace? Let’s dissect this thread stack trace in
order for you to better understand this thread race condition e.g. 250 threads
attempting to acquire the same object monitor concurrently.
At this
point the main question is why are we seeing this problem suddenly? An increase
of the logging level or load was also ruled out at this point after proper
verification. The fact that the rollback of the previous changes did fix the
problem did naturally lead us to perform a deeper review of the promoted
changes. Before we go to the final root cause section, we will perform a code
review of the affected Log4j code e.g. exposed to thread race conditions.
Apache Log4j 1.2.15 code review
## org.apache.log4j.Category
 /**
        * Call the appenders in the hierrachy starting at <code>this</code>. If no
        * appenders could be found, emit a warning.
        *
        * <p>
        * This method calls all the appenders inherited from the hierarchy
        * circumventing any evaluation of whether to log or not to log the
        * particular log request.
        *
        * @param event
        *            the event to log.
        */
       public void callAppenders(LoggingEvent event) {
             int writes = 0;

             for (Category c = this; c != null; c = c.parent) {
                    // Protected against simultaneous call to addAppender,
                    // removeAppender,...
                    synchronized (c) {
                           if (c.aai != null) {
                                 writes += c.aai.appendLoopOnAppenders(event);
                           }
                           if (!c.additive) {
                                 break;
                           }
                    }
             }

             if (writes == 0) {
                    repository.emitNoAppenderWarning(this);
             }
As you can
see, the Catelogry.callAppenders() is using a synchronized block at
the Category level which can lead to a severe thread race condition under heavy
concurrent load. In this scenario, the usage of a re-entrant read write lock
would have been more appropriate (e.g. such lock strategy allows concurrent “read”
but single “write”). You can find reference to this known Apache Log4j
limitation below along with some possible solutions.
Does the
above Log4j behaviour is the actual root cause of our problem? Not so fast…
Let’s
remember that this problem got exposed only following a recent deployment. The
real question is what application change triggered this problem & side
effect from the Apache Log4j logging API?
Root cause: a perfect storm!
Deep dive
analysis of the recent changes deployed did reveal that some Log4j libraries at
the child classloader level were removed along with the associated “child first”
policy. This refactoring exercise ended-up moving the delegation of both Commons
logging and Log4j at the parent
classloader level. What is the problem?
Before
this change, the logging events were split between Weblogic Beehive Log4j calls
at the parent classloader and web application logging events at the child class
loader. Since each classloader had its own copy of the Log4j objects, the
thread race condition problem was split in half and not exposed (masked) under
the current load conditions. Following the refactoring, all Log4j calls were
moved to the parent classloader (Java EE app); adding significant concurrency
level to the Log4j components such as Category. This increase concurrency level
along with this known Category.java thread race / deadlock behaviour was a perfect
storm for our production environment.
In other
to mitigate this problem, 2 immediate solutions were applied to the
environment:
- Rollback the refactoring and split Log4j calls back between parent and child classloader
- Reduce logging level for some appenders from DEBUG to WARNING
This
problem case again re-enforce the importance of performing proper testing and
impact assessment when applying changes such as library and class loader
related changes. Such changes can appear simple at the "surface" but can trigger
some deep execution pattern changes, exposing your application(s) to
known thread race conditions.
A future
upgrade to Apache Log4j 2 (or other logging API’s) will also be explored
as it is expected to bring some performance enhancements which may address some
of these thread race & scalability concerns.
Log4j
Published at DZone with permission of Pierre - Hugues Charbonneau. See the original article here.
Opinions expressed by DZone contributors are their own.
Comments