

Data Ingestion Using Logstash: PostgreSQL to Elasticsearch
Learn how to use Logstash to ingest, transform, and send data to Elasticsearch, including incremental pipelines, filters, and best practices.
 ·
·
Join the DZone community and get the full member experience.
Join For FreeWhat Is Logstash?
Logstash is an open-source data processing pipeline from Elastic. It is being used to ingest, transform, and ship data to different sources, including Elasticsearch, Kafka, flat files, etc.
Logstash pipeline includes three different processes:
- Input: It is the data source from which the data is collected for ingestion.
- Filter: It transforms (cleans up, aggregates, etc.) the data using plugins like Grok, Mutate, Date, etc.
- Output: Destination for ingestion (Elasticsearch, flat files, db, etc.).
Below are the prerequisites to send data using Logstash to Elastic:
- Logstash is installed on the system with a JDBC driver for Postgres.
- Postgres database with a table or function to sync.
- Elasticsearch instance is running.
Logstash Setup (for Windows)
Below are the steps in brief to install and run Logstash locally.
1. Install Java
Download the JDK package (Java 8 or later) from the Official Oracle Website. Once the download is complete, extract the files to the preferred location.
Once the files are extracted, the environment variable needs to be added for the system to recognize Java commands.
Go to environment variables, add a new variable with the name JAVA_HOME, and point it to the directory where the Java files are located. Append %JAVA_HOME%\bin to the path.
To verify the successful installation, go to the command prompt and run the following command.
java -versionIf everything is set up correctly, it will show the Java version.
2. Install Logstash
To install Logstash, download the package from the Official Elastic Website and extract it to the preferred location.
To test this locally, open a command prompt, navigate to the bin folder in the Logstash folder, and run the following command.
logstash -e "input { stdin {} } output { stdout {} }" Logstash Ingestion Pipeline
1. Install the Required JDBC Driver
Download the Postgres driver from the Official PostgreSQL website. Place the jar file in an accessible location.
2. Create a Logstash Pipeline
Here is the sample pipeline.
input {
    jdbc {
        jdbc_driver_library => "c:/logstash/jdbc/postgresql.jar"
        jdbc_driver_class => "org.postgresql.Driver"
        jdbc_connection_string => "${JDBC_HOST}"
        jdbc_user => "${DB_USER}"
        jdbc_password => "${DB_PWD}"
        jdbc_paging_enabled => true
        jdbc_page_size => 1000
        schedule => "* * * * *"  # schedule to run every minute
        statement => "SELECT * FROM employee WHERE updated_at > :sql_last_value"
        use_column_value => true
        tracking_column => "updated_at"
        tracking_column_type => "timestamp"
        last_run_metadata_path => "c:/logstash/employee.tracker"
    }
}

filter {
}
    mutate {
        remove_field => ["date", "@timestamp", "host"]
    }

    # Example of parsing JSON fields if needed
    json {
         source => "first_name"
         target => "name"
    }
}

output {
    stdout { codec => json_lines }
    elasticsearch {
        hosts => ["http://localhost:9200"]
        index => "my_table_index"
        custom_headers => {
                "Authorization" => "${AUTH_KEY}"
            }
        document_id => "%{table_id}" # Unique identifier from the table
        timeout => 120
    }
}
The above pipeline is used for incremental ingestion. It means that it tracks the last run and takes the records from the last run to ingest the data on the schedule.
Here are the key concepts used:
Input:
jdbc_driver_library– location where the JDBC driver file(.jar) is storedjdbc_driver_class– the driver class being usedjdbc_connection_string– postgres db connection stringjdbc_user– Database usernamejdbc_password– database password for the userpaging– data will be sent in multiple pages with a page size of 1000. It will improve the performance of the pipeline and will help to track the number of records sent to Elasticsearch.schedule– the above pipeline is scheduled to run every minute. Here is the format for the schedule: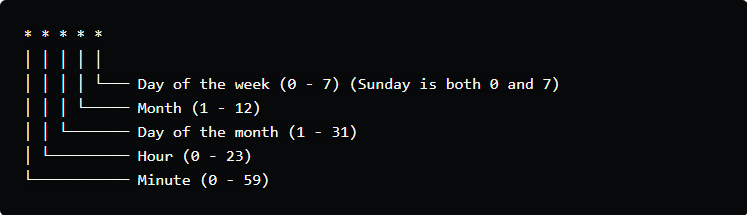
statement– a SQL statement that the pipeline will execute. To execute complex statements, it can be saved in a separate .sql file and mention the file path tostatement_filepathinstead of statement. It is better to use a view or a materialized view instead of a query with complex joins.- The last section is for incremental ingestion.
use_column_value => true
tracking_column => "updated_dt"
tracking_column_type => "timestamp"
last_run_metadata_path => "c:/project/logstash/date.tracker"
use_column_value is set to true. It lets Logstash know to track the actual value of the column updated_at used in tracking_column instead of using the time when the query was run last time. In this case, :sql_last_value will use updated_dt value.
If it is set to false, Logstash will use the last query execution time for :sql_last_value.
The last run time will be saved in the file mentioned in last_run_metadata_path. It will be used to track the last time the pipeline was run.
Filter
This is an optional section to manipulate the data before sending it to the destination.
In the above pipeline, the date field is being removed from ingestion. Also, it is sending the first_name from the data to the name field in the destination.
Output
This section defines the destination for the data. In this case, it is the Elasticsearch endpoint, the authorization key, if any, elastic index, document_id. document_id is a unique identifier of the elastic document in the index. If this field is not mentioned, Elasticsearch will automatically assign a unique identifier to the document.
In case of incremental ingestion, it is recommended to define this field. During ingestion, Elasticsearch would look for this field in the index; if it matched, it would update the same document.
If the field is not defined, it creates a new document in the index, resulting in duplicate records.
Run the Pipeline
To run this pipeline, open the command prompt, go to the Logstash folder, and run the following command.
bin/logstash -f c:/logstash/sample_pipeline.confHere is the output of the pipeline.
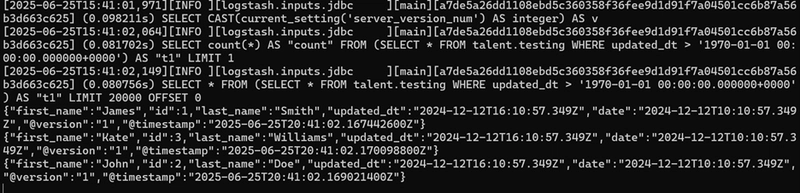
Output from the Elasticsearch index.
{
    "took": 1,
    "timed_out": false,
    "_shards": {
        "total": 1,
        "successful": 1,
        "skipped": 0,
        "failed": 0
    },
    "hits": {
        "total": {
            "value": 3,
            "relation": "eq"
        },
        "max_score": 1.0,
        "hits": [
            {
                "_index": "testing",
                "_id": "1",
                "_score": 1.0,
                "_source": {
                    "name": "James",
                    "id": 1,
                    "last_name": "Smith",
                    "updated_dt": "2024-12-12T16:10:57.349Z",
                    "@version": "1",
                    "@timestamp": "2025-06-25T20:41:02.167442600Z"
                }
            },
            {
                "_index": "testing",
                "_id": "2",
                "_score": 1.0,
                "_source": {
                    "name": "John",
                    "id": 2,
                    "last_name": "Doe",
                    "updated_dt": "2024-12-12T16:10:57.349Z",
                    "@version": "1",
                    "@timestamp": "2025-06-25T20:41:02.169021400Z"
                }
            },
            {
                "_index": "testing",
                "_id": "3",
                "_score": 1.0,
                "_source": {
                    "name": "Kate",
                    "id": 3,
                    "last_name": "Williams",
                    "updated_dt": "2024-12-12T16:10:57.349Z",
                    "@version": "1",
                    "@timestamp": "2025-06-25T20:41:02.170098800Z"
                }
            }
        ]
    }
}
There are a few advantages of this method.
- Logstash is an open-source tool and easy to implement.
- There are over 200+ plugins available for data transformation. Using these plugins, data can be parsed and transformed using filters.
- It is a decoupled architecture between the data source and Elasticsearch.
- It has seamless integration with Elasticsearch.
Although this is an open-source, simple method to implement, it has some disadvantages.
- Latency issues: It is not ideal for applications where very low latency or real-time data is required. As the pipeline grows, it takes time to load, transform/filter, and send the data.
- Error handling: Unless it is explicitly monitored, it is difficult to track down the errors, which can result in data loss.
- It can create duplicates if the pipeline is not defined properly.
- It takes a longer time to start compared to other tools.
- It uses YAML-style config files, which make it complex and can be difficult to maintain.
- Resource utilization: It can utilize more resources with heavy loads and complex pipelines.
The above pipeline can be used if someone is looking for a more robust and centralized data streaming pipeline. It is not ideal for real-time data shipping.
Published at DZone with permission of Mangesh Walimbe. See the original article here.
Opinions expressed by DZone contributors are their own.
Comments