Looking for Exceptions and Errors in Thread Dumps
This tutorial introduces a thread dump troubleshooting pattern that will help you find exceptions and errors in thread dumps.
Join the DZone community and get the full member experience.
Join For FreeThread dumps are vital artifacts to troubleshoot/debug production problems. In the past we have discussed several effective thread dump troubleshooting patterns like: traffic jam, treadmill, RSI, and all roads lead to rome. In this article we would like to introduce one more thread dump troubleshooting pattern.
There are 8 different options to capture thread dumps. You can use the option that is convenient to you.
Thread dumps tend to contain Exceptions or Errors in the threads stack trace. The threads that contain Exceptions or Errors in their stack trace should be investigated. Because they indicate the origin of the problem.
Recently an application was throwing java.lang.OutOfMemoryError. Thread dump was captured from this application. When we analyzed the thread dump, we could notice a particular thread to be throwing java.lang.OutOfMemoryError:
Thread 0x3ff781e764e0
at java.lang.OutOfMemoryError.<init>()V (OutOfMemoryError.java:48)
at java.lang.ClassLoader.defineClass1(Ljava/lang/String;[BIILjava/security/ProtectionDomain;Ljava/lang/String;)Ljava/lang/Class; (Native Method)
at java.lang.ClassLoader.defineClass(Ljava/lang/String;[BIILjava/security/ProtectionDomain;)Ljava/lang/Class; (ClassLoader.java:757)
at java.lang.ClassLoader.defineClass(Ljava/lang/String;[BII)Ljava/lang/Class; (ClassLoader.java:636)
at sun.reflect.GeneratedMethodAccessor37.invoke(Ljava/lang/Object;[Ljava/lang/Object;)Ljava/lang/Object; (Unknown Source)
at sun.reflect.DelegatingMethodAccessorImpl.invoke(Ljava/lang/Object;[Ljava/lang/Object;)Ljava/lang/Object; (DelegatingMethodAccessorImpl.java:43)
at java.lang.reflect.Method.invoke(Ljava/lang/Object;[Ljava/lang/Object;)Ljava/lang/Object; (Method.java:498)
at com.sun.xml.bind.v2.runtime.reflect.opt.Injector.inject(Ljava/lang/String;[B)Ljava/lang/Class; (Injector.java:125)
at com.sun.xml.bind.v2.runtime.reflect.opt.Injector.inject(Ljava/lang/ClassLoader;Ljava/lang/String;[B)Ljava/lang/Class; (Injector.java:48)
at
com.sun.xml.bind.v2.runtime.reflect.opt.AccessorInjector.prepare(Ljava/lang/Class;Ljava/lang/String;Ljava/lang/String;[Ljava/lang/String;)Ljava/lang/Class; (AccessorInjector.java:51)
at
com.sun.xml.bind.v2.runtime.reflect.opt.OptimizedAccessorFactory.get(Ljava/lang/reflect/Field;)Lcom/sun/xml/bind/v2/runtime/reflect/Accessor; (OptimizedAccessorFactory.java:128)
at
com.sun.xml.bind.v2.runtime.reflect.Accessor$FieldReflection.optimize(Lcom/sun/xml/bind/v2/runtime/JAXBContextImpl;)Lcom/sun/xml/bind/v2/runtime/reflect/Accessor; (Accessor.java:213)
at com.sun.xml.bind.v2.runtime.reflect.TransducedAccessor$CompositeTransducedAccessorImpl.<init>(Lcom/sun/xml/bind/v2/runtime/JAXBContextImpl;Lcom/sun/xml/bind/v2/runtime/Transducer;Lcom/sun/xml/bind/v2/runtime/reflect/Accessor;)V (TransducedAccessor.java:195)
:
:
at com.sun.xml.ws.client.WSServiceDelegate.getPort(Ljavax/xml/namespace/QName;Ljava/lang/Class;[Ljavax/xml/ws/WebServiceFeature;)Ljava/lang/Object; (WSServiceDelegate.java:274)
at
com.sun.xml.ws.client.WSServiceDelegate.getPort(Ljavax/xml/namespace/QName;Ljava/lang/Class;)Ljava/lang/Object; (WSServiceDelegate.java:267)
From this stack trace we were able to figure out that this thread is experiencing OutOfMemoryError when it’s trying to transform XML into Java objects.
Apparently sufficient memory wasn’t allocated to this application to process large size XML payloads. Thus when large size XMLs were sent to this application, it started throwing OutOfMemoryError. When sufficient memory was allocated (i.e. increasing -Xmx value), the problem got resolved. Thus looking for Exception or Errors in the thread dumps is a good pattern to identify the root cause of the problem.
But looking for exceptions or errors in a thread dump is not a trivial thing. Because thread dumps tend to contain hundreds or thousands of threads. Each thread will have several lines of stack trace. Going through each line of stack trace to spot exceptions or errors is a tedious process. This where thread dumps analysis tools comes handy. You might consider using free thread dump analysis tools like: fastThread, IBM TDMA, Samurai, and others to analyze your application thread dumps.
When you upload thread dump to the fastThread application, it generates a root cause analysis report. One of the sections in this report is ‘Exception’. In this section fastThread application reports all the threads that are throwing Exceptions or Errors. Below is the screenshot of this section:
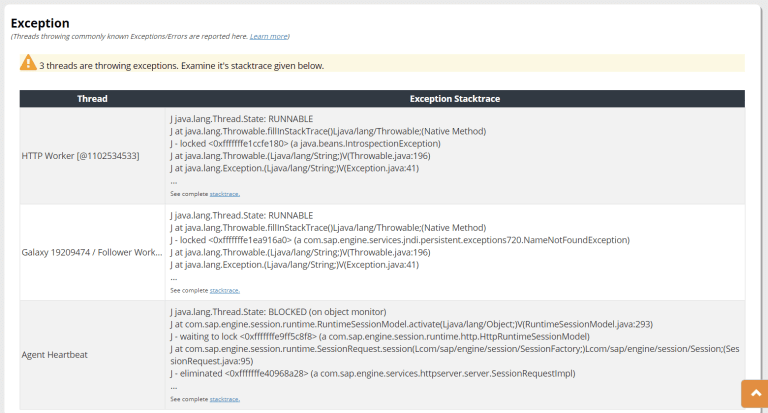
You can notice this section is reporting all the threads that have Exceptions or Errors in their stack trace. If any threads are reported in this section, you should consider investigating those thread stack traces to identify the origin of the problem.
Opinions expressed by DZone contributors are their own.
Comments