Machine Learning With Decision Trees
This paper shows you how to get started with machine learning by applying decision trees using Python on an established dataset.
Join the DZone community and get the full member experience.
Join For FreeIntroduction
This paper shows you how to get started with machine learning by applying decision trees using Python on an established dataset. The code used in this article is available on Github. A popular library for creating decision trees is the standard scikit — learn and with this library you can get your first machine learning model running with just a few lines of computer code. In subsequent articles you will apply the SparkML library for machine learning.
Decision trees have influenced the development of machine learning algorithms, including Classification and Regression Tree (CART) models. The divide and conquer approach has attracted many to use them successfully.
A tree-like model of decisions is drawn that can be visually presented and saved to file, both in image form or in pseudo-code form.
A decision tree is drawn like an upside-down tree. We start from the root node, then split the nodes at each level until we reach leaf nodes which represent outcomes or decisions. At each of the internal nodes a decision is taken which then leads to further nodes.
Model From Iris Data
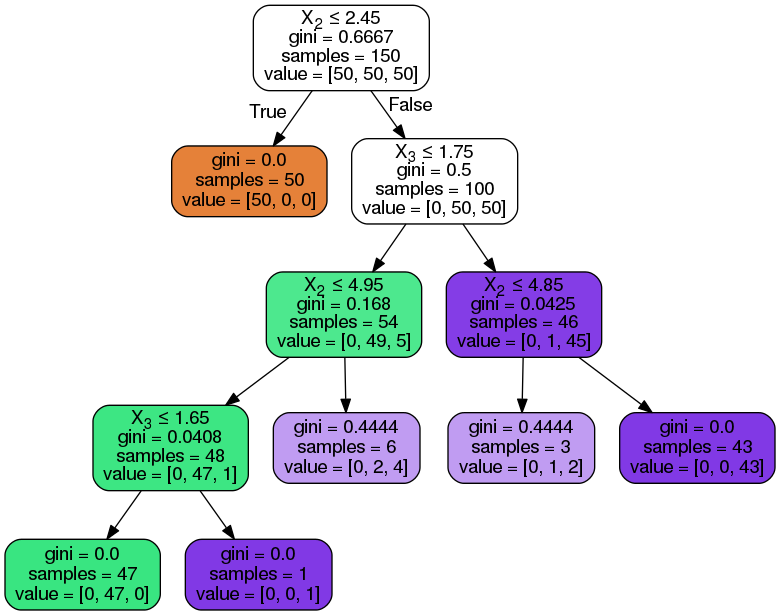
Figure 1 shows a decision tree for the famous Iris dataset. This dataset is available for download from the UCI website which has a list of hundreds of datasets for machine learning applications.
The example above illustrates the conceptual ease of the decision tree approach. Yet it can scale and be applied to much larger problems with ease. The algorithm is straightforward, the features and decisions are clearly stated at every internal node and relationships between the nodes are clearly defined.
It is sometimes described as a learning decision tree or as a classification tree because the objective is to classify the data. The above example has labelled or categorical data. For continuous variables, regression trees are applied. In recent years, decision tree techniques have been called Classification and Regression Trees (CART) as the theory has expanded, owing to greater availability of computing power.
Growing a tree involves deciding which features to model, which split decisions to apply, using a cost function to assess the result of the splits, and knowing when to decide to stop.
Recursive Binary Splitting
In this procedure, all the features are considered, various split points are tested using cost functions. The split with the lowest cost is chosen. This is sometimes termed a "greedy algorithm" as the focus is on the immediate result, thereby ignoring more optimal sub-trees that might result from a deeper look at the cost.
Consider the Iris data shown in figure-1, in the root node for the first split all the features are evaluated and the training data is divided into groups based on this split. We have three features, so we have three candidate splits. Next we calculate how much accuracy each candidate split provides. The algorithm is often described as a greedy algorithm due to its excessive desire to reduce costs.
Cost of a Split
Cost functions compute the cost of a split for classification and regression trees.
In each node the features will be split to arrive at a more homogeneous node or branches having groups possessing similar responses.
Equation 1
Regression = sum(y – prediction)²
If we have continuous data the decision tree starts splitting by considering each feature in the training data. The mean of the values of the training data input for a particular class or group is used as the prediction for that group. The above function is applied to all data points, and costs are calculated for all splits. The split having the lowest immediate cost is selected.
An alternative method for cost function computation requires reduction of the standard deviation.
Equation 2: Classification Gini Index
G = sum( pk*(1-pk))
The Iris example chosen uses the above Gini cost function. Sklearn does also provide the alternative information ratio method.
A Gini score gives an indication of the quality of a split, by considering the purity of the response classes in the sub-nodes created by the split. Here Pk represents the proportion of same class inputs present within a group.
A perfect class purity occurs when a group contains all inputs from the same class in which case we have pk=1 or pk = 0).
A node that has a 50-50 split has the worst purity.
When Should We Stop Splitting?
When do we stop growing a tree? Applications with large numbers of features lead to larger trees, and this leads to overfitting.
One way: set a minimum number of training inputs to use on each leaf. For the IRIS dataset we set minimum number of sample in a leaf node to be 25. Consequently, any node that has 25 samples will not be further subdivided.
Another way to reduce overfitting: set a maximum depth to a model. Where depth is the length of longest path from root node to leaf node.
Pruning
The pruning technique involves removing branches of the tree that make use of features that possess low importance. This reduce overfitting.
Code for the Decision Tree
Code used to create decision tree is in Python and uses the pandas library for dataframes and the scikit-sklearn library for machine learning. This sklearn library has decision tree methods for creating decision trees. The main method used for training is the DecisionTreeClassifier(). There are several parameters available to fine tune for each model. We will use the Gini method and restrict the size of the resulting tree by setting the minimum number of records at each leaf node to 25.
The Python code first loads the appropriate libraries, then loads the IRIS dataset which you should download from the ICI website given. You will need to choose the filename to the one you used to save the file on your computer.
Next we pre-process the data. The labels in the pandas dataframe are given in text form, and we need to provide integer inputs for these classes. We add a new column in the dataframe, and set the attribute values in this column to a placeholder value. Here, the value 999 represents no data. Then we use the function to set the values in column five based on the category strings in column 4.
0 "Iris-setosa"
1 "Iris-versicolor"
2 "Iris-virginica"
In the following step we train the decision tree.
After calling the decision tree classifier we use the pydotplus library to write the tree to an image file.
import pandas as pd
from sklearn.externals.six import StringIO
from IPython.display import Image
import pydotplus
from sklearn.tree import DecisionTreeClassifier, export_graphviz

df = pd.read_csv("/home/euclid/projects/python/demo2018/test_decision_tree/iris.csv", header=None)
print(df.head(5))
print(df.__class__.__name__)
print(df.shape)
n1,n2 = df.shape
print("number of rows=", n1)

def l_formula(x):
  val = 99
  if x == "Iris-setosa":
     val=0
  if x== "Iris-versicolor":
     val=1
  if x == "Iris-virginica":
     val=2
  return val

df[5] = 999  # represents NA no data
df[5] = df.apply(lambda row: l_formula(row[4]), axis=1)

features = list(df.columns[:4])
print "* features:", features

y = df[5]
X = df[features]
dt = DecisionTreeClassifier(min_samples_split=25, random_state=100)
dt.fit(X, y)

dot_data = StringIO()
export_graphviz(dt, out_file=dot_data,
filled=True, rounded=True,
special_characters=True)
graph = pydotplus.graph_from_dot_data(dot_data.getvalue())
Image(graph.create_png())
graph.write_png("/home/euclid/projects/python/demo2018/test_decision_tree/b-tree.png")
Advantages of CART
The models are easy to visualize and lend themselves to interpretation even by non programmers such as data-scientists.
Can be applied to both linear and non-linear relationships.
Decision trees apply a natural selection method for feature evaluation
Can be applied on both categoric and continuous data.
Disadvantages of CART
Biased trees may result if classes are unbalanced.
Greedy algorithms can result in decision trees that are not the best possible. We must use pruning techniques to avoid this.
Variance problem: Small variations of data occasionally lead to substantially different trees. Use bagging and boosting to reduce variance problems.
Overfitting can occur.
Summary
In this article I demonstrated a decision tree using Python and the scikit-sklearn library. Output was written to an image file using the pydotplus library. A copy of the decision tree in pseudo-code form was also created.
Opinions expressed by DZone contributors are their own.
Comments