Managed Server Shutdown, but Running?
A tale of a thread dump.
Join the DZone community and get the full member experience.
Join For FreeYet another post of the series of thread dump analysis that I’ve done during root cause analysis of various issues at work.
Issue
A red alert was issued by production monitoring system saying that several managed servers are in SHUTDOWN state and the Admin Server console as well echoed the same. However ps output showed that the same Managed Server processes above are still running.
Analysis
Firstly, I looked at the Managed Server logs to see if anything is alarming and found the following sequence of logs.
xxxxxxxxxx
<Info> <Common> <[ACTIVE] ExecuteThread: '6'> <BEA-000634> <Resource hang detected for pool "xxxx", group "DEFAULT_GROUP_ID". Waited 10,011 milliseconds where a typical test has been taking 2.>
...
<Error> <WebLogicServer> <[ACTIVE] ExecuteThread: '25'> <[STUCK] ExecuteThread: '22' for queue: 'weblogic.kernel.Default (self-tuning)' has been busy for "606" seconds...>
...
<Error> <JTA> <[ACTIVE] ExecuteThread: '12'> <BEA-110423> <Abandoning transaction after 1,810 seconds: Name=yyyy,Xid=BEA1-18724489CBE3E0E0AF86(1435460103),Status=Marked rollback. [Reason=weblogic.transaction.internal.TimedOutException: Transaction timed out after 1799 seconds]>
<Error> <JTA> <[ACTIVE] ExecuteThread: '10'> <BEA-110423> <Abandoning transaction after 1,815 seconds: Name=yyyy,Xid=BEA1-18724489CBE3E0E0AF86(1435460103),Status=Unknown>
<Error> <JTA> <[ACTIVE] ExecuteThread: '23'> <BEA-110423> <Abandoning transaction after 1,820 seconds: Name=yyyy,Xid=BEA1-18724489CBE3E0E0AF86(1435460103),Status=Unknown>
<Error> <JTA> <[ACTIVE] ExecuteThread: '25'> <BEA-110423> <Abandoning transaction after 1,825 seconds: Name=yyyy,Xid=BEA1-18724489CBE3E0E0AF86(1435460103),Status=Unknown>
...
<Error> <JTA> <[ACTIVE] ExecuteThread: '400'> <BEA-110423> <Abandoning transaction after 3,921 seconds: Name=yyyy,Xid=BEA1-18724489CBE3E0E0AF86(1435460103),Status=Unknown>
...
<Info> <Info> <BEA-003107> <Lost 1 unicast message(s).>
<Info> <Info> <BEA-003107> <Lost 1 unicast message(s).>
<Info> <Info> <BEA-003107> <Lost 1 unicast message(s).>
<Info> <Info> <BEA-003107> <Lost 1 unicast message(s).>
<Info> <Info> <BEA-003107> <Lost 1 unicast message(s).>
Let’s try to understand this log.
- Initially, there has been a resource (i.e. the database) hang for the pool
xxxx, more about this later. - ExecuteThread: ‘22’ has taken above 600 seconds, hence WebLogic has marked that thread as
STUCK. - After some times WebLogic has made multiple attempts to abandon a single transaction with the local transaction-id
BEA1-18724489CBE3E0E0AF86(1435460103, one after the other in every 5 seconds i.e.Abandoning transaction after 1,815 seconds. - Since the
Abandon Transaction Timeoutis configured to1800seconds, the very first abandoning task has been initiated after~1800seconds, which has marked the transaction to rollback (i.e.Status=Marked rollback). - Apparently, the first attempt above was unsuccessful, hence WebLogic must have launched another thread for abandoning the same transaction, however unlike the previous attempt, it couldn’t at least mark the transaction for rollback, hence status was
Status=Unknown. - The fate of every other attempt, launched after in every 5 seconds, must have been the same as what is logged by ExecuteThread: ‘15’, since the transaction status used to be
Status=Unknownfor all of them. - Then the Managed Server used to lose unicast messages (i.e.
Lost 1 unicast message(s).) - which indicates that it has lost cluster heartbeats. It’s anInfolevel log and as per Oracle you can ignore this message. However, I do see an abnormal number of such messages.
The thread names above i.e. ExecuteThread: '25' etc are of the threads which logged the messages and may not be the threads which were actually executing the abandoning task. I could see the message Abandoning transaction after N seconds... is logged 398 times by different threads, but it’s too early to conclude whether WebLogic has launched 398 different threads to abandon the transaction or not.
On a side note, abandoning of transactions happens when a transaction has never been committed during the 2nd phase of a two-phase commit transaction. It could be either due to:
- The application fails to commit/ rollback.
- The transactional resource i.e. the database has crashed/ not responding.
In our case we had @Transactional annotations around the yyyy transaction, hence the suspect was the database - which is confirmed by the log Resource hang detected for pool "xxxx".
At this point I had the following unresolved questions in mind;
- What was wrong at the database end?
- Why did WebLogic has logged the abandoning transaction message for 398 times?
- How many threads have been launched by WebLogic to abandon the transaction?
- Were the abandoning threads released to the pool back, so that they could serve other requests?
- Why is the Managed Server losing a high volume of unicast messages?
- Why is the Admin Server showing the Managed Server status as
SHUTDOWN? - the original issue.
The next sensible step for me was to capture the thread dumps, from both the Admin and Managed Servers. I did not observe any abnormalities in the Admin Server thread dump, however, could see threads with following exact stack trace, equivalent to the number of Managed Servers that the Admin Server is showing as ‘RUNNING’.
xxxxxxxxxx
"Thread-31" #63 daemon prio=5 os_prio=0 tid=0x00007f076402b800 nid=0x3496 runnable [0x00007f0771dec000]
java.lang.Thread.State: RUNNABLE
at java.net.SocketInputStream.socketRead0(Native Method)
at java.net.SocketInputStream.socketRead(SocketInputStream.java:116)
at java.net.SocketInputStream.read(SocketInputStream.java:171)
at java.net.SocketInputStream.read(SocketInputStream.java:141)
at java.io.BufferedInputStream.fill(BufferedInputStream.java:246)
at java.io.BufferedInputStream.read1(BufferedInputStream.java:286)
at java.io.BufferedInputStream.read(BufferedInputStream.java:345)
- locked <0x0000000081f712d8> (a java.io.BufferedInputStream)
at com.sun.jndi.ldap.Connection.run(Connection.java:860)
at java.lang.Thread.run(Thread.java:748)
These threads are spawn per Managed Server, and the number of such threads confirmed that the Admin Server is no longer interested in the ‘crashed’ Managed Server.
The thread dump of the Managed Server, however, was alarming.
- Number of
BLOCKEDthreads = 398 - Number of
STUCKthreads = 2 - Number of
BLOCKED+STUCKthreads = 400
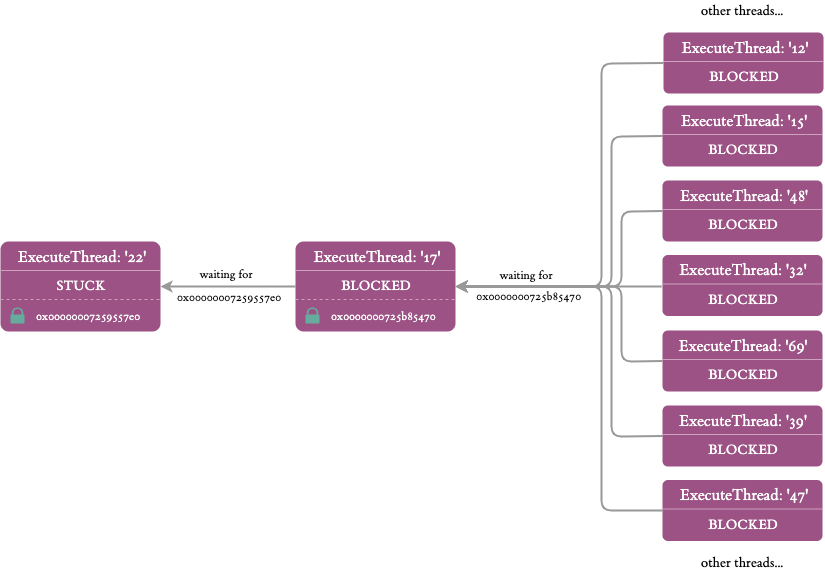
I have visualized the thread dump below to better explain the situation.
Again on a side note, BLOCKED is a standard java thread state and STUCK is a WebLogic categorization, hence a STUCK thread could ideally be in RUNNABLE state.
The below STUCK threads in the thread dump is serving an application request and acquired a lock on the JDBC connection. It has been reading via the JDBC connection (a JDBC connection is nothing but a TCP socket to the database) for more than 600 seconds, hence WebLogic has marked it as STUCK.`
xxxxxxxxxx
"[STUCK] ExecuteThread: '22' for queue: 'weblogic.kernel.Default (self-tuning)'" #4736 daemon prio=1 os_prio=0 tid=0x00007fcd4800b800 nid=0x3d4f runnable [0x00007fcc026d7000]
java.lang.Thread.State: RUNNABLE
at java.net.SocketInputStream.socketRead0(Native Method)
at java.net.SocketInputStream.socketRead(SocketInputStream.java:116)
at java.net.SocketInputStream.read(SocketInputStream.java:171)
...
at oracle.jdbc.driver.OracleStatement.executeMaybeDescribe(OracleStatement.java:925)
at oracle.jdbc.driver.OracleStatement.doExecuteWithTimeout(OracleStatement.java:1111)
at oracle.jdbc.driver.OraclePreparedStatement.executeInternal(OraclePreparedStatement.java:4798)
at oracle.jdbc.driver.OraclePreparedStatement.executeQuery(OraclePreparedStatement.java:4845)
- locked <0x00000007259557e0> (a oracle.jdbc.driver.T4CConnection)
at oracle.jdbc.driver.OraclePreparedStatementWrapper.executeQuery(OraclePreparedStatementWrapper.java:1501)
at weblogic.jdbc.wrapper.PreparedStatement.executeQuery(PreparedStatement.java:144)
at org.hibernate.engine.jdbc.internal.ResultSetReturnImpl.extract(ResultSetReturnImpl.java:60)
at org.hibernate.loader.Loader.getResultSet(Loader.java:2168)
at org.hibernate.loader.Loader.executeQueryStatement(Loader.java:1931)
at org.hibernate.loader.Loader.executeQueryStatement(Loader.java:1893)
at org.hibernate.loader.Loader.doQuery(Loader.java:938)
at org.hibernate.loader.Loader.doQueryAndInitializeNonLazyCollections(Loader.java:341)
...
org.springframework.data.jpa.repository.query.JpaQueryExecution$SingleEntityExecution.doExecute(JpaQueryExecution.java:214)
at org.springframework.data.jpa.repository.query.JpaQueryExecution.execute(JpaQueryExecution.java:91)
...
at com.x.y.z.MyService.find(MyService.java:80)
...
at org.springframework.transaction.interceptor.TransactionInterceptor$$Lambda$2159/1218197757.proceedWithInvocation(Unknown Source)
at org.springframework.transaction.interceptor.TransactionAspectSupport.invokeWithinTransaction(TransactionAspectSupport.java:294)
at org.springframework.transaction.interceptor.TransactionInterceptor.invoke(TransactionInterceptor.java:98)
...
at com.x.y.z.MyController$$EnhancerBySpringCGLIB$$91a4ad63.invoke(<generated>)
...
at org.springframework.web.servlet.DispatcherServlet.doDispatch(DispatcherServlet.java:991)
at org.springframework.web.servlet.DispatcherServlet.doService(DispatcherServlet.java:925)
at org.springframework.web.servlet.FrameworkServlet.processRequest(FrameworkServlet.java:974)
at org.springframework.web.servlet.FrameworkServlet.doPost(FrameworkServlet.java:877)
at javax.servlet.http.HttpServlet.service(HttpServlet.java:707)
at org.springframework.web.servlet.FrameworkServlet.service(FrameworkServlet.java:851)
at javax.servlet.http.HttpServlet.service(HttpServlet.java:790)
...
at weblogic.servlet.internal.ServletStubImpl.execute(ServletStubImpl.java:350)
at weblogic.servlet.internal.TailFilter.doFilter(TailFilter.java:25)
at weblogic.servlet.internal.FilterChainImpl.doFilter(FilterChainImpl.java:78)
...
at weblogic.work.ExecuteThread.execute(ExecuteThread.java:406)
at weblogic.work.ExecuteThread.run(ExecuteThread.java:346)
If you read this stack trace bottom up;
- It was a WebLogic managed thread (i.e.
weblogic.work.ExecuteThread.run) - Serving an application/ http request. (i.e.
javax.servlet.http.HttpServlet.service) - The http request has been passed on to spring dispatcher-servelet (i.e.
org.springframework.web.servlet.DispatcherServlet.doDispatch), and it then has invoked my ReST API (i.e.com.x.y.z.MyController$$EnhancerBySpringCGLIB$$91a4ad63.invoke). - Presence of
@Transactionalannotation on my service method is confirmed by the fact that spring has initiated a transaction (i.e.org.springframework.transaction.interceptor.TransactionAspectSupport.invokeWithinTransaction), prior to invoking my service layer (i.e.com.x.y.z.MyService.find). - Through my service method, a hibernate query is executed (i.e.
org.hibernate.loader.Loader.executeQueryStatement), which then has delegated the query to the JDBC driver (i.e.oracle.jdbc.driver.OraclePreparedStatementWrapper.executeQuery). - The JDBC driver has aquired a lock on a JDBC connection object in the pool with the address
0x00000007259557e0(i.e.- locked <0x00000007259557e0> (a oracle.jdbc.driver.T4CConnection)). JDBC drivers lock the connections in order to disallow other threads from using the same connection in parallel. - Then the driver has started reading from the associated TCP socket to the database (i.e.
java.net.SocketInputStream.read).
I then checked how many other threads are being blocked by waiting for the 0x00000007259557e0 lock; there was only the below thread.
xxxxxxxxxx
"[ACTIVE] ExecuteThread: '17' for queue: 'weblogic.kernel.Default (self-tuning)'" #267 daemon prio=9 os_prio=0 tid=0x00007fcd48004000 nid=0x664c waiting for monitor entry [0x00007fcc2adf6000]
java.lang.Thread.State: BLOCKED (on object monitor)
at oracle.jdbc.driver.PhysicalConnection.isClosed(PhysicalConnection.java:2959)
- waiting to lock <0x00000007259557e0> (a oracle.jdbc.driver.T4CConnection)
at weblogic.jdbc.wrapper.JTSConnection.isClosed(JTSConnection.java:739)
at org.hibernate.resource.jdbc.internal.LogicalConnectionManagedImpl.releaseConnection(LogicalConnectionManagedImpl.java:193)
at org.hibernate.resource.jdbc.internal.LogicalConnectionManagedImpl.afterTransaction(LogicalConnectionManagedImpl.java:162)
at org.hibernate.engine.jdbc.internal.JdbcCoordinatorImpl.afterTransaction(JdbcCoordinatorImpl.java:288)
at org.hibernate.engine.jdbc.internal.JdbcCoordinatorImpl.afterTransactionCompletion(JdbcCoordinatorImpl.java:478)
at org.hibernate.resource.transaction.backend.jta.internal.JtaTransactionCoordinatorImpl.afterCompletion(JtaTransactionCoordinatorImpl.java:359)
at org.hibernate.resource.transaction.backend.jta.internal.synchronization.SynchronizationCallbackCoordinatorNonTrackingImpl.doAfterCompletion(SynchronizationCallbackCoordinatorNonTrackingImpl.java:60)
at org.hibernate.resource.transaction.backend.jta.internal.synchronization.SynchronizationCallbackCoordinatorTrackingImpl.afterCompletion(SynchronizationCallbackCoordinatorTrackingImpl.java:72)
at org.hibernate.resource.transaction.backend.jta.internal.synchronization.RegisteredSynchronization.afterCompletion(RegisteredSynchronization.java:44)
at weblogic.transaction.internal.ServerSCInfo$CallAfterCompletionsAction.run(ServerSCInfo.java:1977)
at weblogic.security.acl.internal.AuthenticatedSubject.doAs(AuthenticatedSubject.java:368)
at weblogic.security.service.SecurityManager.runAs(SecurityManager.java:163)
at weblogic.transaction.internal.ServerSCInfo.doAfterCompletion(ServerSCInfo.java:1249)
at weblogic.transaction.internal.ServerSCInfo.callAfterCompletions(ServerSCInfo.java:1225)
- locked <0x0000000725b85470> (a weblogic.transaction.internal.ServerSCInfo)
at weblogic.transaction.internal.ServerTransactionImpl.callAfterCompletions(ServerTransactionImpl.java:3656)
at weblogic.transaction.internal.ServerTransactionImpl.abandonNow(ServerTransactionImpl.java:4083)
at weblogic.transaction.internal.ServerTransactionImpl.access$300(ServerTransactionImpl.java:67)
at weblogic.transaction.internal.ServerTransactionImpl$3.run(ServerTransactionImpl.java:4065)
at weblogic.transaction.internal.PlatformHelperImpl$4.run(PlatformHelperImpl.java:1423)
at weblogic.invocation.ComponentInvocationContextManager._runAs(ComponentInvocationContextManager.java:348)
at weblogic.invocation.ComponentInvocationContextManager.runAs(ComponentInvocationContextManager.java:333)
at weblogic.work.LivePartitionUtility.doRunWorkUnderContext(LivePartitionUtility.java:54)
at weblogic.work.PartitionUtility.runWorkUnderContext(PartitionUtility.java:41)
at weblogic.work.SelfTuningWorkManagerImpl.runWorkUnderContext(SelfTuningWorkManagerImpl.java:640)
at weblogic.work.ExecuteThread.execute(ExecuteThread.java:406)
at weblogic.work.ExecuteThread.run(ExecuteThread.java:346)
As evident from the above stack trace, ExecuteThread: '17' is a WebLogic internal thread which does not server any application request, since there are no traces of Servlet. It already has acquired the lock 0x0000000725b85470 and is blocked on waiting for the JDBC connection locked by ExecuteThread: '22'. The frame weblogic.transaction.internal.ServerTransactionImpl.abandonNow gives us a clue that it’s trying to abandon the transaction launched by ExecuteThread: '22', once that transaction has taken more than 1800 seconds. This could be the initial abandoning thread and the below server log must have been made with reference to ExecuteThread: '17'.
xxxxxxxxxx
<Error> <JTA> <[ACTIVE] ExecuteThread: '12'> <BEA-110423> <Abandoning transaction after 1,810 seconds: Name=yyyy,Xid=BEA1-18724489CBE3E0E0AF86(1435460103),Status=Marked rollback. [Reason=weblogic.transaction.internal.TimedOutException: Transaction timed out after 1799 seconds]>
Further to the above thread, I could see additional 397 threads which were in BLOCKED state with the below exact stack trace.
xxxxxxxxxx
"[ACTIVE] ExecuteThread: '16' for queue: 'weblogic.kernel.Default (self-tuning)'" #266 daemon prio=9 os_prio=0 tid=0x00007fcd48002800 nid=0x664b waiting for monitor entry [0x00007fcc0f6ec000]
java.lang.Thread.State: BLOCKED (on object monitor)
at weblogic.transaction.internal.ServerSCInfo.callAfterCompletions(ServerSCInfo.java:1174)
- waiting to lock <0x0000000725b85470> (a weblogic.transaction.internal.ServerSCInfo)
at weblogic.transaction.internal.ServerTransactionImpl.callAfterCompletions(ServerTransactionImpl.java:3656)
at weblogic.transaction.internal.ServerTransactionImpl.abandonNow(ServerTransactionImpl.java:4083)
at weblogic.transaction.internal.ServerTransactionImpl.access$300(ServerTransactionImpl.java:67)
at weblogic.transaction.internal.ServerTransactionImpl$3.run(ServerTransactionImpl.java:4065)
at weblogic.transaction.internal.PlatformHelperImpl$4.run(PlatformHelperImpl.java:1423)
at weblogic.invocation.ComponentInvocationContextManager._runAs(ComponentInvocationContextManager.java:348)
at weblogic.invocation.ComponentInvocationContextManager.runAs(ComponentInvocationContextManager.java:333)
at weblogic.work.LivePartitionUtility.doRunWorkUnderContext(LivePartitionUtility.java:54)
at weblogic.work.PartitionUtility.runWorkUnderContext(PartitionUtility.java:41)
at weblogic.work.SelfTuningWorkManagerImpl.runWorkUnderContext(SelfTuningWorkManagerImpl.java:640)
at weblogic.work.ExecuteThread.execute(ExecuteThread.java:406)
at weblogic.work.ExecuteThread.run(ExecuteThread.java:346)
All of these threads were waiting for the 0x0000000725b85470 lock which was acquired by ExecuteThread: '17'. This may be because the ExecuteThread: '17' could not abandon the transaction, hence WebLogic must have launched a new thread in every 5 seconds to abandon the same as we suspected from the below set of server logs.
xxxxxxxxxx
<Error> <JTA> <[ACTIVE] ExecuteThread: '23'> <BEA-110423> <Abandoning transaction after 1,820 seconds: Name=yyyy,Xid=BEA1-18724489CBE3E0E0AF86(1435460103),Status=Unknown>
<Error> <JTA> <[ACTIVE] ExecuteThread: '25'> <BEA-110423> <Abandoning transaction after 1,825 seconds: Name=yyyy,Xid=BEA1-18724489CBE3E0E0AF86(1435460103),Status=Unknown>
So with the thread dump, I could find answers to below questions that I was stumbling upon.
How many threads have been lanched by WebLogic to abandon the transaction? 398 threads
Were the abandoning threads released to the pool back, so that they could serve other requests? No, they all are infinitely blocked
398 BLOCKED threads are something alarming. Then I quickly check the WebLogic default thread pool size and learnt that it’s 400. The number of BLOCKED + STUCK threads counts up to 400 as well, which means the default thread pool has exhausted. With this understanding I could presumably answer the below question as well;
- Why is the Managed Server losing a high volume of unicast messages? Because the default thread pool is exhausted, the Managed Server did not have threads left to process unicast messages broadcasted by other servers in the cluster.
Hold on, the vice versa should also be true right? I’m presuming the answer now to the original issue.
- Why is the Admin Server showing the Managed Server status as
SHUTDOWN? Because, the same way the Managed Server did not have threads left to process unicast messages broadcasted by other servers in the cluster, the managed server cannot broadcast its heartbeats as well due to the default thread pool exhaustion.
But why did the Managed Server ended up in this situation with 398 BLOCKED threads? As for recovering from the STUCK thread, we could have set -Dsun.net.client.defaultReadTimeout for the JVM, but still, isn’t it the responsibility of WebLogic to manage this provided we already have set statement timeout in the data source? Apparently its a WebLogic bug.
- Why did WebLogic has logged the abandoning transaction message for 398 times? Because it has launched 398 additional threads due to the bug - BUG:27724050 - and WLS versions 12.1.3.0.0 to 12.2.1.3.0 are vulnerable. However, a patch is available - Patch 27724050.
As for the first question - what was wrong at the database end? - we found we had a database node eviction which is not in scope for this post.
Conclusion
Admin server indicated that the managed servers are in SHUTDOWN state was due to the default thread pool exhaustion in managed server – caused by the WebLogic bug BUG:27724050.
Published at DZone with permission of Fahim Farook. See the original article here.
Opinions expressed by DZone contributors are their own.
Comments