Memory Debugging and Watch Annotations
RAM profiling has its strengths and weaknesses. The debugger is the perfect complementary tool that translates obtuse statistics to actionable changes
Join the DZone community and get the full member experience.
Join For Free
Before diving into debugging memory issues and the other amazing running process, memory debugging capabilities (which are amazing)... I want to discuss a point I left open in the last duckling post. Back there we discussed customizing the watch renderer. This is super cool!
But it's also tedious. Before we continue, if you prefer, I cover most of these subjects in these videos:
Duckling the 11th:
— Shai Almog (@debugagent) April 19, 2022
Did you know you can see all the objects in memory?
You can do a diff on memory objects between two breakpoints or a step-over operation.
With a literal stack trace directly to the allocating code!#CodeNewbie #140SecondDucklings pic.twitter.com/6HNPH4pv0Y
Watch Annotations
Last time we discussed customizing the watch UI to render complex objects more effectively. But there's one problem with that: "We aren't alone".
We're a part of a team. Doing this for every machine is difficult and frustrating. What if you're building a library or an API and want this behavior by default?
That's where JetBrains provides a unique solution: custom annotations. Just annotate your code with hints to the debugger and configuration will be seamless to your entire team/users. In order to do this, we need to add the JetBrains annotations to the project path. You can do it by adding this to the Maven POM file:
<dependency>
    <groupId>org.jetbrains</groupId>
    <artifactId>annotations</artifactId>
    <version>23.0.0</version>
</dependency>
Once this is done, we can annotate the class from the previous duckling to achieve the same effect
import org.jetbrains.annotations.Debug.Renderer;

// snipped code ...

@Renderer(text = "\"Repository has \" + count() + \" elements\",",
    childrenArray = "finaAll()",
    hasChildren = "count() > 0")
public interface VisitRepository extends JpaRepository<Visit, Integer> {
    // snipped code  ...
}
Notice we need to escape the strings in the annotation so they will be valid Java Strings. We need to escape the quote symbols and use them to write a "proper" string.
Again everything else matches the content and result we saw in the previous duckling.
Memory Debugger
The primary focus of this post is memory debugging capabilities. By default, JetBrains disables most of these capabilities to boost program execution performance. We can enable the memory debugger view by checking it on the right-hand side of the bottom tool window.

Worse. This has such an impact on performance that IntelliJ doesn’t load the actual content of this class until we explicitly click the "Load Classes" button in the center of the memory monitor:

As you can imagine, this gets old fast. If your machine is slow, then this is a great thing. But if you have an exceptionally powerful machine, then you might want to turn on "Update Loaded Classes on Debugger Stop":
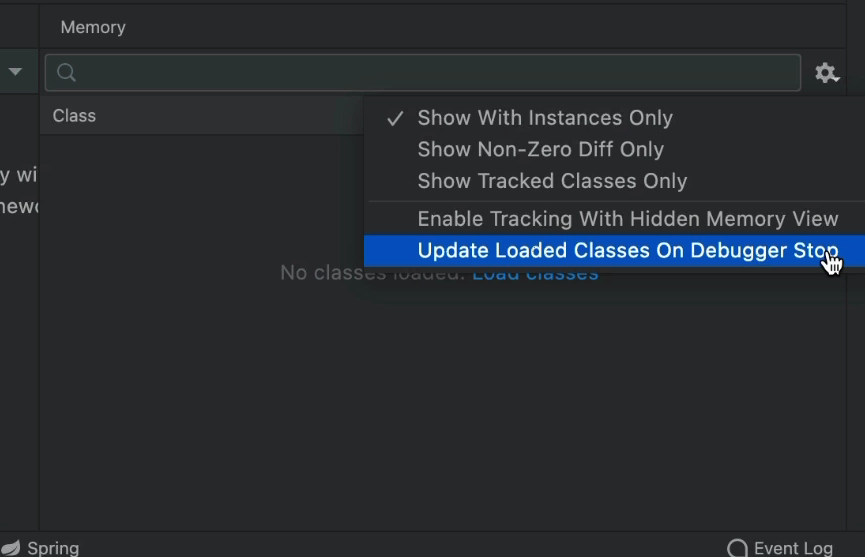
This effectively disables the requirement to click at the cost of slower step over execution. But what do we get as a result?
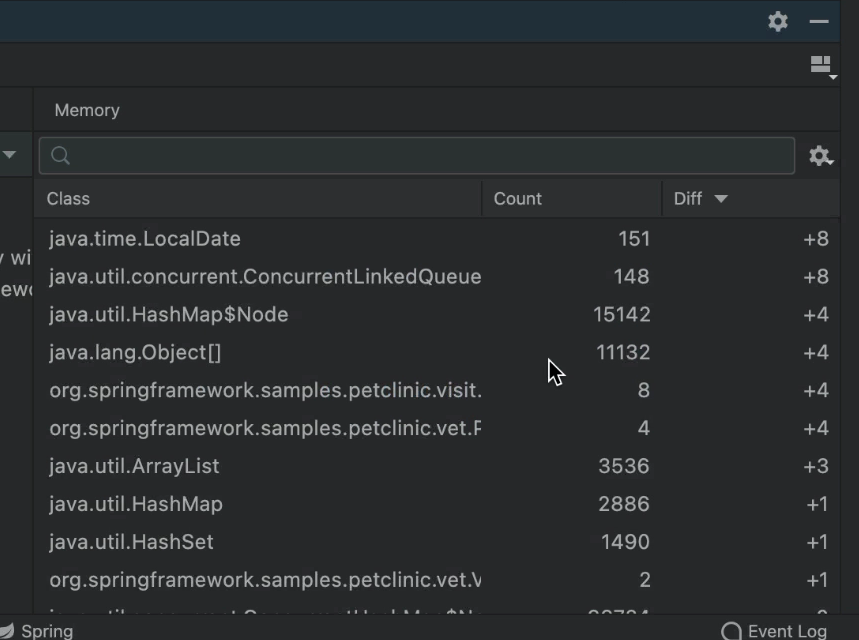
Memory Usage
The panel shows us where a memory block is used when stepping over code or jumping between breakpoints. The memory footprint isn't as obvious, but the scale of memory allocation is.
The diff column is especially useful in tracking issues such as memory leaks. You can get a sense of where a leaking object was allocated and the types of objects that were added between the two points. You can get a very low-level sense of the memory over time. It's a low-level view that's more refined than the profiler view we normally use.
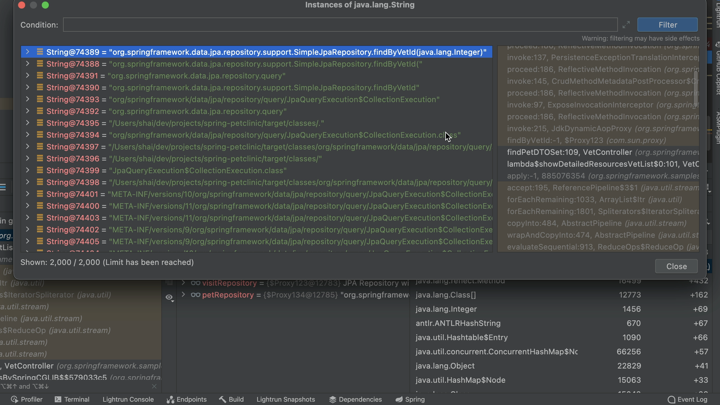
But there's more. We can double click every object on the list and see this:
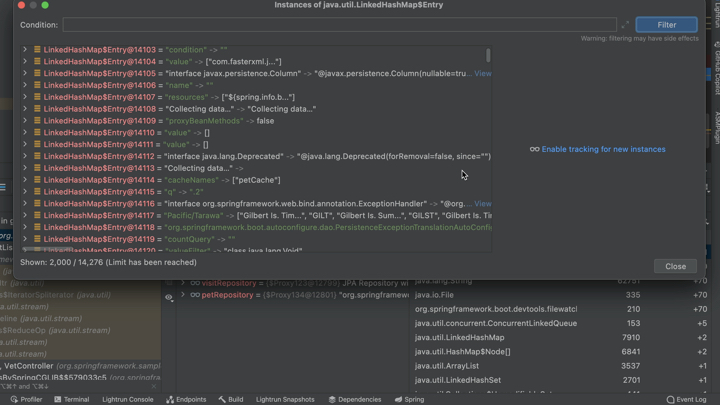
Here we can see all the objects of this type that were allocated in the entire heap. We can get a sense of what's really held in a memory location and again gain deeper insight into potential memory leaks.
Memory Checks
"Track New Instances" enables even more tracking of heap allocations. We can enable this on a per object type basis. Notice this only applies to "proper object" and not arrays. You can enable it through the right-click:
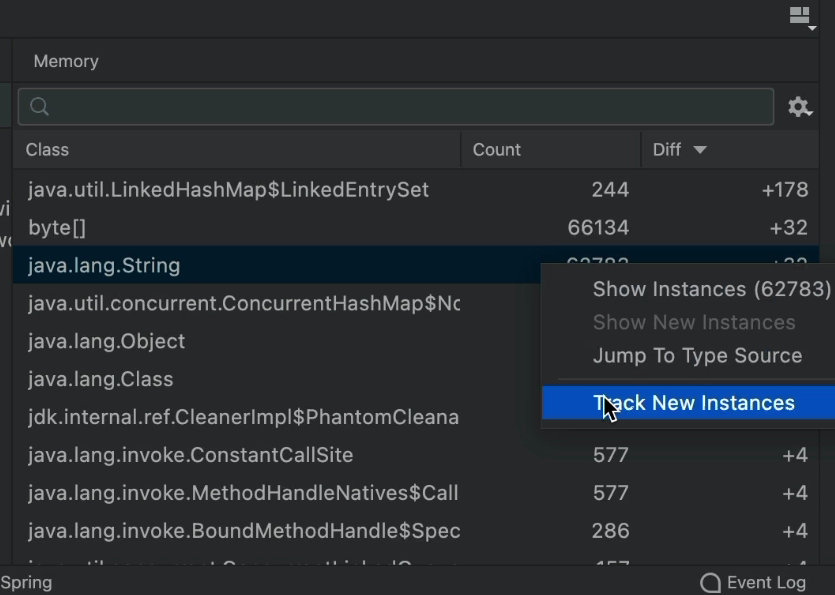
Once we enable this, heap allocations are tracked everywhere. We get backtraces for memory allocations that we can use to narrow down the exact line of code that allocated every object in the heap!
The real benefit though is in the enhanced diff capability. When this is enabled, we can differentiate the specific objects allocated at this point. Say you have a block of code that leaks an object of type MyObject. If you enable tracking on MyObject and run between the two breakpoints, you can see every allocation of MyObject performed only in this block of code...
The backtraces for memory allocations are the missing piece that would show you where each of these object instances was allocated. Literal stack traces from the memory allocator!
This is difficult to see sometimes in memory-intensive applications. When multiple threads allocate multiple objects in memory, the noise is hard to filter. But of all the tools I used, this is by far the easiest.
Finally
One of my favorite things in Java is the lack of real memory errors. There are no invalid memory addresses. No uninitialized memory that leads to invalid memory accesses. No invalid pointers, no memory address (that we're exposed to) or manual configuration. Things "just work".
But there are still pain points that go beyond garbage collection tuning. Heap size is one of the big pain points in Java. It doesn't have to be a leak. Sometimes it's just wastefulness we don't understand. Where does the extra memory go?
The debugger lets us draw a straight line with stack traces directly to the source code line. We can inspect memory contents and get the applicable memory statistics that go well beyond the domain of a profiler. Just to be clear: profilers are great to look at memory in a "big picture" way. The debugger can flesh out that picture with a complete list for a specific block of code.
Published at DZone with permission of Shai Almog. See the original article here.
Opinions expressed by DZone contributors are their own.
Comments