Memory Leak Due To Improper Exception Handling
In this post, let’s discuss an interesting memory problem we confronted in the production environment and how we went about solving it.
Join the DZone community and get the full member experience.
Join For Free
In this post, let’s discuss an interesting memory problem we confronted in the production environment and how we went about solving it. This application would take traffic for a few hours after that it would become unresponsive. It wasn’t clear what was causing the unresponsiveness in the application.
Technology Stack
This application was running on AWS cloud in r5a.2xlarge EC2 instances. It was a Java application running on an Apache Tomcat server using the Spring framework. It was also using other AWS services like S3 and Elastic Beanstalk. This application had a large heap size (i.e. -Xmx): 48GB.
Troubleshooting
We used yCrash tool to troubleshoot the problem. We let the application take traffic for 15 minutes. After that we executed yCrash script against this application. yCrash script captures 360-degree artifacts from the application stack, analyzes them, and presents the root cause of the problem. Data that yCrash script captures includes: Garbage Collection log, thread dump, heap dump, netstat, vmstat, iostat, top, and ps.
yCrash analyzed the artifacts and reported that the application was suffering from a memory leak. Below is the heap dump analysis report generated by yCrash:
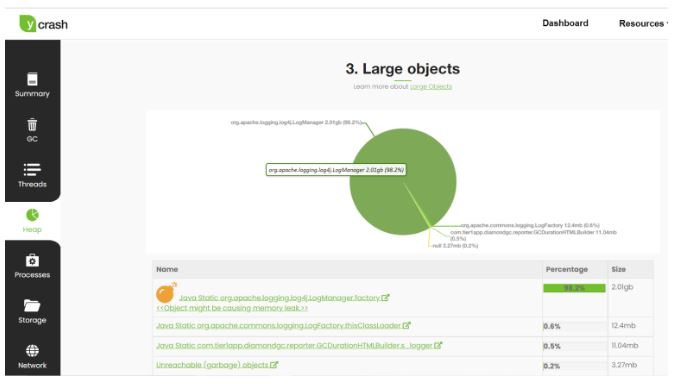
Fig 1: Large objects report (generated by yCrash)
You can notice that yCrash is pointing out "org.apache.logging.log4j.LogManager" to be the largest object in the memory. This object alone occupies 98.2% of total memory. The remaining objects occupy less than 2% of memory. Below is the object tree of this largest object:
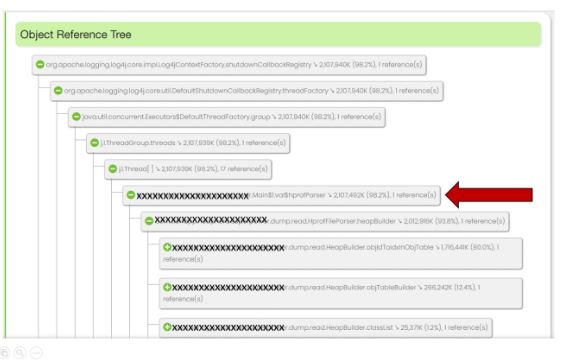
Fig 2: Object reference tree
See the red arrow mark in the object tree. This is the starting point of the application codebase. Initially, part of the package name has been masked in Fig 2 to hide the identity of the application. You can notice "xxxxxxxx.superpower.Main$1.val$hprofParser" object to occupy 98.2% of the memory of this object.
This application has a class by the name "xxxxxxxxxxxxxxx.Main." It’s clear that the leak is originating from this Main object. However, it may not be clear what "xxxxxxxxxxxxxxx.Main$1" means. "$1" indicates that it’s the first anonymous inner class in the "xxxxxxxxxxxxxxx.Main" class. Anonymous inner class is a style of programming where you can define an inner class without giving a name to it in a parent class. However, this is not a widely-used programming practice in Java. Thank God. Because anonymous inner class not only hurts the readability of the program but also makes the troubleshooting tricky.
Below is the high-level source code of the "xxxxxxxxxxxxxxx.Main." To reduce the noise and improve the readability, non-relevant code from the class has been removed and ellipses have been introduced.
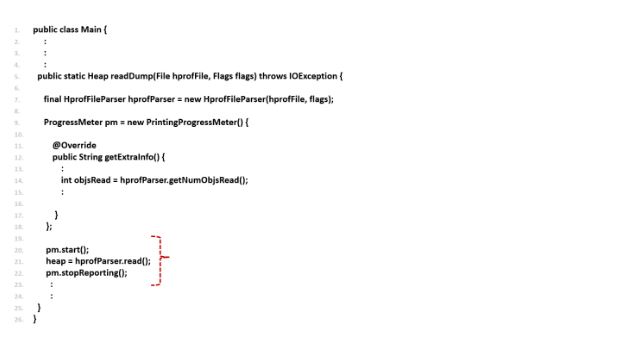
Fig 3: Source code causing memory leak
You can notice that line #9 has the Anonymous inner class. This Anonymous inner class extends the PrintingProgressMeter class. PrintingProgressMeter class in turn extends java.util.Thread. Whenever any class extends java.util.Thread, it becomes a thread.
On line #20, this PrintingProgressMeter thread is started using pm.start() method; in line #21, hprofParser.read() method is invoked; and, in line #22, the thread is stopped using the pm.stopReporting() method. This code looks quite normal, right? What can trigger a memory leak in the application?
Problem: Exception Handling
Under certain scenarios hprofParser.read() method in line #21 may throw an exception. If an exception is thrown, then line #22 pm.stopReporting() will not be invoked. If this line is not invoked, then the thread will be running forever and never exit. If the thread doesn’t exit, then the thread and the objects it references (i.e., hprofParser) can never be reclaimed from memory. It will ultimately lead to a memory leak.
Solution
In most performance problems, identifying the root cause of the problem is difficult. Fixing them is fairly trivial. This problem is no exception to it.
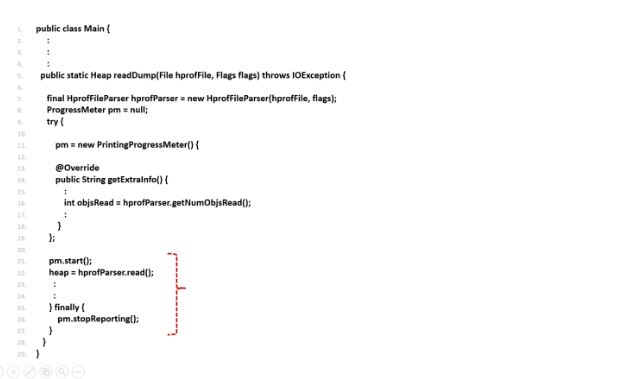
Fig 4: Source code after fixing a memory leak
We moved the pm.stopReporting() method into the finally clause. In the Java programming language, code within the finally clause will be executed always regardless of whether an exception is thrown or not thrown in the enclosing code block. More details about the finally clause can be found here. Thus, even if hprofParser.read() method throws an exception, pm.stopReporting() method will be invoked, which will cause the thread to terminate. Once the thread is terminated, all the objects it references will become eligible for garbage collection.
Once we made this change, the problem got resolved instantly.
Moral of the Story
Proper exception handling is required. A small overlook is capable of bringing the application to a grinding halt.
Video
Published at DZone with permission of Ram Lakshmanan. See the original article here.
Opinions expressed by DZone contributors are their own.
Comments