

Getting Hands-On With Monitoring AI Agents and Models in Gemini Enterprise Agent Platform
Learn how to monitor agents and models using Cloud Trace, Cloud Logging and Cloud Monitoring to track metrics around usage, token consumption and runtime activity.
Join the DZone community and get the full member experience.
Join For FreeThe deployment of a model or an agent is just the first step. Once it starts processing requests, you need a way to track how often the model is called, how long requests take, how many tokens are used, and whether there are errors. For agents, we also want to know what's happening at each step.
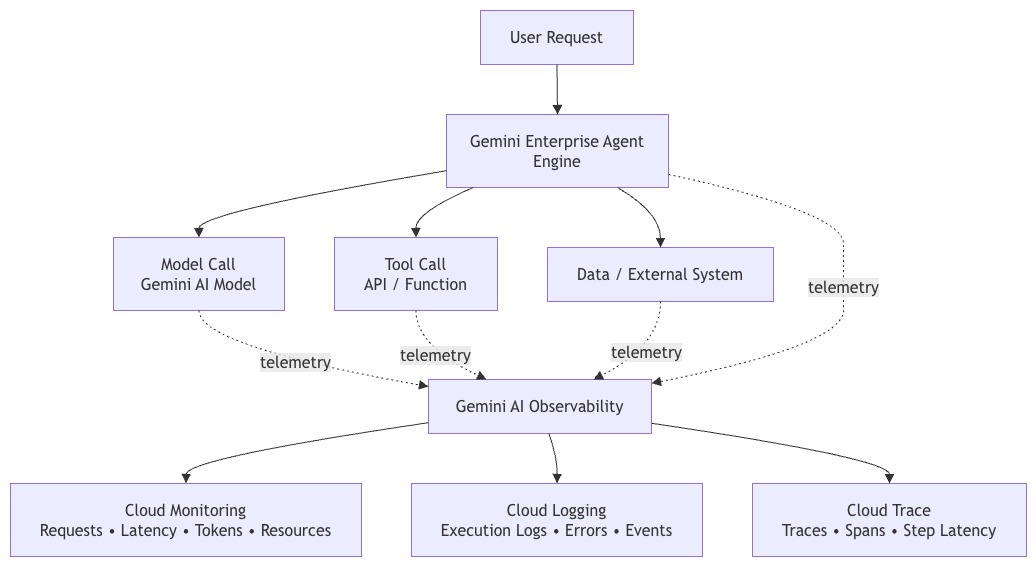
Gemini Enterprise Agent Platform offers various methods for gaining such visibility. Cloud Monitoring is responsible for operational metrics related to the models and agents, Cloud Logging enables you to explore execution details and errors, and Cloud Trace will help you gain further insights into the execution of the agents.
Model and agent observability are not always the same. The platform exposes some telemetry, such as token usage at the model level, whereas it exposes operational signals such as request count, latency, and resource signals at the Agent level.
In this article, we will walk through each of these different layers and see how they can be leveraged together to monitor both models and agents running on the Gemini Enterprise Agent Platform.
What Can You Monitor in the Gemini Enterprise Agent Platform?
| What we're monitoring | Gemini Enterprise Agent Platform resource | What we can observe |
|---|---|---|
| Generative AI models | aiplatform.googleapis.com/PublisherModel |
Model invocations, token usage, latency |
| AI agents | aiplatform.googleapis.com/ReasoningEngine |
Requests, request latency, compute/resource signals |
Google uses a single monitoring API (Cloud Monitoring v3) for all metrics. Agent token-level metrics (input/output tokens) are available at the model level (PublisherModel), not at the agent level. Agent Engine metrics only provide request count and latency.
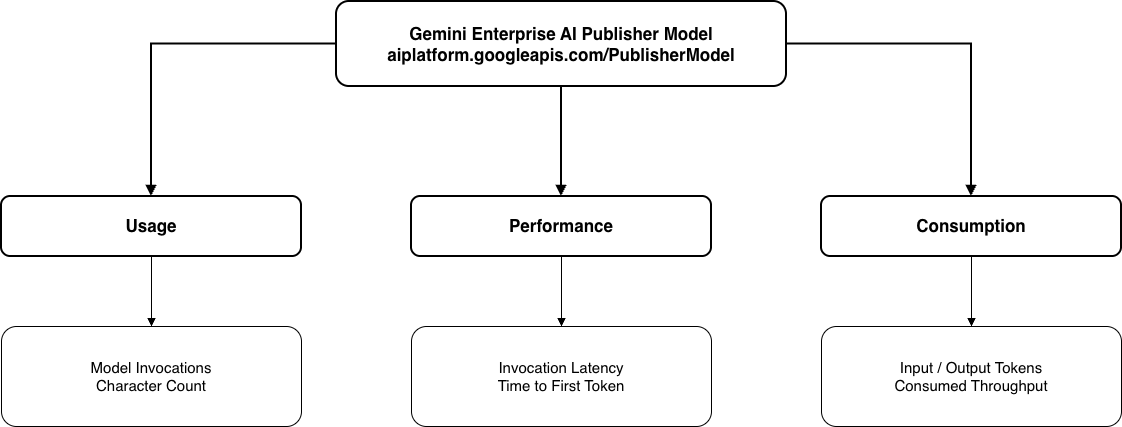
Monitoring AI Models in Gemini — Google Managed
For Google-managed models, the platform exposes metrics through the following resource:
Resource type: aiplatform.googleapis.com/PublisherModel
These are for Google-managed models (MaaS) — Gemini models, partner models with managed endpoints. Metrics are automatically collected; no setup needed.
Key Available Model Metrics
| Metric Type (full path) | Description | Labels/Dimensions | Unit |
|---|---|---|---|
|
|
Number of model invocations |
input_token_size, output_token_size, max_token_size, response_code, request_type, method, error_category, source |
Count |
|
|
Token count (input/output) |
max_token_size, type (input/output), request_type, modality, source |
Count |
|
|
End-to-end invocation latency |
input_token_size, output_token_size, max_token_size, latency_type, request_type, source |
ms (Distribution) |
|
|
Time to first token |
input_token_size, output_token_size, max_token_size, request_type |
ms (Distribution) |
|
|
Character count |
type (input/output), request_type, modality |
Count |
|
|
Consumed throughput |
request_type, modality |
Count |
Note: The type label on token_count differentiates between input and output tokens.
Quota/Rate Metrics (Per Model)
| Metric Type | Description |
|---|---|
|
|
Input token rate per model |
|
|
Output token rate per model |
|
|
Request rate per model |
|
|
GenerateContent input token rate |
|
|
GenerateContent request rate |
The above rate metrics can help determine how fast the model consumes tokens and handles requests. The base_model tag helps distinguish between underlying models, which will become important once the project uses multiple Gemini or partner models.
Monitoring Custom Model Endpoints
So far we covered metrics for models managed by Google. For models that are deployed to custom Vertex AI endpoints, the monitoring is exposed through a different resource type:
Resource type: aiplatform.googleapis.com/Endpoint
This is for self-deployed models on Vertex AI endpoints.
| Metric Type | Description | Labels |
|---|---|---|
|
|
Number of predictions |
deployed_model_id, model_display_name, endpoint_display_name |
|
|
Number of errors |
deployed_model_id, model_display_name, endpoint_display_name |
|
|
Prediction latency |
deployed_model_id, latency_type, model_display_name |
|
|
Response count by status |
deployed_model_id, response_code, model_display_name |
|
|
Active replicas |
deployed_model_id |
|
|
CPU usage |
deployed_model_id, replica_id |
|
|
Memory usage |
deployed_model_id, replica_id |
Monitoring AI Agents
For Agents deployed through Agent Runtime in Gemini Enterprise Agent Platform, the metrics are exposed through the following resource type:
Resource type: aiplatform.googleapis.com/ReasoningEngine
Note: As part of Google's 2026 naming changes, Vertex AI is now part of Gemini Enterprise Agent Platform, and Vertex AI Agent Engine is now called "Agent Runtime."The underlying API resource still continues to use ReasoningEngine.
Available Agent Metrics
| Metric Type (full path) | Description | Labels | Unit |
|---|---|---|---|
|
|
Number of agent requests |
response_code, response_code_class |
Count (DELTA) |
|
|
Agent request latency |
response_code |
ms (Distribution) |
|
|
CPU allocation time |
s |
|
|
|
Memory allocation time |
s |
Important limitation: Agent Runtime does NOT have agent-level token metrics. Token usage is tracked at the model level (publisher/online_serving/token_count). To get per-agent token breakdown, you need Cloud Trace or Cloud Logging.
Agent Resource Labels (For Filtering)
| Label | Description |
|---|---|
|
|
Google Cloud project ID |
|
|
GCP region |
|
|
Agent instance ID (equivalent to AgentId in Azure) |
cURL Commands for Retrieving Metrics
Now let's look at some of the commands that we can use to retrieve the agent and model metrics.
Authentication
# Set up alias for authenticated curl

alias gcurl='curl -H "Authorization: Bearer $(gcloud auth print-access-token)" -H "Content-Type: application/json"'

# Or get token explicitly

gcloud auth print-access-token
List Available Agent Metric Definitions
gcurl 'https://monitoring.googleapis.com/v3/projects/{PROJECT_ID}/metricDescriptors?filter=metric.type%3Dstarts_with(%22aiplatform.googleapis.com/reasoning_engine%22)'
Agent Request Count (specific agent, time window)
gcurl 'https://monitoring.googleapis.com/v3/projects/{PROJECT_ID}/timeSeries?filter=metric.type%3D%22aiplatform.googleapis.com/reasoning_engine/request_count%22%20AND%20resource.labels.reasoning_engine_id%3D%22{AGENT_ID}%22&interval.startTime=2026-05-10T00:00:00Z&interval.endTime=2026-05-11T00:00:00Z'
Agent Request Latencies
gcurl 'https://monitoring.googleapis.com/v3/projects/{PROJECT_ID}/timeSeries?filter=metric.type%3D%22aiplatform.googleapis.com/reasoning_engine/request_latencies%22%20AND%20resource.labels.reasoning_engine_id%3D%22{AGENT_ID}%22&interval.startTime=2026-05-10T00:00:00Z&interval.endTime=2026-05-11T00:00:00Z'Model Invocation Count (all models)
gcurl 'https://monitoring.googleapis.com/v3/projects/{PROJECT_ID}/timeSeries?filter=metric.type%3D%22aiplatform.googleapis.com/publisher/online_serving/model_invocation_count%22&interval.startTime=2026-05-10T00:00:00Z&interval.endTime=2026-05-11T00:00:00Z'Model Token Count (input + output)
gcurl 'https://monitoring.googleapis.com/v3/projects/{PROJECT_ID}/timeSeries?filter=metric.type%3D%22aiplatform.googleapis.com/publisher/online_serving/token_count%22&interval.startTime=2026-05-10T00:00:00Z&interval.endTime=2026-05-11T00:00:00Z'
To filter by input tokens only, add label filter:
gcurl 'https://monitoring.googleapis.com/v3/projects/{PROJECT_ID}/timeSeries?filter=metric.type%3D%22aiplatform.googleapis.com/publisher/online_serving/token_count%22%20AND%20metric.labels.type%3D%22input%22&interval.startTime=2026-05-10T00:00:00Z&interval.endTime=2026-05-11T00:00:00Z'
Model Invocation Latency
gcurl 'https://monitoring.googleapis.com/v3/projects/{PROJECT_ID}/timeSeries?filter=metric.type%3D%22aiplatform.googleapis.com/publisher/online_serving/model_invocation_latencies%22&interval.startTime=2026-05-10T00:00:00Z&interval.endTime=2026-05-11T00:00:00Z'Custom Endpoint Prediction Count
gcurl 'https://monitoring.googleapis.com/v3/projects/{PROJECT_ID}/timeSeries?filter=metric.type%3D%22aiplatform.googleapis.com/prediction/online/prediction_count%22&interval.startTime=2026-05-10T00:00:00Z&interval.endTime=2026-05-11T00:00:00Z'Sample Response (Agent Request Count)
{
  "timeSeries": [
    {
      "metric": {
        "labels": {
          "response_code": "200",
          "response_code_class": "2xx"
        },
        "type": "aiplatform.googleapis.com/reasoning_engine/request_count"
      },
      "resource": {
        "type": "aiplatform.googleapis.com/ReasoningEngine",
        "labels": {
          "reasoning_engine_id": "AGENT_ID",
          "location": "us-central1",
          "project_id": "PROJECT_ID"
        }
      },
      "metricKind": "DELTA",
      "valueType": "INT64",
      "points": [
        {
          "interval": {
            "startTime": "2026-05-10T18:55:27.001Z",
            "endTime": "2026-05-10T18:56:27Z"
          },
          "value": {
            "int64Value": "25"
          }
        }
      ]
    }
  ],
  "unit": "1"
}Note: Agent requests and Latency data are retrieved from ReasoningEngine, whereas, model invocations and token consumption data are retrieved from the PublisherModel. Both of these combined provide visibility across both layers without having to retrieve all the telemetry from a single source.
Agent Logging (Cloud Logging)
What It Provides
Agent logs are written to Cloud Logging and include agent execution logs, errors, and custom log entries. Logs are automatically collected for deployed agents.
Where to View the Logs
- Google Cloud Console: Logs Explorer -> Resource Type: " Reasoning Engine"
- REST API: Cloud Logging API v2
Filtering Logs by Operation Type
| Operation | REST Endpoint |
|---|---|
|
Synchronous/Async queries |
|
|
Streaming queries |
|
|
Bidirectional streaming |
|
cURL Command to Query Logs
gcurl -X POST 'https://logging.googleapis.com/v2/entries:list' \
--data '{
    "resourceNames": ["projects/{PROJECT_ID}"],
    "filter": "resource.type=\"aiplatform.googleapis.com/ReasoningEngine\" AND resource.labels.reasoning_engine_id=\"{AGENT_ID}\"",
    "orderBy": "timestamp desc",
    "pageSize": 50
}'
Agent Tracing (Cloud Trace)
What It Provides
Per-request execution traces with spans for each step (LLM call, tool call, etc.), including inputs/outputs, latency per step, and metadata.
Setup Required
Requires enabling the Cloud Trace API and instrumenting agent code with OpenTelemetry. For ADK (Agent Development Kit) agents, tracing is built-in.
Where to View
- Google Cloud Console: Agent Platform Deployments -> Select instance -> Traces tab
- Session view: Grouped by conversation session
- Span view: Individual execution spans with DAG visualization
Key Limitations for Vertex AI
- No agent-level token metrics. Agent Engine only tracks request_count and request_latencies. Token usage is only available at the model level (
PublisherModelresource). To correlate agent-to-token usage, you need tracing/logging. - Model metrics are by
base_model, not deployment name. Unlike Azure which filters byModelDeploymentName, Vertex usesbase_modelas the label (e.g.,gemini-2.0-flash). - Distribution metrics. Latency and token metrics are
DISTRIBUTIONtype (histograms), not simple averages. You need to useaggregationparameters to get percentiles or means. - Rebranding in progress. Vertex AI Agent Engine is being rebranded to "Gemini Enterprise Agent Platform". Docs may refer to either name. The API resource name remains
ReasoningEngine.
Conclusion
Visibility into models and agents does not necessarily begin with an advanced observability approach. As we discussed in this article, Cloud Monitoring can provide insights into the usage and performance of models and agents, while Cloud Logging can offer additional context when we need to understand what is happening beneath the metrics.
What is essential here is realizing that monitoring the model is not equivalent to monitoring the agent that utilizes the model. When we consider both levels together, we get a much more accurate picture of what is happening when the AI application goes live.
Opinions expressed by DZone contributors are their own.
Comments