Monitoring and Troubleshooting Java Applications in Docker Containers
This article is a study and practical guide for the performance analysis, tuning, and troubleshooting of Java services running within Docker containers.
Join the DZone community and get the full member experience.
Join For FreeMoneySuite is a Fintech SaaS platform offering payments and financial automation solutions. As a regulated financial service provider, our applications are bank-grade Java microservices running in Docker container images.
As an integral part of our service operations readiness, we conduct thorough performance analysis and troubleshooting for our services running in the Docker infrastructure for the following purposes:
- Analyzing and tuning service performance: Docker containers operate within a confined subset of system resources. Applications running inside Docker undergo meticulous performance analysis and tuning under stress to ensure optimal functionality within the restricted environment.
- Debugging production issues: The Java service Docker images require vigilant monitoring and troubleshooting in a live production environment, presenting distinct challenges compared to managing them on the host machine.
This blog comprehensively discusses and shares the methodologies we’ve implemented to achieve performance analysis and effective troubleshooting for Java Docker images running within Docker containers.
Container Monitoring Tools
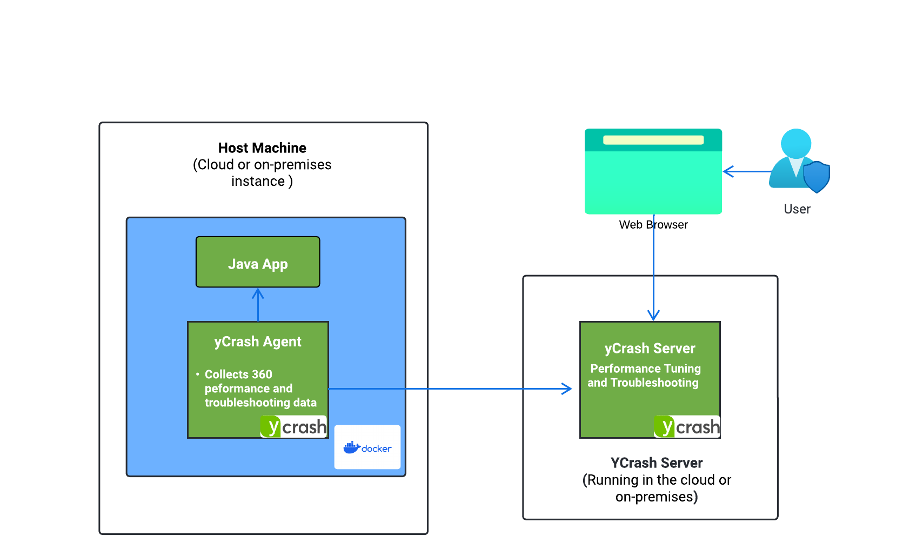
Container services are comparatively new to enterprises, and there are only very few tools available for container management. In this blog, we will be using yCrash, a non-intrusive comprehensive tool with 360° data capture and analysis for troubleshooting container environments and the services running in it.
Set Up yCrash
Setting up yCrash involves three simple steps:
- Register with yCrash.
- Install the yCrash Agent.
- Set up the yCrash Server.
Register With yCrash
yCrash offers a free tier. You can register on their website.
Install yCrash Server
The yCrash server is a web application that provides an incident management report and comes in two variants:
- Cloud Service — A secured managed service with no installation required
- Enterprise Edition — An on-premises instance that offers greater control and adheres to enterprise compliance requirements
Note: For this tutorial, we will be using the cloud service.
Install yCrash Agent
The yCrash agent captures a 360° view of the service and underlying infrastructure. It can be deployed with just a few simple steps.
The yCrash agent can be installed in the container along with the application or outside the container. In this example, we will be using the in-container option.
Please refer to the yCrash agent installation guide at the following link here.
Sample Application
Troubleshooting can be done to any Docker container running Java service. For this blog, we utilized the Spring Boot container application, a comprehensive Spring Boot container API service capable of simulating various performance problems.
You can check out and run the Spring Boot Buggy API service from this GitHub repo.
yCrash is non-intrusive, incurs almost zero overhead, and exhibits in-depth analysis capabilities.

YCrash summary of the incident reported on a Docker image
Java App: RCA and Performance Tuning
The Java process running in the containers needs performance tuning and continuous monitoring to check if it runs healthily under the container environment. The analysis tools, such as YCrash, will show in detail the health and performance stats of the Java applications. The Java app performance parameters include:
- Garbage Collection analysis: A wrongly configured GC could result in application performance degradation and increased resource usage. It is essential to analyze and tune GC configuration settings definitively.

YCrash showing GC stats for tuning
- Thread analysis: Design and coding errors could lead to severe thread problems, such as deadlocks and blocked threads. An in-depth analysis of thread status is required to analyze and fix performance-related thread issues.
Below is the thread dump analysis report from the yCrash tool highlighting the two threads and their stack trace which were causing the Deadlock.

YCrash highlighting deadlocks issue with detail
You can clearly see yCrash reporting Thread-4 and Thread-5 suffering from Deadlock. yCrash also reports the stack trace of Thread-4 and Thread-5. From the stack trace, you can notice Thread-5 acquired the lock of CoolObject, and it is waiting for the HotObject lock. On the other hand, Thread-1 acquired the lock of HotObject, and it is waiting for the CoolObject lock. Now based on this stacktrace, we know the exact line of code that is causing the problem.
- Heap and memory analysis: Memory analysis is a critical part of Java applications to avoid any critical outages related to memory, such as heap space unavailability and stack overflow.
- Log analysis: Most applications log exceptions to application log files, which helps in analyzing Java errors in runtime.
Resource Monitoring
The Docker service running inside the container environments requires regular health monitoring for health and maintenance purposes. The common things that are monitored include:
- Process management: Service maintenance involves monitoring the process status running on the container machine.
- Network health: Network monitoring to understand the slowness or outages resulted due to network connections
- Resource management: There is a requirement to monitor the complete resources of the containers, such as CPU utilization, IO, etc., that could affect the performance of the service running in the container environment.
- Disk management: Keep monitoring the disk space; running out of disk space will result in degraded application performance or even crashing.

YCrash showing 360-degree resource view of Docker container
Continuous Log Monitoring and Notifications
To continuously monitor for errors or performance degradations, the logs inside the container environment need to be monitored for any exceptions. The environment should be thoroughly monitored, and any incidents should be reported through notifications for immediate service management actions.
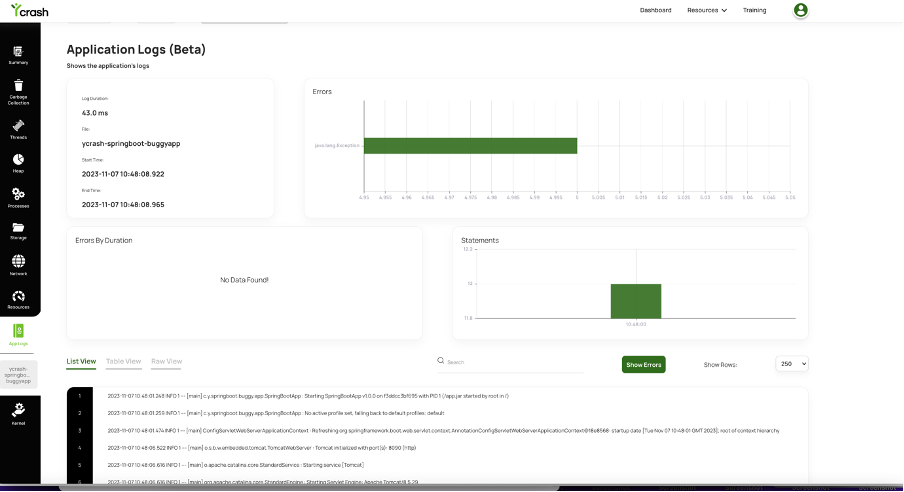
YCrash showing log status highlighting exceptions
Conclusion
We have seen the importance of monitoring and managing the service running in a Docker container environment with a real example — a monitoring tool like YCrash, which displays all the details of the Docker container for performance tuning, root cause analysis, and continuous monitoring.
Published at DZone with permission of Ganesh Balakrishnan. See the original article here.
Opinions expressed by DZone contributors are their own.
Comments