Monitoring Health of ASP.NET Core Background Services With TCP Probes on Kubernetes
Many microservices applications require background tasks and scheduled jobs to process requests asynchronously. In the .NET Core ecosystem, background servic...
Join the DZone community and get the full member experience.
Join For FreeMany microservices applications require background tasks and scheduled jobs to process requests asynchronously. In the .NET Core ecosystem, background services are called Hosted services because a single host, such as a web host or a console host, can run several such services in the background while it is alive. In terms of implementation, a hosted service is required to implement the IHostedService interface.
You can implement the IHostedService interface yourself, or even better, leverage the BackgroundService class that implements some common concerns such as cancellation token management and error propagation to the host for you. A class inheriting from the BackgroundService abstract class only needs to implement the ExecuteAsync method to define the background task's business logic. If you want to read more about the internals of ASP.NET Core background tasks, please refer to the Microsoft documentation.
Kubernetes relies on probes in your application to assess whether your application is healthy. If you are not familiar with the health probes used by Kubernetes, you can read more about them on the Kubernetes documentation. If your application continuously fails to respond or responds with an error to several probe requests, Kubernetes restarts the pod.
In ASP.NET Core, you can use the implicitly referenced package Microsoft.AspNetCore.Diagnostics.HealthChecks to add health checks to your application. The core health check package does not support probing external services such as a database. If your application's health depends on external services, you can add custom probes by implementing the IHealthCheck interface. We will shortly see how simple it is to implement one. Refer to the official Microsoft guidance on health checks for ASP.NET Core applications that describes this concept.
The default implementation of health checks on ASP.NET Core comprises a middleware, a hosted service, and a few libraries. The health check probes are exposed by your application over HTTP. Since there is a lot of goodness packaged in the ASP.NET Core health check framework, we will leverage it to expose health checks over TCP. But why should you consider the modified TCP based implementation of health checks over the default HTTP based one? You might not want to include the whole shebang of routing and middleware in your background services on which the ASP.NET Core health checks depend. In such cases, exposing a single port attached to a TCP listener is a suitable choice.
The Nine to Five Application
There are days at the office when you are just counting minutes until the clock strikes five. For pushing through such days, I built a simple background service that displays the number of minutes left in the workday from Monday to Friday between 9 A.M and 5 P.M. The source code of the application is available on my GitHub repository.
We will configure health checks on this service and deploy it to our local Kubernetes cluster. I recommend using either Docker Desktop or KinD for running a local Kubernetes cluster. Let's discuss the details of implementing this service next.
Hosted Service
The following code listing presents the hosted service/background service that logs the time left in the workday every minute. It also logs a message every minute for weekends and before and after work hours.
xxxxxxxxxx
public class Worker : BackgroundService
{
private readonly ILogger<Worker> _logger;
public Worker(ILogger<Worker> logger)
{
_logger = logger;
}
protected override async Task ExecuteAsync(CancellationToken stoppingToken)
{
var fiveOClock = new TimeSpan(17, 0, 0);
var nineOClock = new TimeSpan(9, 0, 0);
var timeZone = DateTimeZoneProviders.Tzdb["Australia/Sydney"];
while (!stoppingToken.IsCancellationRequested)
{
var now = Instant.FromDateTimeUtc(DateTime.SpecifyKind(DateTime.UtcNow, DateTimeKind.Utc));
var nowLocal = now.InZone(timeZone).ToDateTimeUnspecified();
if (nowLocal.DayOfWeek == DayOfWeek.Saturday || nowLocal.DayOfWeek == DayOfWeek.Sunday)
{
_logger.LogInformation("{Time}: Cheers to the weekend!", nowLocal);
}
else
{
var message = nowLocal switch
{
_ when nowLocal.Hour >= 9 && nowLocal.Hour <= 16 =>
$"Hang in there, just {fiveOClock.Subtract(nowLocal.TimeOfDay).TotalMinutes} minutes to go!",
_ when nowLocal.Hour < 9 =>
$"Get ready, office hours start in {nineOClock.Subtract(nowLocal.TimeOfDay).TotalMinutes} minutes!",
_ => "You are done for the day, relax!"
};
_logger.LogInformation("{Time}: " + message, nowLocal);
}
await Task.Delay(TimeSpan.FromMinutes(1), stoppingToken);
}
}
}
To execute this service, you need to register it with the host using the AddHostedService method.
xxxxxxxxxx
public static IHostBuilder CreateHostBuilder(string[] args)
{
return Host.CreateDefaultBuilder(args)
.ConfigureServices((hostContext, services) =>
{
// Register services that do actual work here.
services.AddHostedService<Worker>();
});
}
Let's now add health checks to our service and deploy it to Kubernetes.
Health Check Service
You can add custom health checks to your application by implementing the IHealthCheck interface, which requires defining the CheckHealthAsync method. The following health check implementation always reports the application state as healthy. You can add custom logic to this method to return an appropriate response, denoting the actual health of the service.
xxxxxxxxxx
public Task<HealthCheckResult> CheckHealthAsync(HealthCheckContext context,
CancellationToken cancellationToken = new CancellationToken())
{
return Task.FromResult(new HealthCheckResult(HealthStatus.Healthy));
}
To register the custom health check, you need to add the service type and the name of the check to the health check services using the AddCheck method as follows.
xxxxxxxxxx
return Host.CreateDefaultBuilder(args)
.ConfigureServices((hostContext, services) =>
{
// Health check services. A custom health check service is added for demo.
services.AddHealthChecks().AddCheck<CustomHealthCheck>("custom_hc");
});
We now need to attach a TCP listener to the health check port to report the service's health when Kubernetes executes a liveness or readiness probe on the pod hosting the service. Following is the implementation of the TcpHealthProbeService which is a hosted service that does that.
xxxxxxxxxx
public sealed class TcpHealthProbeService : BackgroundService
{
private readonly HealthCheckService _healthCheckService;
private readonly TcpListener _listener;
private readonly ILogger<TcpHealthProbeService> _logger;
public TcpHealthProbeService(
HealthCheckService healthCheckService,
ILogger<TcpHealthProbeService> logger,
IConfiguration config)
{
_healthCheckService = healthCheckService ?? throw new ArgumentNullException(nameof(healthCheckService));
_logger = logger;
// Attach TCP listener to the port in configuration
var port = config.GetValue<int?>("HealthProbe:TcpPort") ?? 5000;
_listener = new TcpListener(IPAddress.Any, port);
}
protected override async Task ExecuteAsync(CancellationToken stoppingToken)
{
_logger.LogInformation("Started health check service.");
await Task.Yield();
_listener.Start();
while (!stoppingToken.IsCancellationRequested)
{
// Gather health metrics every second.
await UpdateHeartbeatAsync(stoppingToken);
Thread.Sleep(TimeSpan.FromSeconds(1));
}
_listener.Stop();
}
private async Task UpdateHeartbeatAsync(CancellationToken token)
{
try
{
// Get health check results
var result = await _healthCheckService.CheckHealthAsync(token);
var isHealthy = result.Status == HealthStatus.Healthy;
if (!isHealthy)
{
_listener.Stop();
_logger.LogInformation("Service is unhealthy. Listener stopped.");
return;
}
_listener.Start();
while (_listener.Server.IsBound && _listener.Pending())
{
var client = await _listener.AcceptTcpClientAsync();
client.Close();
_logger.LogInformation("Successfully processed health check request.");
}
_logger.LogDebug("Heartbeat check executed.");
}
#pragma warning disable CA1031 // Do not catch general exception types
catch (Exception ex)
{
_logger.LogCritical(ex, "An error occurred while checking heartbeat.");
}
#pragma warning restore CA1031 // Do not catch general exception types
}
}
Inside the UpdateHeartbeatAsync method, which is invoked every second, we call the CheckHealthAsync method of the HealthCheckService class that requests all the registered health check services to report the health of the service. Based on the response that we receive, we either respond to the probe or halt the TCP listener and do not report the service's health. Kubernetes treats unresponded requests as a permanent error after reaching the consecutive failure threshold. Unlike HTTP probes that give you the option to respond to every probe request with the appropriate status code to indicate the health of the service, with TCP probes, you can either accept or reject a TCP connection from Kubernetes to indicate the health of the service.
Deploy to Kubernetes
Use the following command to build a container image named nine-to-five:1.0.0 using the Dockerfile present in the OfficeCountdownClock project.
xxxxxxxxxx
docker build . -t nine-to-five:1.0.0
Next, use the following Kubernetes specification to deploy the background service as a pod. In the repository, you will find this specification in the file named deploy.yml.
xxxxxxxxxx
apiVersionv1
kindNamespace
metadata
namedemo-ns
---
apiVersionv1
kindPod
metadata
nameworker
namespacedemo-ns
labels
appnine-to-five
spec
containers
namenine-to-five
imagenine-to-five1.0.0
ports
namehealth-check
containerPort5000
hostPort5000
readinessProbe
tcpSocket
porthealth-check
initialDelaySeconds5
failureThreshold2
timeoutSeconds3
periodSeconds10
livenessProbe
tcpSocket
porthealth-check
initialDelaySeconds15
failureThreshold2
timeoutSeconds3
periodSeconds20
To apply the manifest, execute the following command.
xxxxxxxxxx
kubectl apply -f deploy.yaml
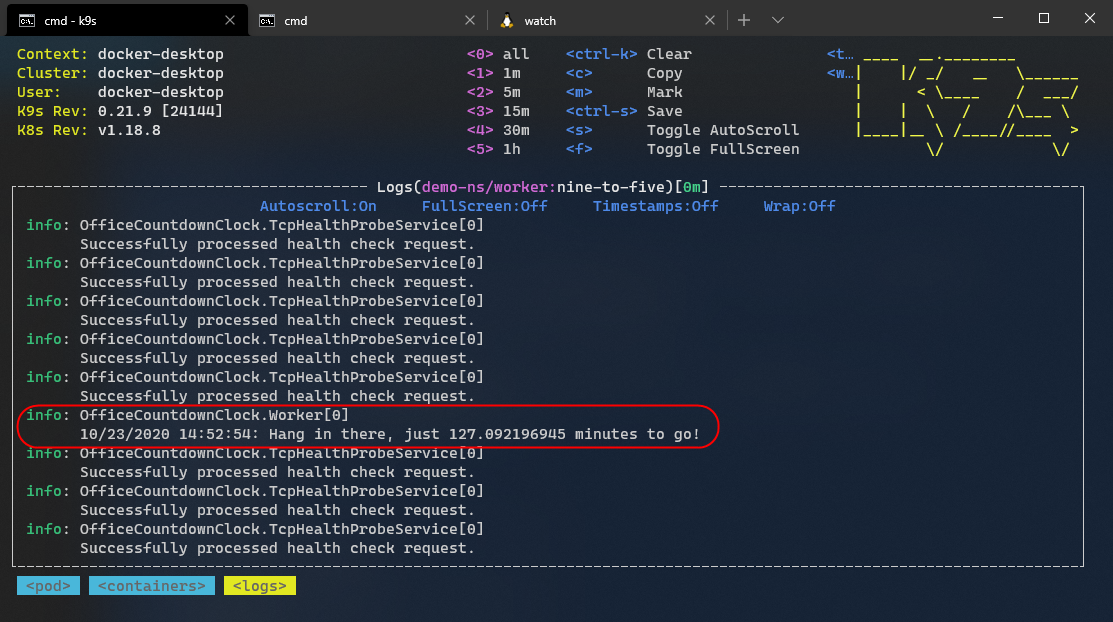
Following is a screenshot of the background service in action. I use the K9S CLI for viewing the cluster statistics and logs.

In the previous output, you can also see the log events generated on the execution of TCP health probes. Execute the following shell commands to monitor the Kubernetes events generated in the demo-ns namespace continuously.
xxxxxxxxxx
watch -n .5 kubectl get events -n demo-ns
The following screenshot presents the output generated on the execution of the previous command. You wouldn't see any error events yet because the service works as expected and the health of the service is good.

Let's now update the custom health check to change the health state of the service and inspect the logs again.
Simulating Health Check Failure
Navigate to the CustomHealthCheck class and update the code as follows to simulate an unhealthy state of service.
xxxxxxxxxx
public Task<HealthCheckResult> CheckHealthAsync(HealthCheckContext context,
CancellationToken cancellationToken = new CancellationToken())
{
return Task.FromResult(new HealthCheckResult(HealthStatus.Unhealthy));
}
Let's create another docker image of the application by executing the following command.
xxxxxxxxxx
docker build . -t nine-to-five:2.0.0
Use the following command to redeploy the existing pod with the new container image that you just created.
xxxxxxxxxx
cat <<EOF | kubectl apply -f -
apiVersion: v1
kind: Pod
metadata:
name: worker
namespace: demo-ns
labels:
app: nine-to-five
spec:
containers:
- name: nine-to-five
image: nine-to-five:2.0.0
ports:
- name: health-check
containerPort: 5000
hostPort: 5000
readinessProbe:
tcpSocket:
port: health-check
initialDelaySeconds: 5
failureThreshold: 2
timeoutSeconds: 3
periodSeconds: 10
livenessProbe:
tcpSocket:
port: health-check
initialDelaySeconds: 15
failureThreshold: 2
timeoutSeconds: 3
periodSeconds: 20
EOF
Let's revisit the Kubernetes events that we are monitoring with the watch command.

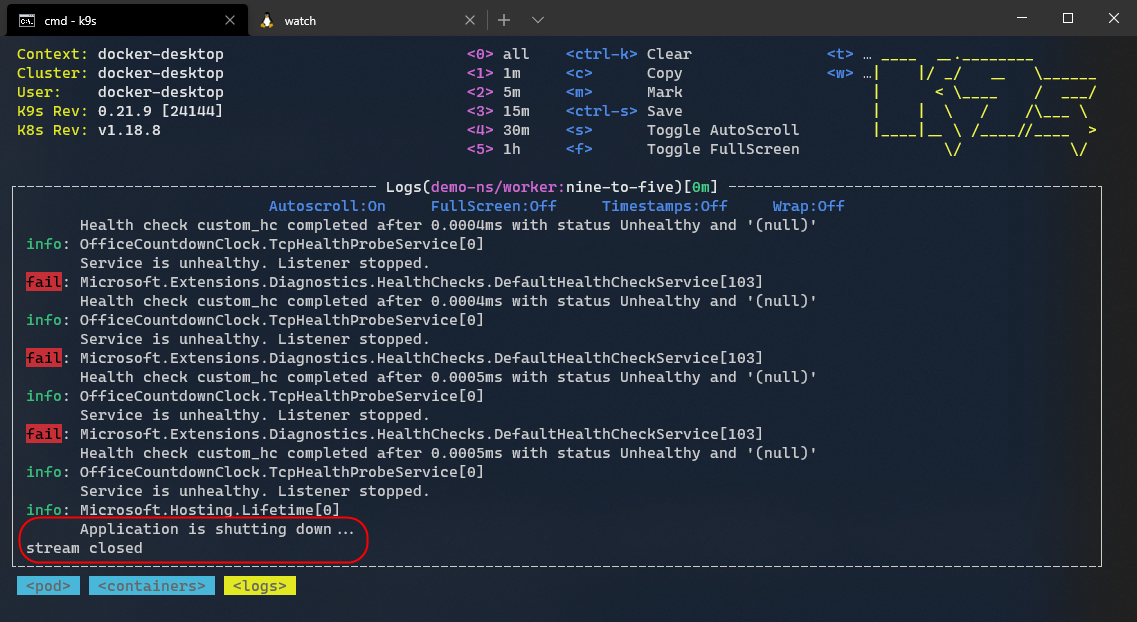
In the previous output, you can see that Kubernetes determined that the service is unhealthy because of repeated probe failure. Let's check the state of the application by inspecting its logs now.

You can view the logs generated by failed health checks. Because of the repeated failed probes, Kubernetes restarted the pod, and hence our application's final log statement indicates the shutdown of the application.
Conclusion
In this post, we saw how we could add custom health checks to ASP.NET Core applications. We customized the default ASP.NET Core health checks to respond to probes over TCP.
Finally, we configured the liveness and readiness probe settings for our application and deployed it to a local Kubernetes cluster.
Published at DZone with permission of Rahul Rai, DZone MVB. See the original article here.
Opinions expressed by DZone contributors are their own.

Comments