13-Step Guide to Performance Testing in Kubernetes
Take a look at this demonstration of performance testing on Kubernetes using JMeter and Docker by developing, storing, and analyzing a Spring Boot app.
Join the DZone community and get the full member experience.
Join For Free
Kubernetes is an open-source container orchestrator built by Google that helps run, manage, and scale containerized applications on the cloud. All the major cloud providers (Google Cloud, AWS, Azure, etc.) have managed Kubernetes platforms. In this article, we will discuss how to deploy a Spring Boot-based microservice with Google Cloud and undertake performance testing.
You may also enjoy Linode's Beginner's Guide to Kubernetes.
Prerequisites
Maven, a build automation tool provided by Apache
Docker hub account
Install gcloud-sdk
kubectl, the command line interface for running commands against Kubernetes
Version control system Git
Step 1: Setting Up a GCP account
Follow this link and login to your Google Cloud Platform account. If this is your first time on GCP, you can get a $300 free trial. You will have to provide your credit card details, but you will not be charged unless you enable billing.
Connect to Your GCP Account Remotely
In your terminal, execute sudo gcloud init. This will prompt you to pick a configuration. Select the number corresponding to Create a new configuration, and give it a name as you wish. Upon providing a name, it will prompt you to choose the account you would like to use to perform operations for this configuration. Select Log in with a new account. Follow the URL generated, and log into your respective GCP account.
Selecting/Creating a project
If you already have a project, you can choose to continue with it. If you do not have one or would like to perform the tests in a separate project, go ahead and create one.
In the Menu bar, click on Select-project. If this is your first time using GCP, this might sometimes say "My-First-Project." Select New-project from the pop-up window. Give your project a name and click Create.


Step 2: Creating a Kubernetes cluster
A cluster is the foundation of Google Kubernetes Engine. All containerized applications run on top of a cluster. Let’s now create a cluster for our testing.
In Navigation Menu > Kubernetes Engine > Clusters
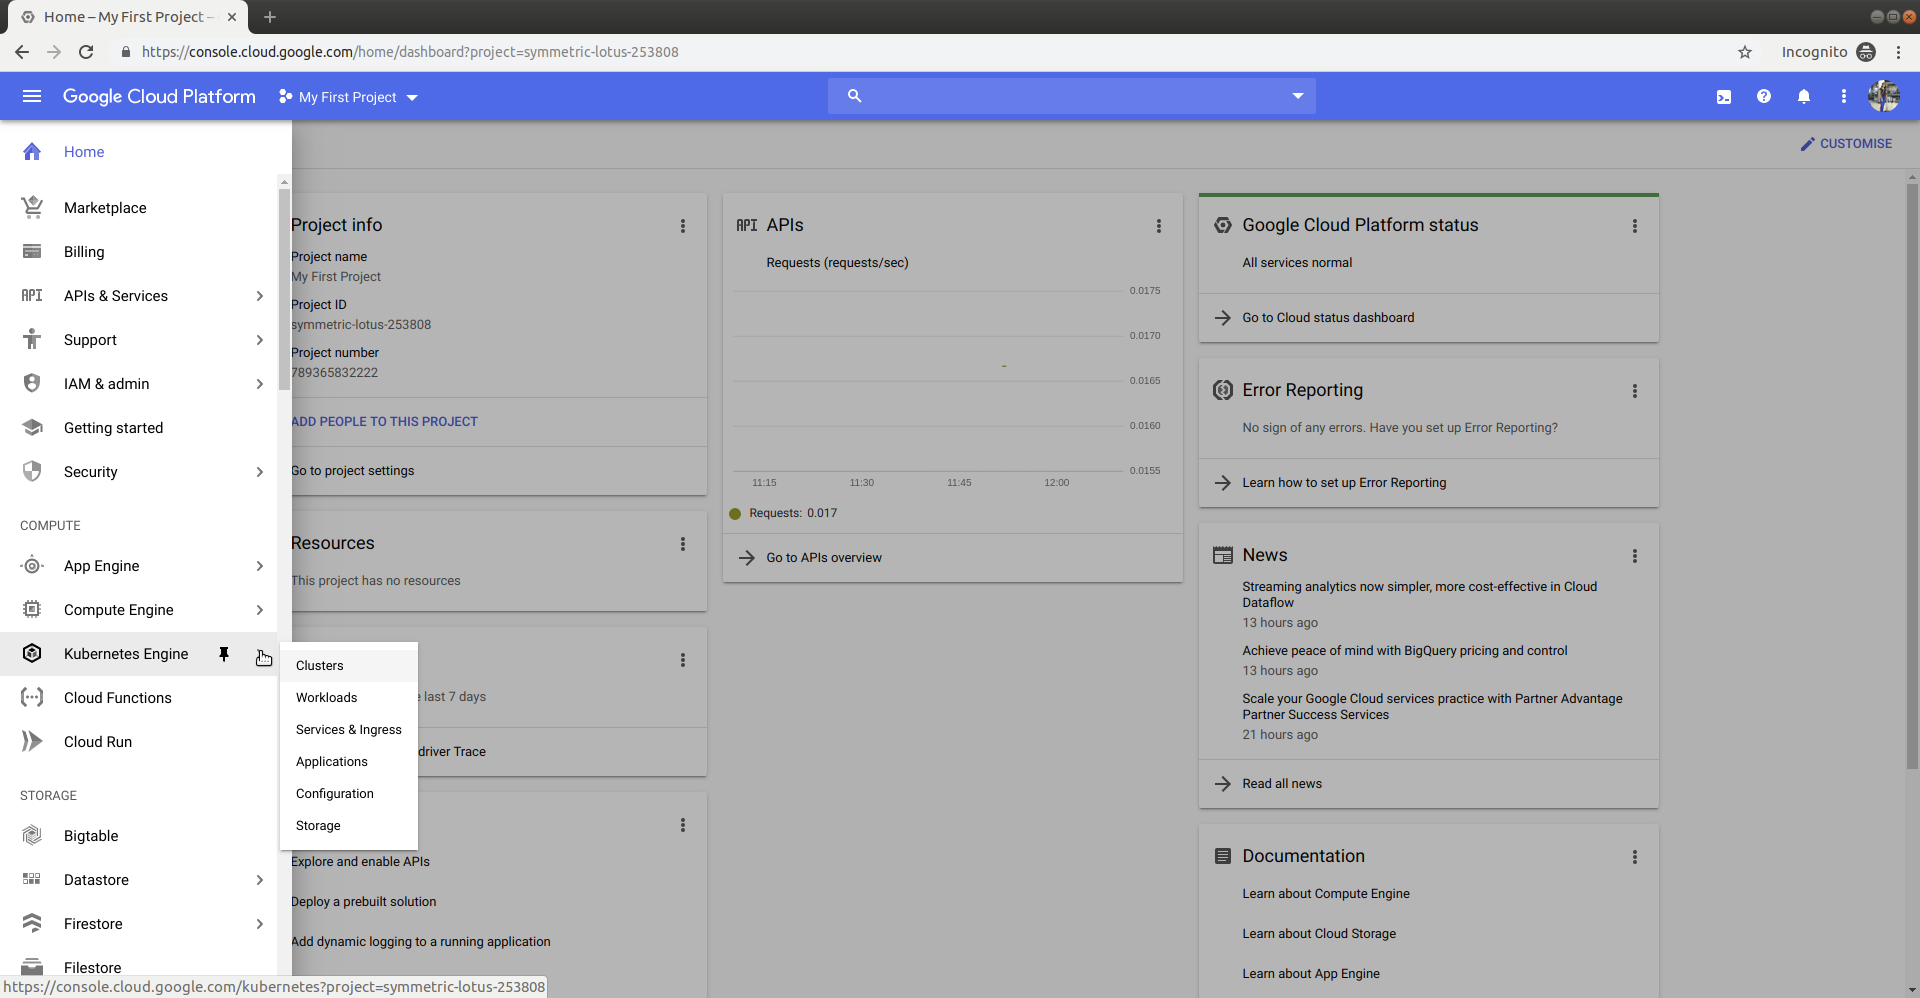
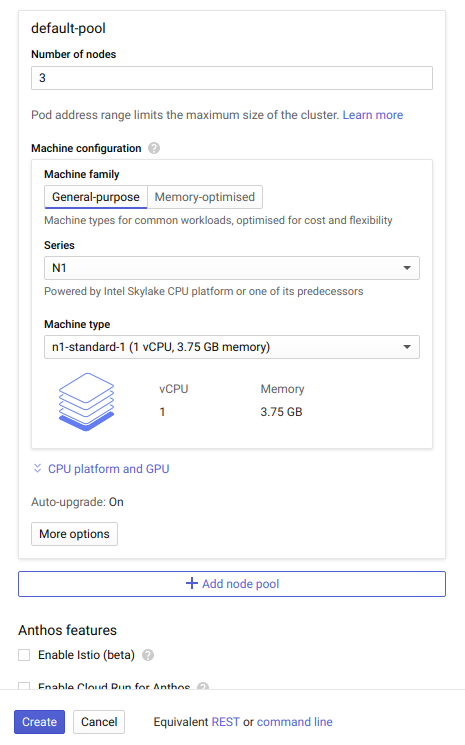
Click on Create Cluster. Choose the Standard cluster template or choose an appropriate template depending on your workload. Give a name for your cluster, like "performance-testing." Select the us-central1-a as the zone. In the default pool configuration, under Machine type select n1-standard-1. This will assign each node 1 vCPU and 3.75GB RAM.
Configure the kubectl command-line access by running the following command:
#Commandline access to the Kuberenetes Cluster
gcloud container clusters get-credentials [name of the cluster] --zone [selected zone] --project [name of the project]
#Example
clusters get-credentials performance-testing --zone us-central1-a --project springboot-performance-test
Now that we have done the setup, let’s move on to how to deploy microservices in Kubernetes.
Step 3: Testing the Application and Creating the Jar file
In this experiment, we will use a simple prime web service written in Spring Boot, which returns true or false for the number we provide (depending on whether the number is prime or not) as the query parameter. Let us now discuss how to deploy this web service on Kubernetes. The GitHub repo for the Spring boot based web service which we test can be found here.
You can test your own application or continue with the sample test application. To continue, clone the GitHub repository. To build an executable jar, navigate the directory where pom.xml is located and execute mvn clean install. This will generate a jar file in the target directory. To test whether the application has the desired behavior, send a request to localhost:9000/prime?number=90 through your browser. This should show up false, as number 90 is not a prime number. Alternatively, you can use the curl command to verify the functionality.
xxxxxxxxxx
#Clone the repository
git clone https://github.com/anushiya-thevapalan/springboot-test
#Navigate to the directory where pom.xml file is located.
cd springboot-test/complete
#Build the project
mvn clean install
#Run the application
java -jar gs-actuator-service-0.1.0.jar
#Verify the application is running.
curl localhost:9000/prime?number=90.
Now that we have verified the functionality of the application, let's continue to deploying the application in Kubernetes.
Step 4: Creating a Docker Image for The Application
Docker is an open-source platform designed to make it easier to create, deploy, and run applications by using containers. Containers allow developers to package up and ship an application with all requirements such as libraries and dependencies. Docker builds images automatically by reading the instructions from a Dockerfile. A Dockerfile is a text document that contains all the commands a user could call on the command line to assemble an image.
FROM java:8
WORKDIR /home
ADD gs-actuator-service-0.1.0.jar gs-actuator-service-0.1.0.jar
EXPOSE 9000
CMD java -jar gs-actuator-service-0.1.0.jar
FROM - A Dockerfile must begin with a
FROMinstruction. This specifies the underlying OS architecture used to build the image. Some form of the base image is required to get started with building an image. As our application is based on Java version 8, we usejava:8as the base image.WORKDIR - This command is similar to the change directory (
cd) command executed in the terminal. It sets the working directory for any command that follows it in the Dockerfile. (Depending on your requirement you can change the working directory).ADD -
ADDcommand lets you copy files from a specific location into a Docker image. As we require the built jar to run the application, we add it to the Docker imageEXPOSE - The
EXPOSEinstruction informs Docker that the container listens on the specified network ports at runtime. Our application is running in port 9000, therefore, we specify it.CMD - The
CMDcommand provide defaults for executing a container. The command we provide here runs the built application.
Now that we understand the Dockerfile, let's proceed with creating the Docker image.
xxxxxxxxxx
#Build docker image
docker build --no-cache -t [DockerHub account name]/[name of the Docker image] [location of the Dockerfile]
#Example:
docker build --no-cache -t anushiya/app .
Note: There is a dot at the end of the command. The dot at the end of the command refers to the current directory. After building the Docker image, push it to Docker Hub. Docker Hub is the largest cloud-based repository for container images. This repo is used to find and share container images among users.
If you have not used Docker Hub before, follow the link to create a user account. After creating one, log in remotely to your Docker Hub account and then push your image. To login, execute docker login in your terminal and enter your username and password when prompted. Upon successful login, push your Docker image to Docker Hub.
xxxxxxxxxx
#remote login to Docker hub
docker login
#push the docker image to Docker hub
docker push [Docker Hub account name]/[name of the deployment]:[version]
#Example:
docker push anushiya/app:latest docker push anushiya/app:v1
We have successfully built the Docker image of our application and pushed it to Docker Hub. Now let's create the deployment in Kubernetes.
Step 5: Creating a Kubernetes Deployment for Application
In this step, we will describe how to deploy the Spring Boot application is Kubernetes. The desired state for the application is described in the deployment YAML file. The file is submitted to Kubernetes master and the master creates a deployment object. The deployment controller is responsible for maintaining the desired state described in the deployment YAML file. It executes routine tasks to ensure the desired state is maintained.
xxxxxxxxxx
#app.yaml
apiVersionapps/v1
kindDeployment
metadata
namespringboot-app
labels
appspringboot-app
spec
replicas1
selector
matchLabels
appspringboot-app
template
metadata
labels
appspringboot-app
spec
containers
namespringboot-app
imageanushiya/applatest
resources
limits
cpu"100m"
requests
cpu"100m"
ports
containerPort9000
In the above example,
A Deployment named springboot-app is created, indicated by the metadata: name field.
The Deployment creates one replicated Pod, indicated by the replicas field.
The Pod template, or spec: template field, indicates that its Pods are labeled app: springboot-app.
The Pod template's specification, or template: spec field, indicates that the Pods run one container, springboot-app, which runs the anushiya/app (Docker image built previously) Docker Hub image at the latest version.
In the Pod template's specification, resources: limits and resources: requests indicate the maximum and minimum resource allocation for the container.
The Deployment opens port 9000 for use by the Pods.
Apply the created YAML file to create the deployment.
xxxxxxxxxx
kubectl apply -f path/to/the/file
#Example
kubectl apply -f deployments/app/app.yaml
Kubernetes Service is an abstract way to expose an application running on a set of Pods as a network service. To make the deployed application accessible across the cluster, we are exposing it using a Service object.
xxxxxxxxxx
#app-svc.yaml
apiVersionv1
kindService
metadata
namespringboot-app-svc
spec
ports
nameprime-service
port80
targetPort9000
selector
appspringboot-app
typeNodePort
This specification creates a new Service object named “springboot-app-svc".
A Service can map any incoming port to a targetPort. In this case, port 9000 of the container is mapped to port 80.
The spec: selector specifies that the Pods labeled springboot-app are being served by the Service object.
The type: NodePort indicates the type of Service object.
Apply the Service YAML to create the Service object.
xxxxxxxxxx
kubectl apply -f path/to/the/file
#Example
kubectl apply -f deployments/app-svc.yaml
By sending a curl request, verify the functionality of the application.
xxxxxxxxxx
#To send a request, service IP address or name of the service can be used
curl springboot-app-svc:9000/prime?number=71
Step 6: Creating the Docker Image for JMeter
To test the performance of the Spring Boot app we use JMeter as the load testing client. To deploy the JMeter we need to first create a Docker image. The following is the Dockerfile for the JMeter. Note that we are installing Python as we use Python to process the performance data.
xxxxxxxxxx
FROM anushiya/jmeter-plugins:v1
ADD bash /home/kubernetes-performance/bash
ADD jar /home/kubernetes-performance/jar
ADD jmx /home/kubernetes-performance/jmx
ADD python /home/kubernetes-performance/python
WORKDIR /home/kubernetes-performance/bash
RUN chmod +x start_performance_test.sh
RUN apt-get update && apt-get install python3.5 -y
RUN apt-get install python-pip -y
RUN pip install numpy requests schedule
The base image anushiya/jmeter-plugins of version v1 is used. This image includes JMeter version 5.1 and its plugins.
Required files are added to the Docker container using ADD command.
- The WORKDIR is set to /home/kubernetes-performance/bash.
- Executing permission is set to the start_performance_test.sh script file.
- Python version 3.5 is installed using
apt-getcommand. - Required Python libraries are installed.
Let's now build the Docker image and push it to Docker Hub.
Note: The files added to the Docker image in the above Dockerfile require modifications if you are to perform the tests. We'll be discussing it in the following steps.
xxxxxxxxxx
#Build the Docker image
docker build --no-cache -t anushiya/perf-test:v1 .
#push the image to Docker Hub
docker push anushiya/perf-test:v1
Step 7: Creating Persistent Volumes to Store Performance Data
Results of the performance tests should be stored permanently. Here, we use host volume to store the test results. You can use Cloud Filestore or any other persistent storage volume for this purpose.
To get the details of the nodes in your Cluster, execute the below command.
xxxxxxxxxx
#Get the nodes
kubectl get nodes
#Output
NAME STATUS ROLES AGE VERSION
gke-performance-testing-default-pool-b6e4d476-78zn Ready <none> 11m v1.13.11-gke.14
gke-performance-testing-default-pool-b6e4d476-kfn8 Ready <none> 11m v1.13.11-gke.14
gke-performance-testing-default-pool-b6e4d476-n538 Ready <none> 11m v1.13.11-gke.14
To create a host volume, ssh into any of the above nodes.
xxxxxxxxxx
#ssh into a node
sudo gcloud beta compute --project "[name of the project]" ssh --zone "[zone]" "[name of the node]"
#example
sudo gcloud beta compute --project "performance-testing" ssh --zone "us-central1-a" "gke-performance-testing-default-pool-b6e4d476-78zn"
Create a directory to mount the data.
sudo mkdir /mnt/data/results
Now create a persistent volume.
xxxxxxxxxx
apiVersionv1
kindPersistentVolume
metadata
namepv-volume
labels
typelocal
spec
storageClassNamemanual
capacity
storage10Gi
accessModes
ReadWriteOnce
hostPath
path"/mnt/data/results"
Create a persistent volume claim.
x
apiVersionv1
kindPersistentVolumeClaim
metadata
namepv-claim
spec
storageClassNamemanual
accessModes
ReadWriteOnce
resources
requests
storage6Gi
After performing the tests, the results will be available in the mnt/data/results directory we created above.
Step 8: Creating the Performance Testing Job and Deploying It
Using the Docker image we built above for the JMeter, we will create a job to perform the load testing.
The main function of a job is to create one or more pod and track the success of the pods. They ensure that the specified number of pods run to completion. When a specified number of successful pods is completed, then the job is considered complete.
x
apiVersionbatch/v1
kindJob
metadata
nameperf-test
spec
template
spec
containers
nameperf-test
imageanushiya/k8-performance-testv1
imagePullPolicyAlways
command"bash" "start_performance_test.sh"
volumeMounts
mountPath"/home/jmeter/results"
namepv-storage
restartPolicyNever
volumes
namepv-storage
persistentVolumeClaim
claimNamepv-claim
backoffLimit4
A job named "perf-test" is created, indicated by the metadata: name field.
The Job template's specification, or template: spec field, indicates that the Job runs one container, perf-test, which runs the anushiya/perf-test:v1 image.
The volumeMounts: mountPath specifies the mounted volume.
The nodeSelector selects the node in which the Job will run. Execute the
kubectl get nodes --show-labelscommand to get the labels of each node. In the list of labels, find the one with the key kubernetes.io/hostname and replace the value in the above YAML.The spec: volumes indicates the volume claim we use.
Apply the YAML file to initiate the performance test.
xxxxxxxxxx
kubectl apply -f deployments/perf-test.yaml
Step 9: Collecting Metrics from Stackdriver Monitoring API
Monitoring the stats during a performance test is important as it allows us to get an understanding of the behavior of various parameters (e.g. resource utilization) during the performance test. In this article, we use the Stackdriver Monitoring API to get the performance statistics. (Note: Metrics will be collected when running performance tests. These are pre-steps to be performed).
Firstly, Stackdriver Monitoring API must be enabled for us to use it. To enable, click on Navigation Menu > APIs & Services > Dashboard. Search for Stackdriver in the search bar. If the API is not enabled, click Enable.
To send API requests while running our tests, we require the following credentials.
API key - An application programming interface key (API key) is a unique identifier used to authenticate a user, developer, or calling program to an API.
OAuth 2.0 access token - The access token represents the authorization of a specific application to access specific parts of a user’s data.
Generate API Key
To generate the API key, in the Navigation Menu > APIs & Services > Credentials. Click on Create credentials. Select API key from the drop-down menu. This will generate the API key.

Generate OAuth2.0 Access Token
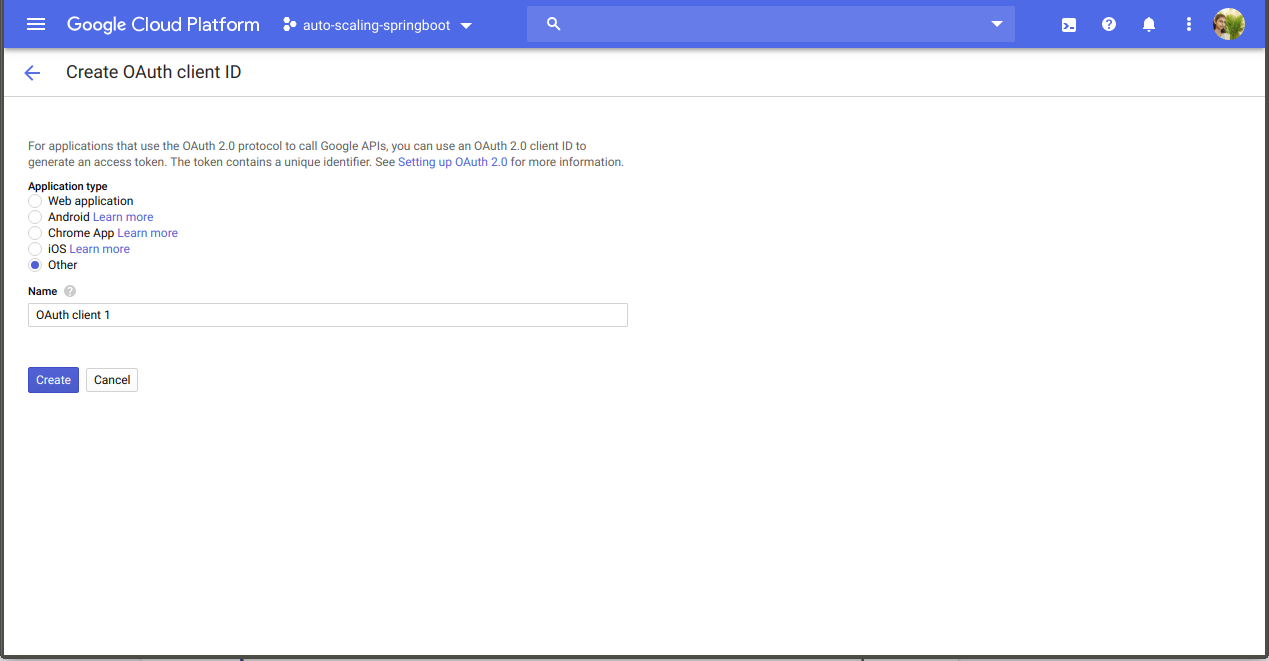
To create the Access Token, first, we require Client ID and Client Secret. In the Navigation Menu > APIs & Services > Credentials. Click on Create credentials. Select OAuth client ID from the drop-down menu. Select Other for the Application type. Give the desired Name for the client ID (e.g., OAuth client 1) and click Create.
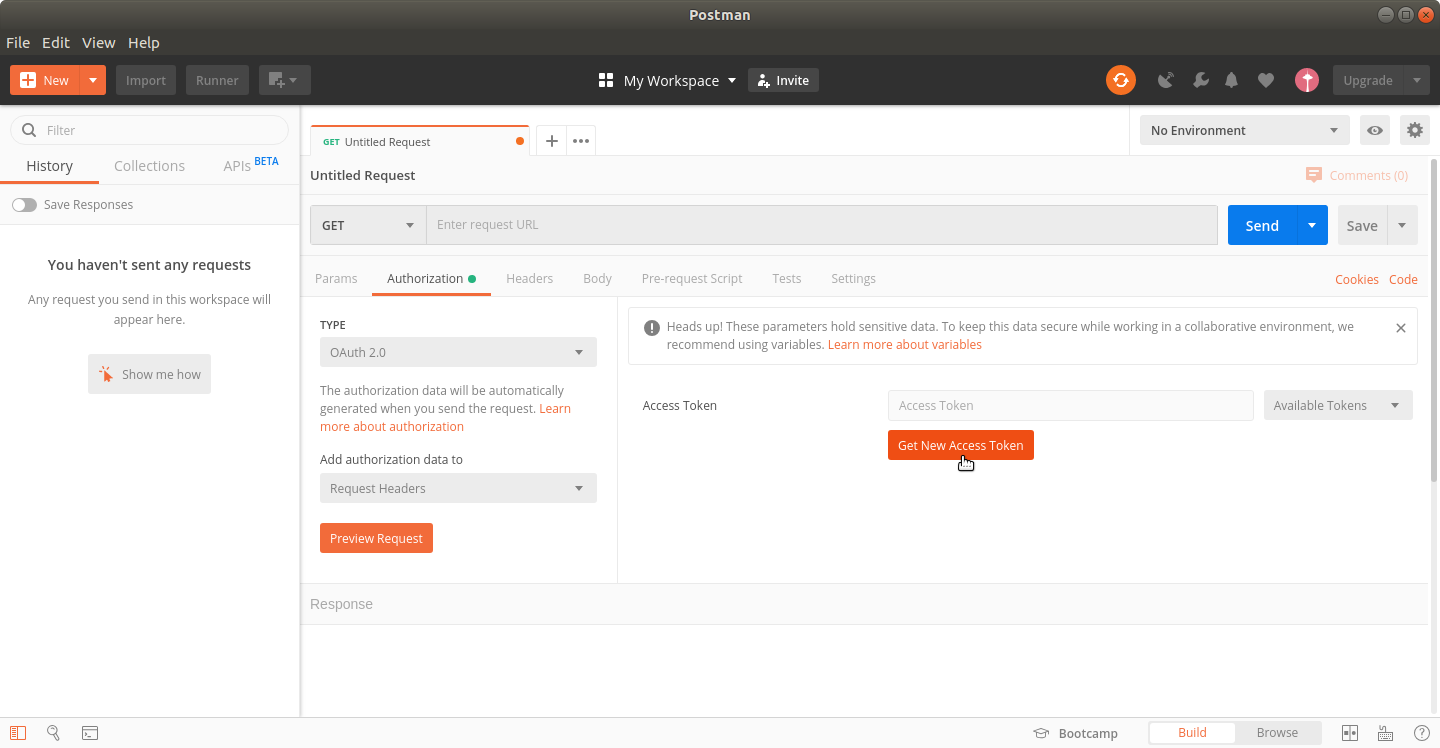
Now that we have created the Client ID and Client secret, we will use them to create the Access token. You can use many ways to create the Access token. We are using Postman to create one.
Launch Postman. Create a new request by clicking on the (+) icon. Select the Authorization tab. In the Authorization tab, select OAuth2.0 from the "Type" dropdown menu. Click on Get New Access Token.
Fill the popup dialogue box with the following details and click Request Token.
Token Name: gcp_auth_token (you can give any name you wish)
Grant Type: Authorization code
Auth URL: https://accounts.google.com/o/oauth2/auth
Access Token URL: https://oauth2.googleapis.com/token
Client ID: [Client ID generated in the above steps]
Client Secret: [Client secret generated in the above steps]
Scope: Add the following URLs separated by space
https://www.googleapis.com/auth/cloud-platform
https://www.googleapis.com/auth/monitoring
https://www.googleapis.com/auth/monitoring.read
Client Authentication: Send as Basic Auth Header
You will be prompted to log in to your Google account. Provide login credentials. Access Token will be returned upon authenticating.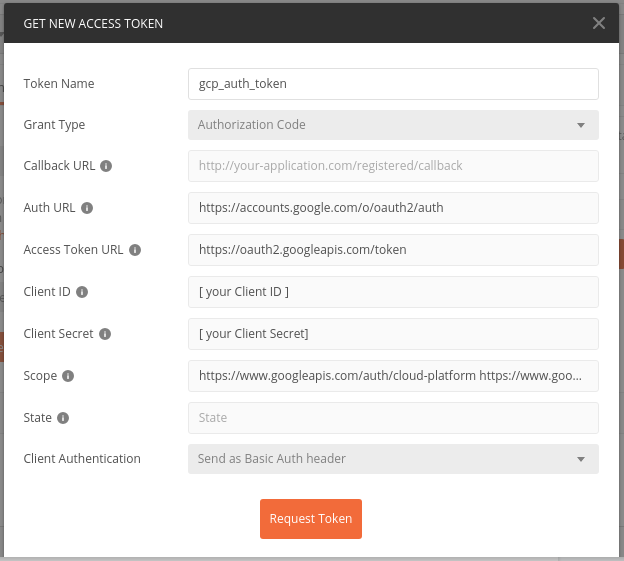
Step 10: Metrics Collection Script
The following Python script file is responsible for collecting metrics from Stackdriver Monitoring API. This script gets called at the end of tests run.
We first import all the required libraries.
Next, we import all the Python functions from other Python files. For example,
from container_cpu_utilization_stats import * — Imports all the Python functions from container_cpu_utilization_stats.py file
Variables start_time, end_time, andsize are assigned with parameters received when the Python file is called. These are called system arguments. The metrics collection period is the time between start_time and end_time.
Let’s now try to understand thequery_metrics()functionsBoth start_time and end_time are URL percentage encoded. This encoding is required to define the URL to send the API request.
The container_metrics_list contains the list of metrics that we plan to monitor and collect. Based on your requirement, you can add any number of metrics to this list, as you wish. The complete list of GCP metrics can be found here.
In order to send the API request and collect the metrics, we require API key and Access token. We have generated both of them in the above steps.
Replace the [ACCESS_TOKEN] with the Access Token you generated. Also at the end of the URL, replace the [API_KEY] with the generated API key.We send an API request using the requests library and record the response.
For each metric in the container_metrics_list, we perform the API request and log the response.
The JSON response is huge, and we do not require all the details on it. Therefore, we process the JSON file to extract only the required information. (You can find all these files in the repository).
Step 11 : Preparing Performance Testing Scripts
Creating JMX
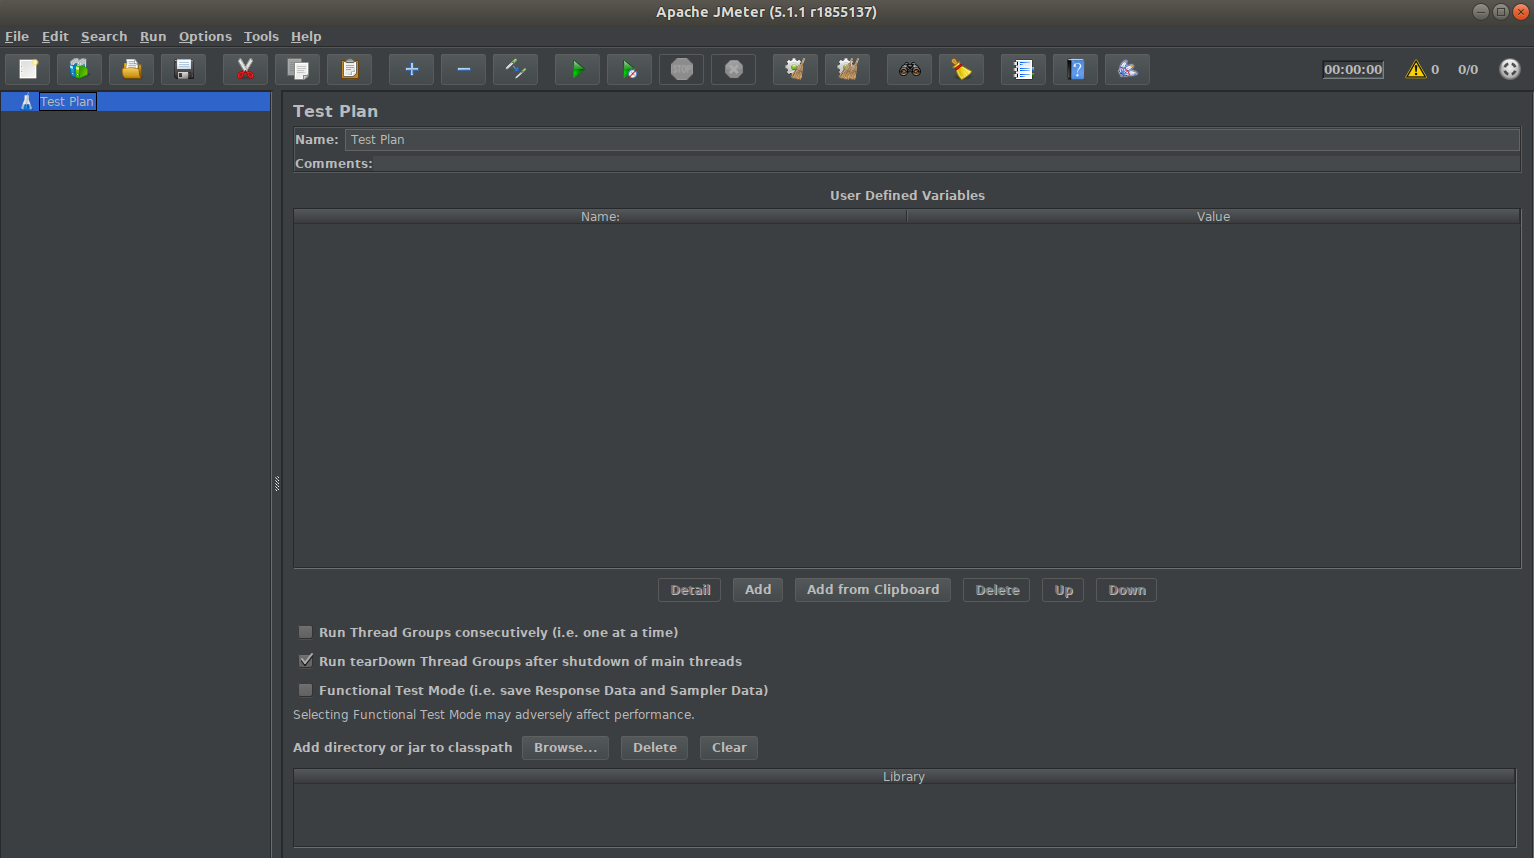
Open JMeter
![Open JMeter]()
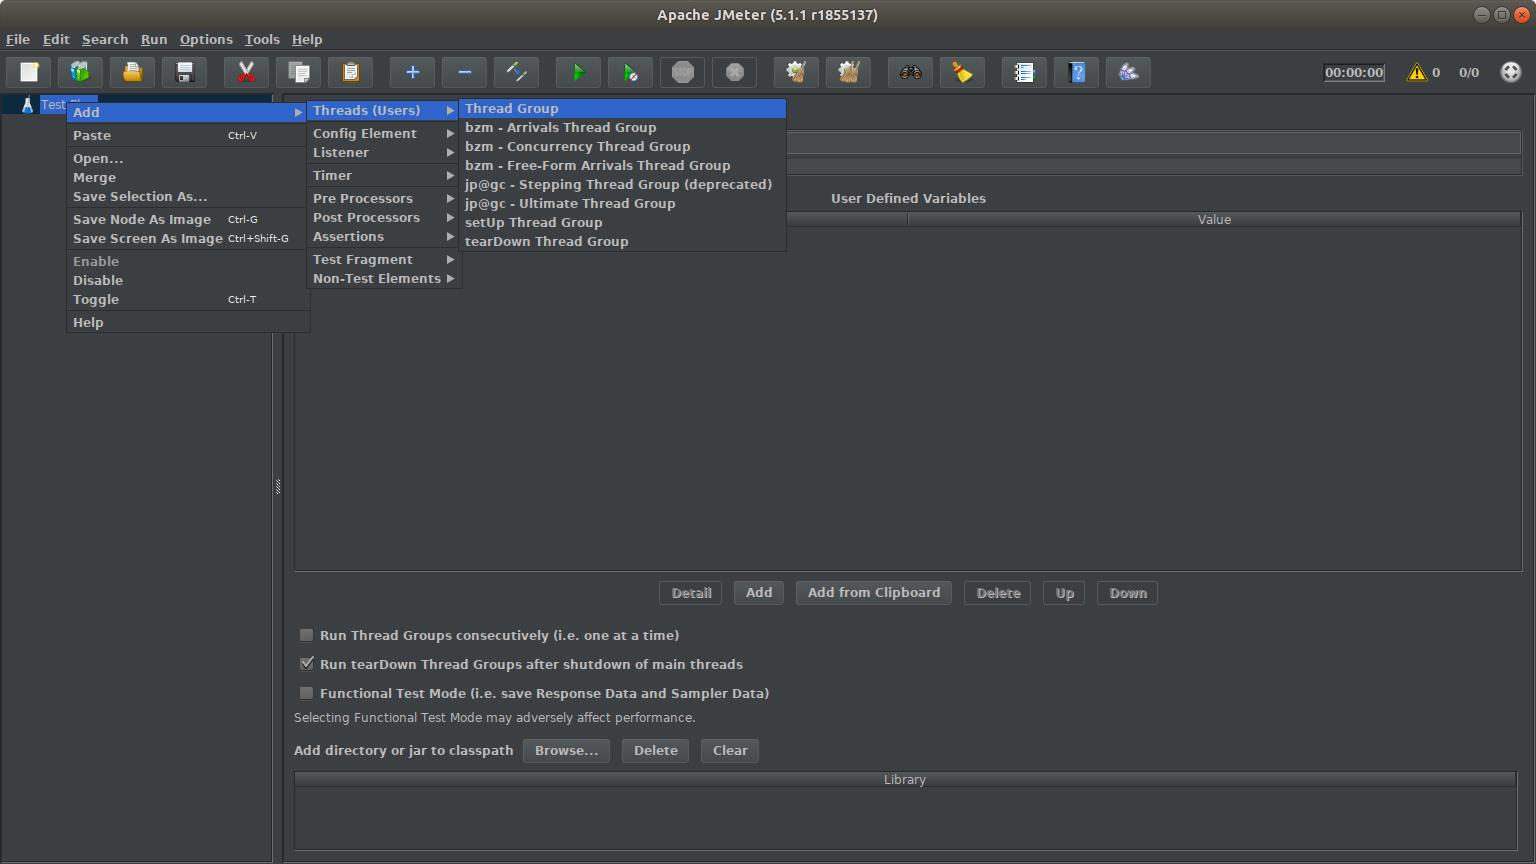
Open JMeter Right click on Test Plan > Threads (Users) > Thread Group
![Thread group]()
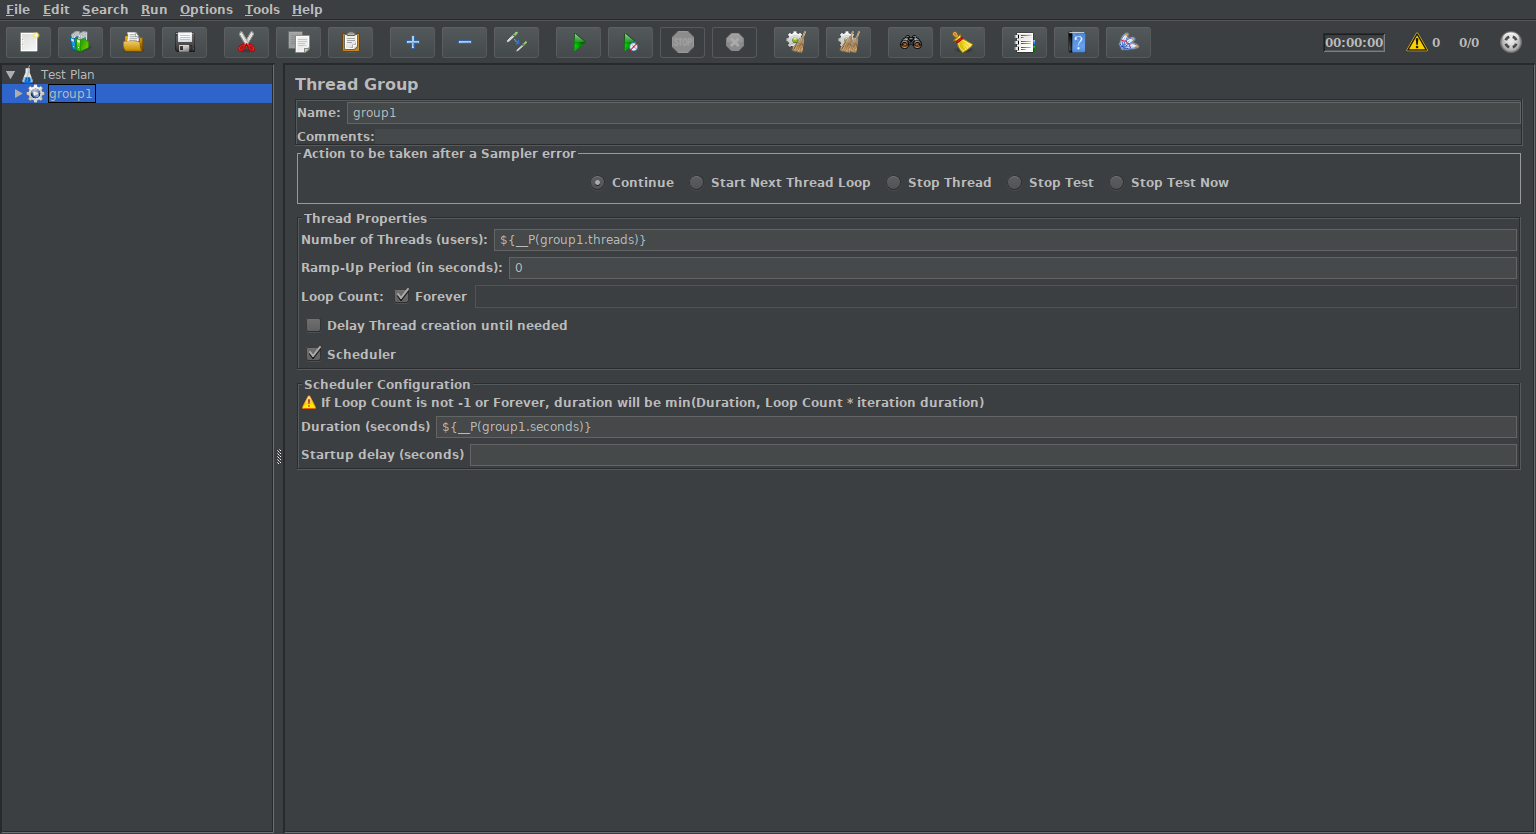
Thread group Fill the dialog box with following parameters
Name: group1
Number of Threads (users): ${__P(group1.threads)}
Duration (seconds): ${__P(group1.seconds)}
![Configuration]()
Configuration
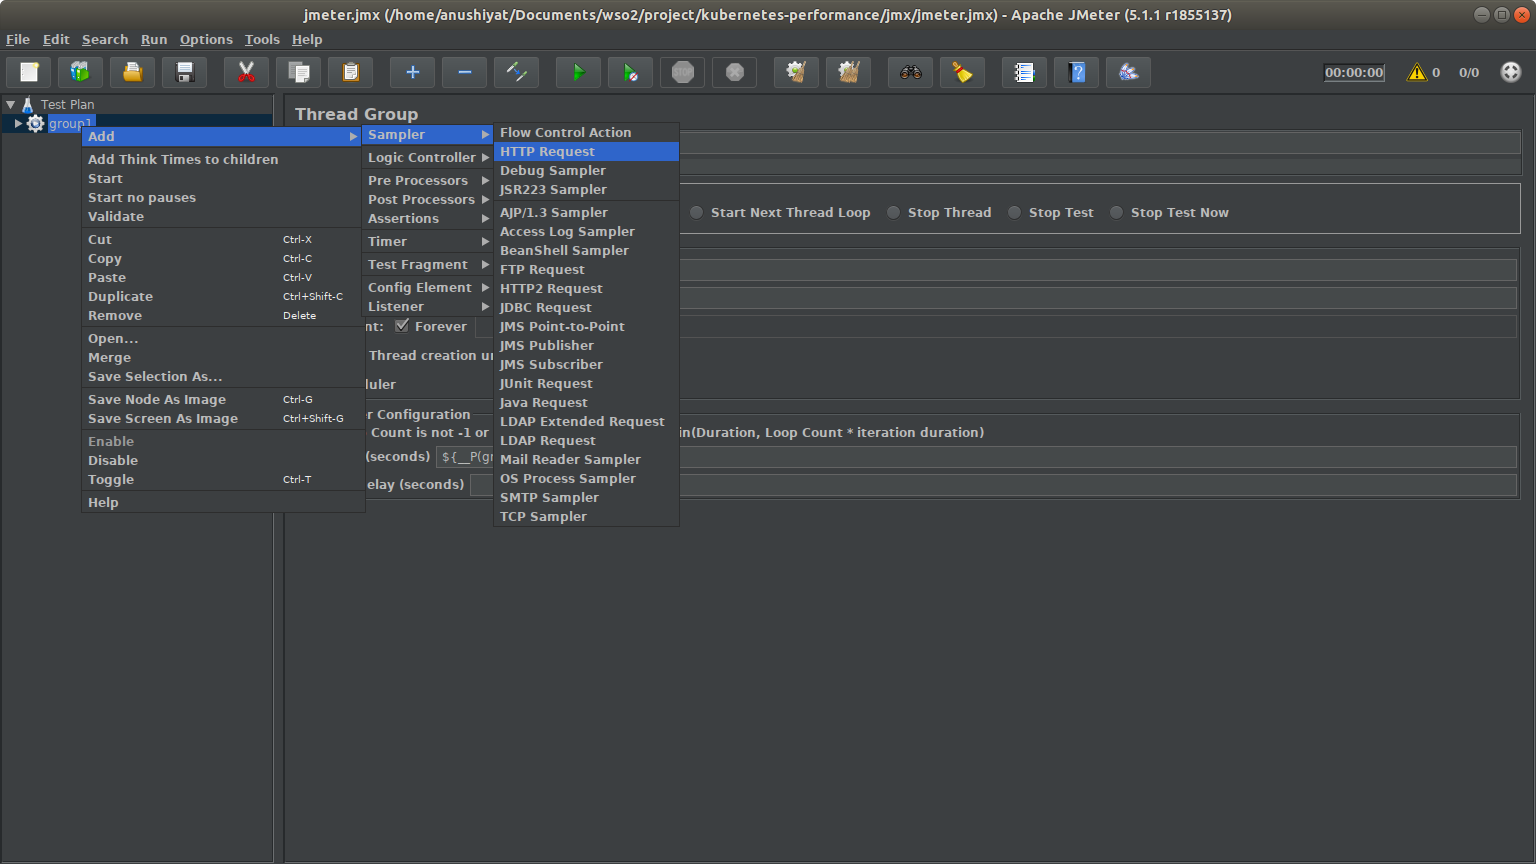
Right click on group1 > Add > Sampler > HTTP Request
![HTTP Request]()
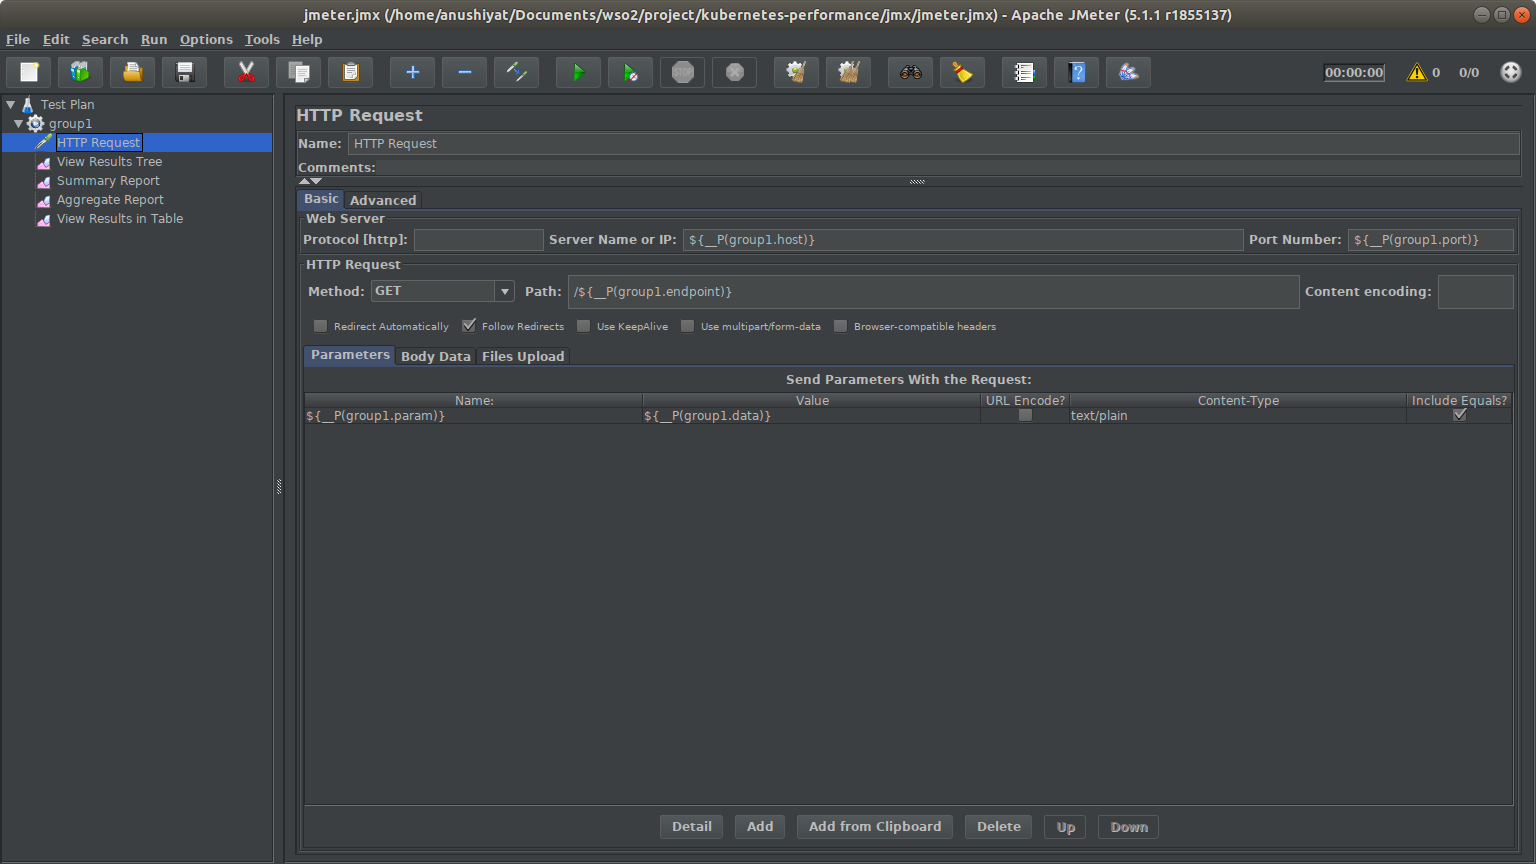
HTTP Request Fill the dialog box with following parameters:
Name: HTTP Request
Server name or IP: ${__P(group1.host)}
Port number: ${__P(group1.port)}
Method: GET
Path: /${__P(group1.endpoint)}
Click Add at the bottom of the window
Name: ${__P(group1.param)}
Value: ${__P(group1.data)}
Content-Type: text/plain
Check Include Equals
Save the file as jmeter.jmx
Step 12: Automating the Performance Tests
When running performance tests, we need to run these tests for a range of workload scenarios (e.g. concurrency levels, heap sizes, message sizes, etc.). Running the tests manually for each of these scenarios is time-consuming and likely to cause errors. Therefore it is important to automate the performance tests prior to executing them. We automate our performance tests using a shell script: start_performance_test.sh. Let us now explain the main functionality of this script.
First, we define the backend host IP address. This is the IP address of the prime service deployed (i.e. the Spring Boot application which we deployed above). You can either use the name of the service i.e. spring-boot-app-svc or give the IP address.
Then we initialize the test duration and warm up time. run_time_length_seconds is the total time the performance test is performed. As the name suggests, this should be given in seconds.
The paths of the required directories and file names are defined.
Then we specify the configurations on which we perform the tests. We did tests with two different prime numbers (521, 100003) for different concurrency (1, 10, 50, 100, 500).
To log the test results, separate directories are created. The file is named with the configurations set, to make it easily identifiable.
The basic command to run a JMX file is as follows.
xxxxxxxxxx
jmeter -n -t ${jmeter_jmx_file_root}/jmeter.jmx -l ${jtl_report_location}/results.jtl
-n : It instructs JMeter to run in non-gui mode-t : Name of JMX file that contains the Test Plan-l : Name of JTL (JMeter text logs) file to log results
The rest of the parameters that start with -Jgroup1 are passed to the JMX file which we created above. We have looked at these parameters when we created the JMX file.
The initial n minutes of the jtls collected by the JMeter is removed using the JTL splitter developed by WSO2. This data is removed as Java does JIT (Just In Time) compilation. To get stable performance results, initial results are removed
Next, we process the test results collected by JMeter using a Python script and log the summary to a CSV file.
Finally, we call the Python script responsible for collecting and processing metrics from Stackdriver Monitoring API.
Step 13: Analysis of Performance Results
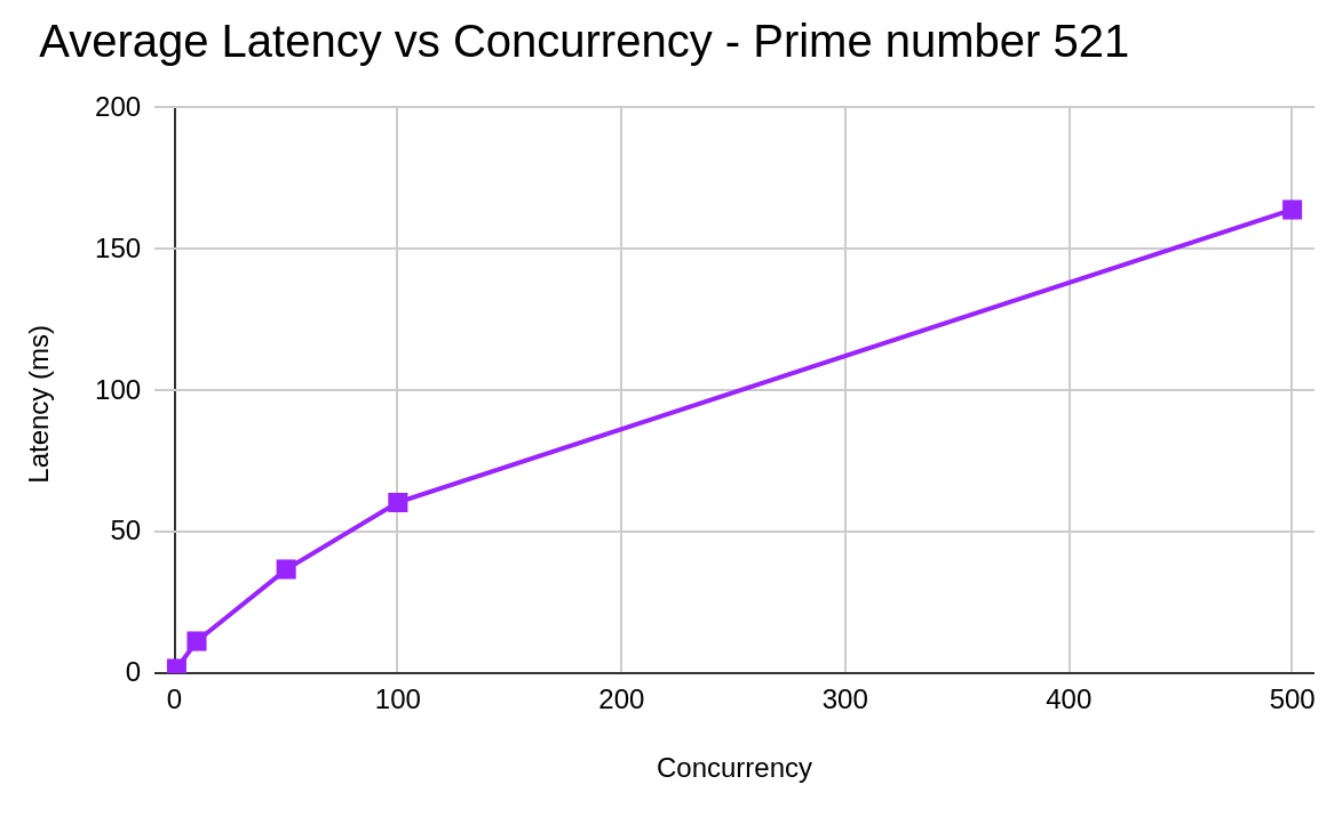
The following figures show the behavior of the TPS vs. Concurrency and Average latency vs. Concurrency for the prime number 521.
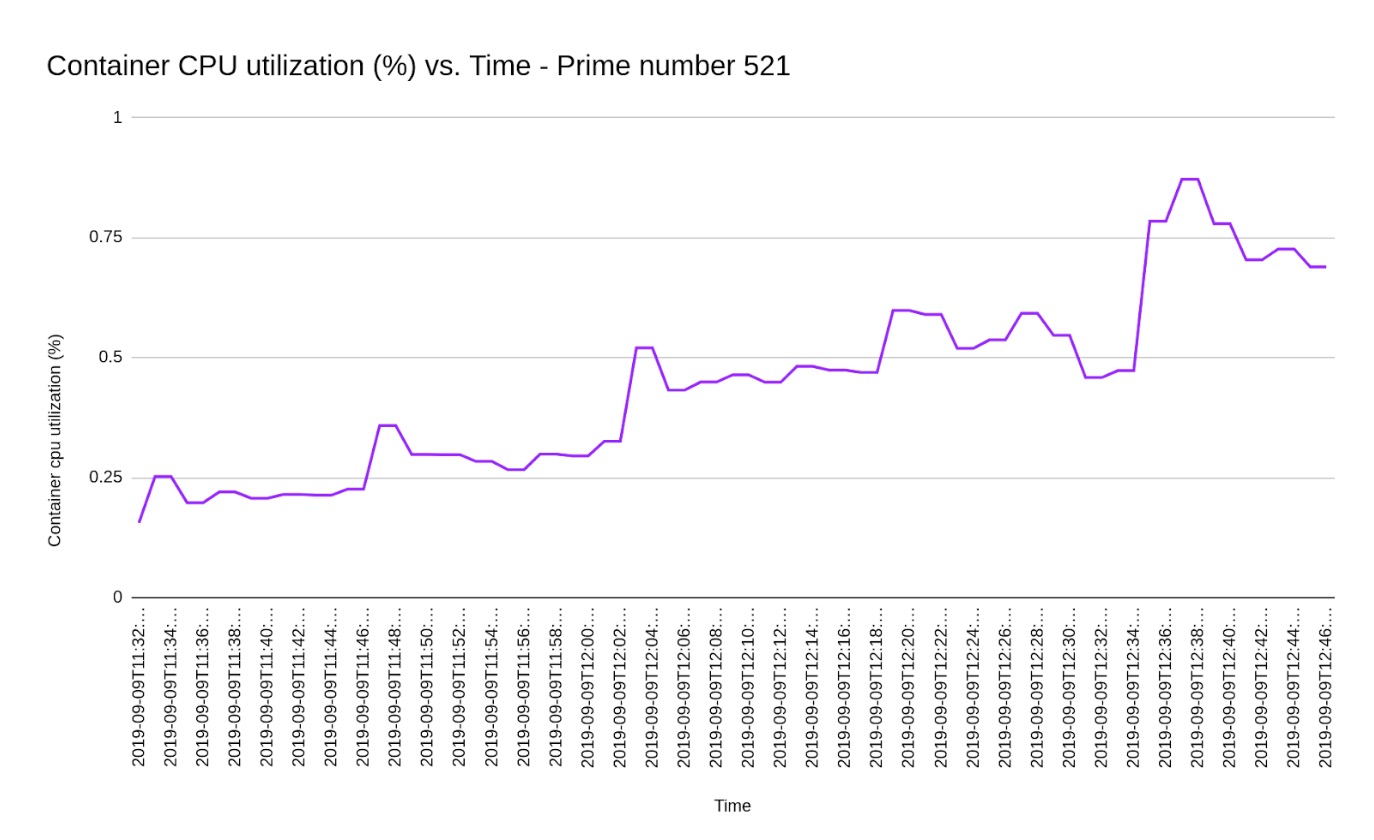
Let's now have a look at the metrics we collected from Stackdriver Monitoring API. Though we collected a list of metrics, let’s analyze the CPU utilization metric. The image below shows how CPU utilization varies with time.
Further Reading
Spring Boot Actuator: A Complete Guide
Developing A Spring Boot Application for Kubernetes Cluster (Part 1)
Opinions expressed by DZone contributors are their own.
Comments