Monitoring Microservices with Spring Cloud Sleuth, Elastic Stack, and Zipkin
This article from our new Performance Guide shows you how to monitor and isolate microservices using some third-party tools.
Join the DZone community and get the full member experience.
Join For FreeOne of the most frequently mentioned challenges related to migration to microservices-based architecture is monitoring. Each microservice should be run in an environment isolated from the other microservices, so they do not share any resources like data sources or log files between them.
However, the essential requirement for microservices-based architecture is that it is relatively easy to access the call history, including the ability to look through the request propagation between multiple microservices. Grepping the logs is not the right solution for that problem. There are some helpful third-party tools that can be used when creating microservices using such frameworks like Spring Boot and Spring Cloud libraries.
Tools
Spring Cloud Sleuth. A library available as a part of the Spring Cloud project. It lets you track the progress of subsequent microservices by adding the appropriate headers to the HTTP requests. The library is based on the MDC (Mapped Diagnostic Context) concept, where you can easily extract values put to context and display them in the logs.
Zipkin. A distributed tracing system that helps gather timing data for every request propagated between independent services. It has a simple management console where we can find a visualization of the time statistics generated by subsequent services.
Elastic Stack (ELK). Elasticsearch, Logstash, and Kibana - three different tools usually used together. They are used for searching, analyzing, and visualizing log data in real-time.
Many of you have probably heard about Elasticsearch and Kibana, even if you haven't done anything with Java or microservices before. For example, if you take look at Docker Hub, you will find the projects using the above tools among the most popular images. In our example, we will just use those images. Thanks to Docker images we will easily setup the full Elastic Stack environment on the local machine. Let's begin with running the container with Elasticsearch.
One of the most frequently mentioned challenges related to migration to microservices-based architecture is monitoring. Each microservice should be run in an environment isolated from the other microservices, so they do not share any resources like data sources or log files with them.
However, the essential requirement for microservices-based architecture is that it is relatively easy to access the call history, including the ability to look through the request propagation between multiple microservices. Grepping the logs is not the right solution for that problem. There are some helpful third-party tools that can be used when creating microservices using such frameworks like Spring Boot and Spring Cloud libraries.
docker run - d - it--name es - p 9200: 9200 - p 9300: 9300 - e
"discovery.type=single-node" docker.elastic.co /
elasticsearch / elasticsearch: 6.1 .1
Running Elasticsearch in development mode is the most convenient way, because we don't have to provide any additional configuration. If you would like to launch it in production, the vm.max_map_count Linux kernel setting needs to be set to at least 262144. The procedure of modifying it is different depending on the OS platform. For Windows with Docker Toolbox, it must be set via docker-machine.
docker - machine ssh
sudo sysctl - w vm.max_map_count = 262144
Then, we run the Kibana containter and link it to the Elasticsearch.
docker run - d - it--name kibana--link es: elasticsearch - p 5601: 5601 docker.elastic.co / kibana / kibana: 6.1 .1At the end, we start Logstash with input and output declared. As an input, we declare TCP, which is compatible with LogstashTcpSocketAppender and used as a logging appender in our sample application. As an output, Elasticsearch has been declared. Each microservice will be indexed on its name with a micro prefix. There are many other input and output plugins available for Logstash which could be used and are listed here. Another input configuration method using RabbitMQ and Spring AMQPAppender is described in my post How to ship logs with Logstash, Elasticsearch, and RabbitMQ.
docker run - d - it--name logstash - p 5000: 5000 logstash - e
'input { tcp { port => 5000 codec => "json" } } output {
elasticsearch { hosts => ["192.168.99.100"] index =>
"micro-%{serviceName}"} }'
Microservices
Now, let's take a look on sample microservices. This post is a continuation of a post on my blog, about Creating microservices using Spring Cloud, Eureka, and Zuul. Architecture and exposed services are the same as in the previous sample. The source code is available on GitHub (branch logstash ). As I mentioned before, we will use the Logback library for sending log data to Logstash. In addition to the three Logback dependencies, we'll also add libraries for Zipkin integration and Spring Cloud Sleuth starter. Here's a fragment of the pom.xml for microservices:
<dependency>
    <groupId>org.springframework.cloud</groupId>
    <artifactId>spring-cloud-starter-sleuth</artifactId>
</dependency>
<dependency>
    <groupId>org.springframework.cloud</groupId>
    <artifactId>spring-cloud-sleuth-zipkin</artifactId>
</dependency>
<dependency>
    <groupId>net.logstash.logback</groupId>
    <artifactId>logstash-logback-encoder</artifactId>
    <version>4.9</version>
</dependency>
<dependency>
    <groupId>ch.qos.logback</groupId>
    <artifactId>logback-classic</artifactId>
    <version>1.2.3</version>
</dependency>
<dependency>
    <groupId>ch.qos.logback</groupId>
    <artifactId>logback-core</artifactId>
    <version>1.2.3</version>
</dependency>
There is also a Logback configuration file in the src/main/resources directory. Here's a logback.xml fragment. We can configure which logging fields are sent to Logstash by declaring tags like mdc, logLevel, message, etc. We are also appending a service name field for Elastic- search index creation.
<appender name="STASH" class="net.logstash.logbackappender.LogstashTcpSocketAppender">
    <destination>192.168.99.100:5000</destination>
    <encoder class="net.logstash.logback.encoder   LoggingEventCompositeJsonEncoder">
        <providers>
            <mdc />
            <context />
            <logLevel />
            <loggerName />
            <pattern>
                <pattern> { "serviceName": "account-service" } </pattern>
            </pattern>
            <threadName />
            <message />
            <logstashMarkers />
            <stackTrace /> </providers>
    </encoder>
</appender>
The configuration of Spring Cloud Sleuth is very simple. We only have to add the spring-cloud-starter-sleuth dependency to pom.xml and declare sampler @Bean . In the sample, I declared AlwaysSampler , which exports every span—but there is also another option, PercentageBasedSampler , which samples a fixed fraction of spans.
@Beanpublic AlwaysSampler defaultSampler() {
    return new AlwaysSampler();
}
Kibana
After starting ELK docker containers we need to run our microservices. There are five Spring Boot applications that need to be run:
discovery-serviceaccount-servicecustomer-servicegateway-servicezipkin-service
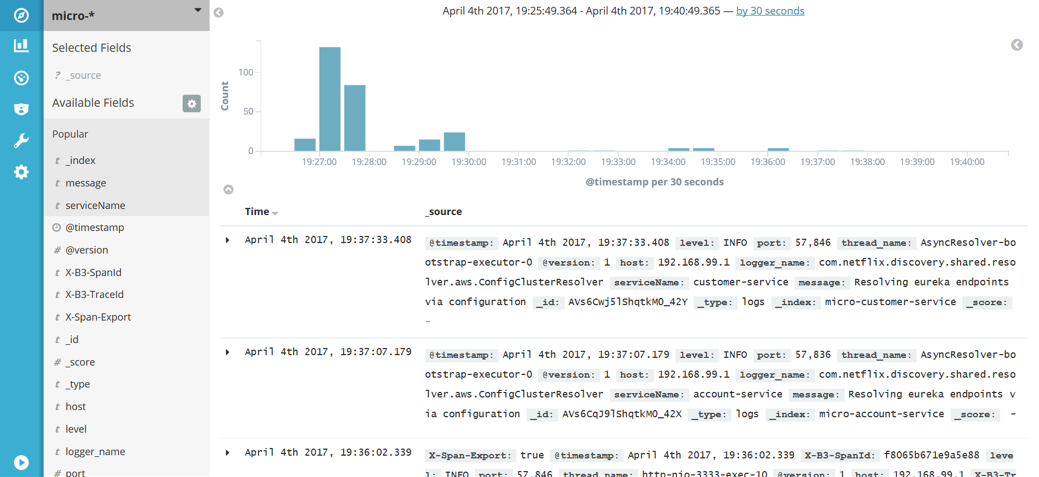
After launching all of them, we can try call some services for example, http://localhost:8765/api/customer/customers/{id}, which causes the calling of both customer and account services. All logs will be stored in Elasticsearch with the micro-%{serviceName} index. They can be searched in Kibana with the micro-* index pattern. Index patterns are created in Kibana under section Management > Index patterns. Kibana is available under http://192.168.99.100:5601. After running it, we will be prompted for an index pattern, so let's type micro-* . Under the Discover section, we can take a look at all logs matching the typed pattern with a timeline visualization.
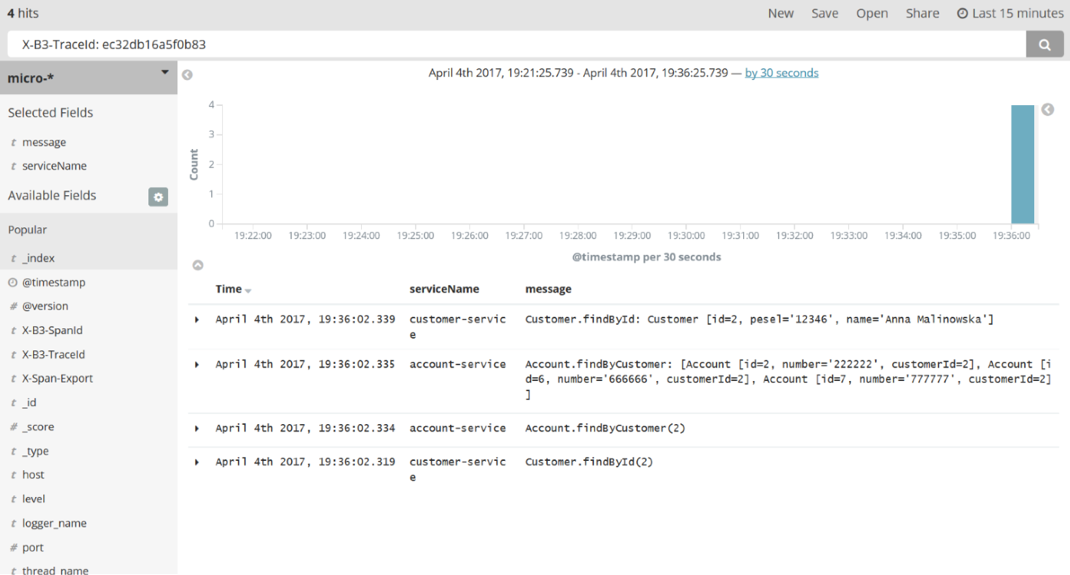
Kibana is a rather intuitive and user-friendly tool. I will not describe in detail how to use Kibana because you can easily consult the documentation or just go through the UI. The most important thing is to be able to search logs by filtering criteria. In the picture below, there is an example of searching logs by the X-B3-TraceId field, which is added to the request header by Spring Cloud Sleuth. Sleuth also adds X-B3-TraceId for marking requests for a single microservice. We can select which fields are displayed in the result list; in this sample, I selected message and serviceName , as you can see in the left pane of the picture below.
Here’s a picture with single request details. It is visible after expanding each log row.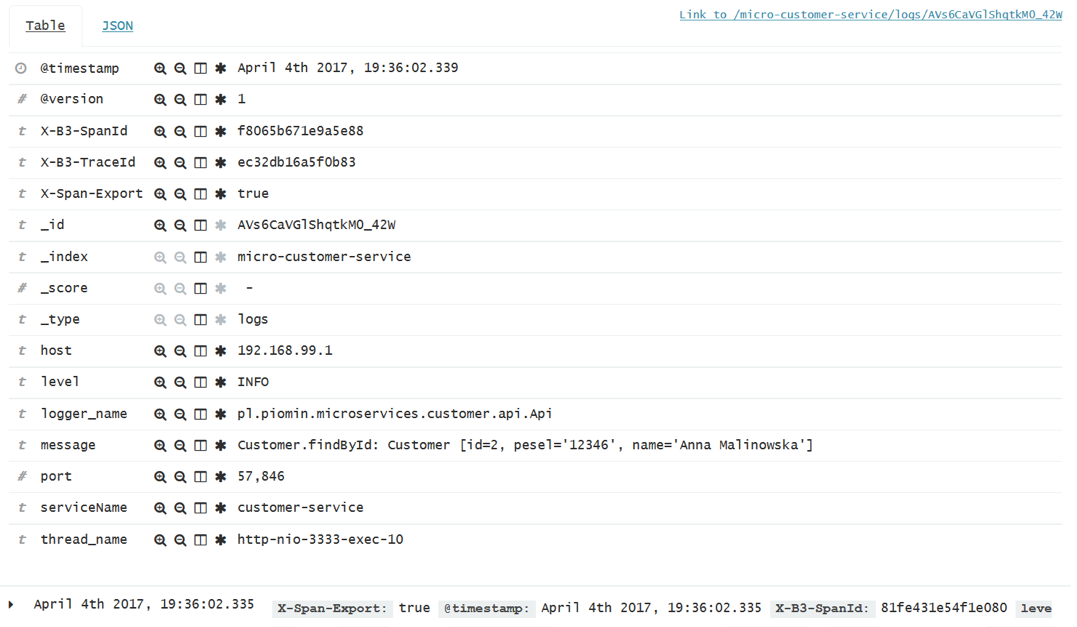
Zipkin
Spring Cloud Sleuth may also send tracing statistics to Zipkin. That is another kind of data than the data stored in Elastic Stack. These are timing statistics for each request. Zipkin UI is really simple. You can filter the requests by some criteria like time, service name, and endpoint name.
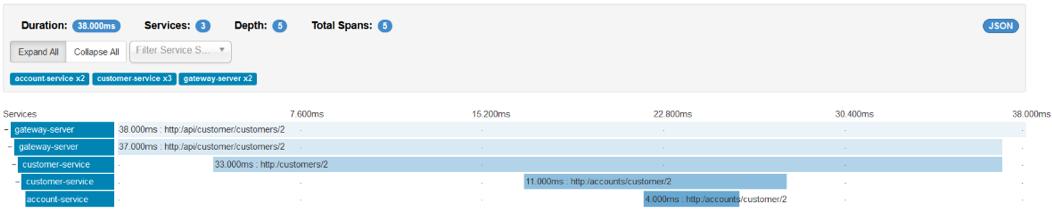
Below is a picture with the same requests that were visualized with Kibana (http://localhost:8765/api/customer/customers/{id}).
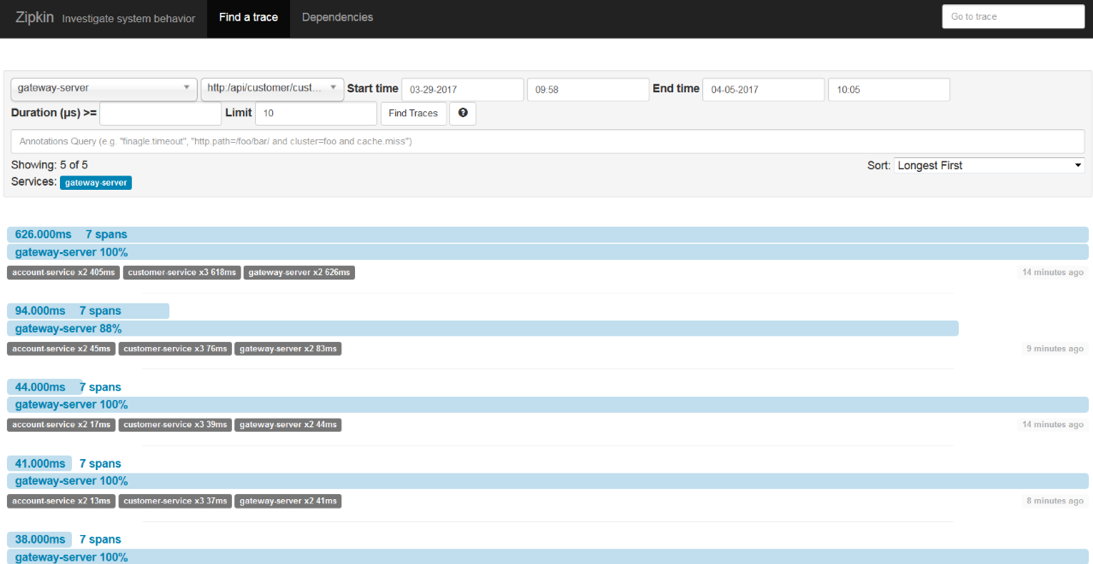
We can always see the details of each request by clicking on it. Then, you see the picture similar to what is visible below. In the beginning, the request has been processed on the API gateway. Then, the gateway discovers customer service on the Eureka server and calls that service. Customer service also has to discover the account service and then call it. In this view, you can easily find out which operation is the most time-consuming.
Conclusion
A microservices-based system is by definition a set of independent, relatively small standalone applications. There is no an upper limit for the number of microservices in your system. Their number can even reach a total of a few hundred. Considering that each for them may be launched in some instances we are talking about a couple of thousand independent applications. To successfully monitor such a large system, we have to collect and store logging and tracing data in a one, central place. With tools like Elastic Stack and Zipkin, monitoring microservices-based systems is not a difficult problem to solve. There are also some other tools—for example, Hystrix and Turbine—that provide real-time metrics for all the incoming requests.
Opinions expressed by DZone contributors are their own.
Comments