Monitoring Snowflake Usage
How to monitor spend on the Snowflake Cloud Data warehouse including dashboards for Tableau, Looker, PowerBI and Qlik.
Join the DZone community and get the full member experience.
Join For FreeOne of the most frequently asked questions is how to monitor Snowflake usage and costs. This article gives a brief summary of the charges on the Snowflake platform, then explains how to monitor Snowflake usage, and therefore spend over time.
Virtual Warehouses and T-Shirts

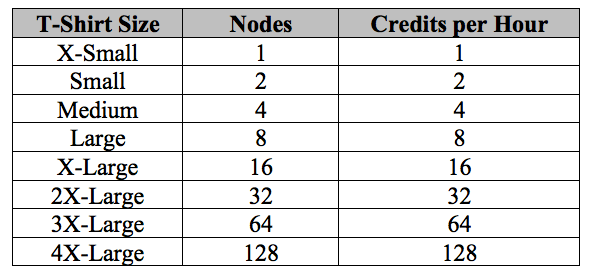
Unlike other cloud-based analytic platforms, which charge by the hour, Snowflake uniquely charges per-second for the compute resources, named Virtual Warehouses. A Virtual Warehouse consists of a cluster of machines (CPUs, memory and SSD) arranged as a Massively Parallel Processing (MPP) server with between 1 and 128 nodes. These are arranged in a series of “T-Shirt” sizes, with charges billed as “credits”, costing from a little as $2.00 per hour as illustrated below:
It’s therefore relatively easy to estimate the cost of running a server by simply taking:
- Warehouse Size: For example, a Medium warehouse which has 4 nodes, and enough power to summarize and report on gigabytes of data.
- Hours per Day: The server is expected to run, for example 8 hours per working day. Note: a virtual warehouse will automatically suspend and resume when not being used to avoid unnecessary charges.
This should give a reasonable estimate of cost, and the size can be dynamically adjusted depending up the data volumes expected and performance required.
Usage Control
Other usage should be relatively small by comparison and include the cost of storage which is a simple pass-through charge from the cloud provider. This is typically less than $25 per terabyte per month, and data is automatically compressed at a ratio of between 4-10 times giving additional savings.
Finally, sophisticated features including near-real time data ingestion using Snowpipe, automatic data clustering and materialized view refreshes use internal Snowflake resources and are charged on a per-second-per-CPU-core basis and may add an additional element.
Typically, however, you should expect around 80% of spend on virtual warehouses and should be the initial focus for analysis.

Snowflake provides two locations to monitor usage:
- Information Schema: Which provides a set of system-defined views and metadata with real-time statistics about queries. This data is typically retained for up to 14 days and is most useful to monitor ongoing queries.
- Snowflake Account Usage: Provides a rich set of historical metadata that is held for up to a year and will be the primary source of usage analysis over time.
These areas provide a rich set of metadata that can be analyzed. However, it’s much easier to simply show the potential results below.
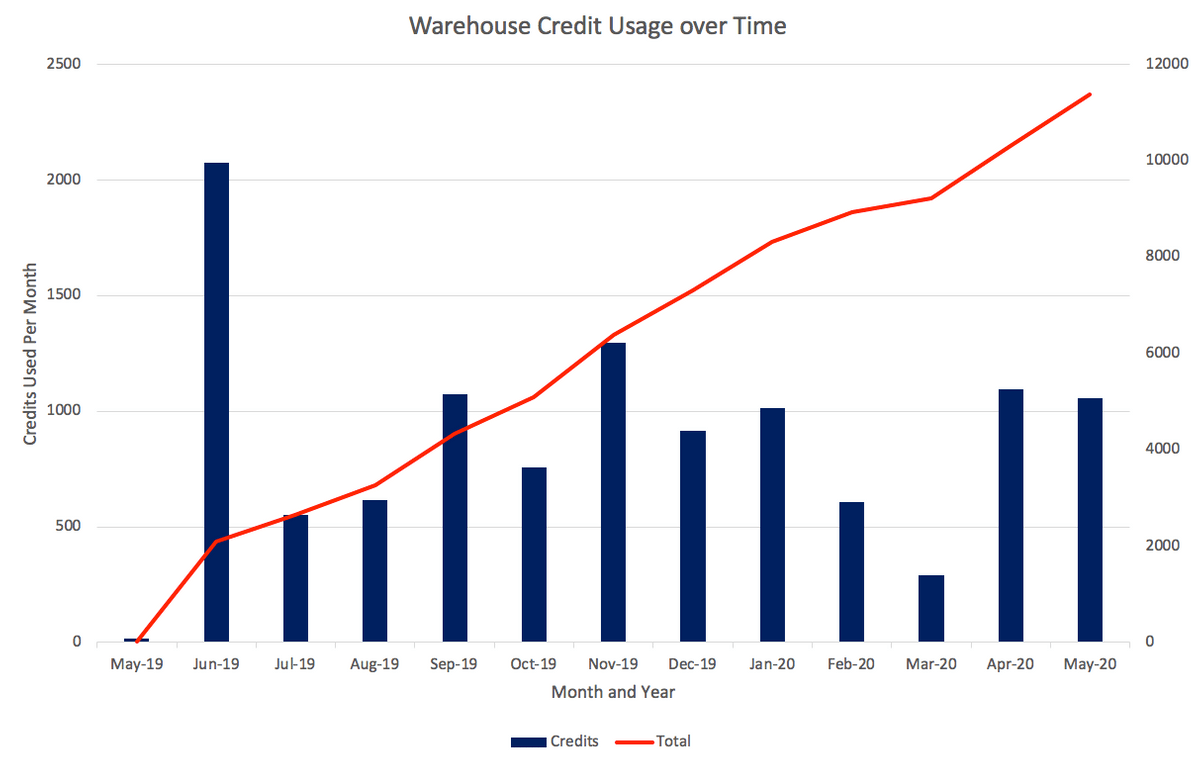
Warehouse Credits Over Time
xxxxxxxxxx
-- Warehouse Credits over time
select to_char(start_time,'YYYY-MM') as month
, sum(credits_used)
from snowflake.account_usage.warehouse_metering_history wmh
where wmh.start_time >= dateadd(month, -12, current_date())
group by to_char(start_time,'YYYY-MM')
order by 1;
The above query can be used to monitor both the monthly spend by all warehouses on the account over the past 12 months in addition to indicating the growth over time.
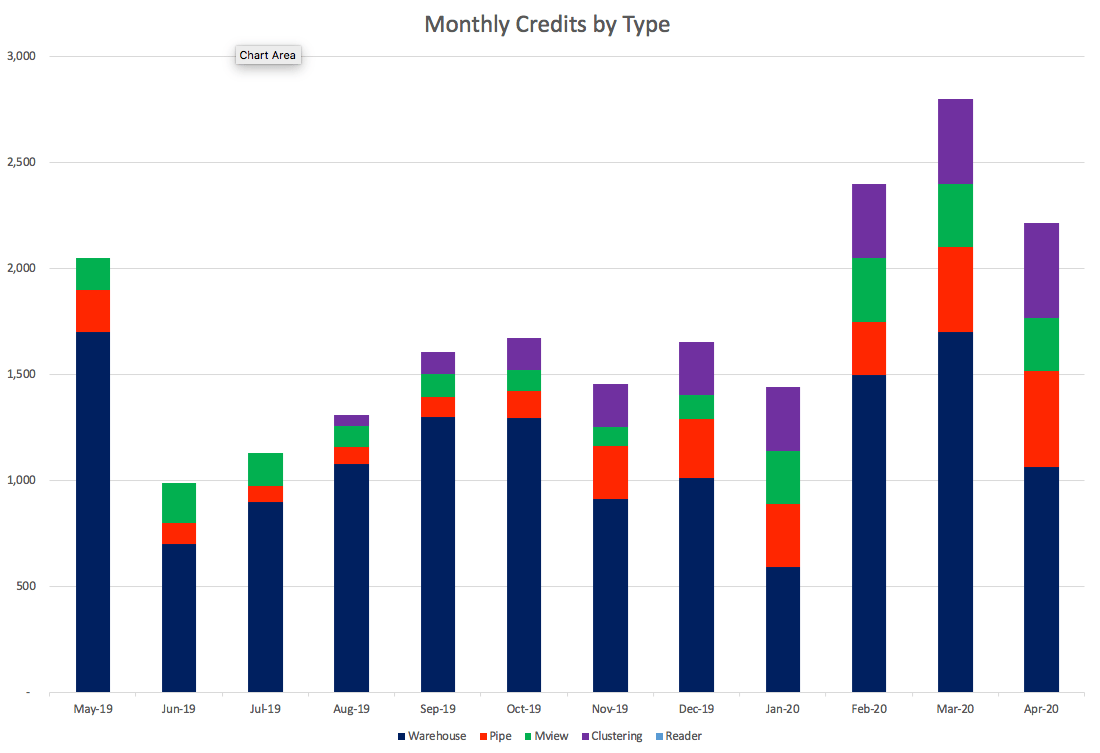
Monthly Credits by Type
xxxxxxxxxx
-- Monthly Credits By Type
select to_char(usage_date,'YYYYMM') as month
, sum(decode(service_type,
'WAREHOUSE_METERING', credits_billed)) as warehouse_credits,
sum(decode(service_type,
'PIPE', credits_billed)) as pipe_credits,
sum(decode(service_type,
'MATERIALIZED_VIEW', credits_billed)) as mview_credits,
sum(decode(service_type,
'AUTO_CLUSTERING', credits_billed)) as clustering_credits,
sum(decode(service_type,
'WAREHOUSE_METERING_READER', credits_billed)) as reader_credits
, sum(credits_billed) as total
from snowflake.account_usage.metering_daily_history wmh
where wmh.usage_date >= dateadd(month, -12, current_date())
group by to_char(usage_date,'YYYYMM');
The above query shows a breakdown of the total credits per month, indicating the type of spend. This includes:
- Warehouses: Credits used by compute resources
- Pipes: Credits used by the near real time loading facility, Snowpipe
- Mview: Credits used to refresh Materialized Views
- Clustering: Credits used by the automatic clustering mechanism
- Reader: Credits used by Reader Accounts, typically used to share access to data
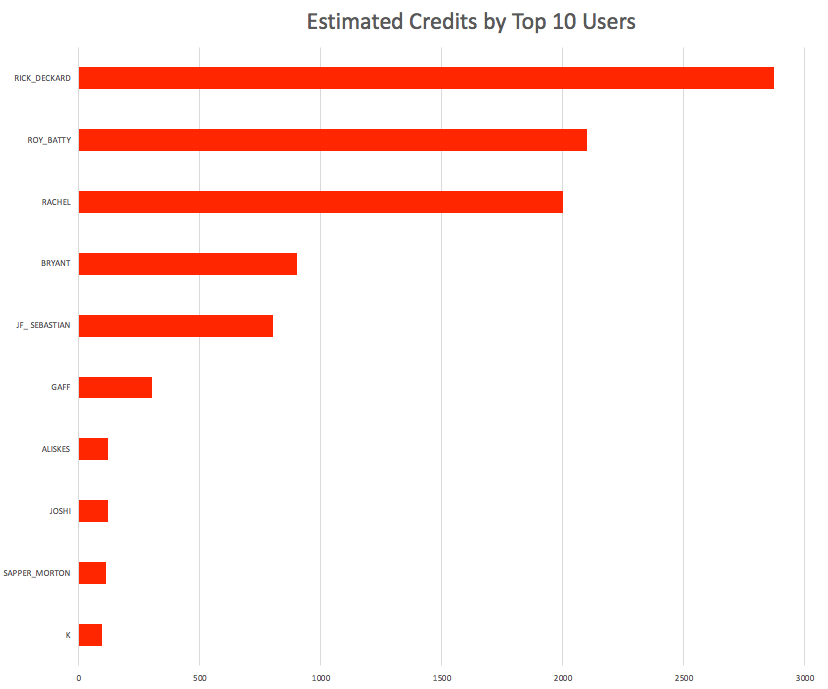
Top 10 Spending Users
xxxxxxxxxx
select user_name, count(*),
sum(total_elapsed_time/1000 *
case warehouse_size
when 'X-Small' then 1/60/60
when 'Small' then 2/60/60
when 'Medium' then 4/60/60
when 'Large' then 8/60/60
when 'X-Large' then 16/60/60
when '2X-Large' then 32/60/60
when '3X-Large' then 64/60/60
when '4X-Large' then 128/60/60
else 0
end) as estimated_credits
from snowflake.account_usage.query_history
group by user_name
order by 3 desc
limit 10;
The above query is a guestimate of the credit by the top 10 users on the system. Although the ranking is correct, the credit spend is a worst case estimate because although warehouses are charged by the second, any given warehouse can have a number of executing queries at one time, and the above report indicates a potential worst case, where a warehouse is used by a single user.
A more accurate indication of spend can be determined at the warehouse level below.
Actual Spend by Warehouse
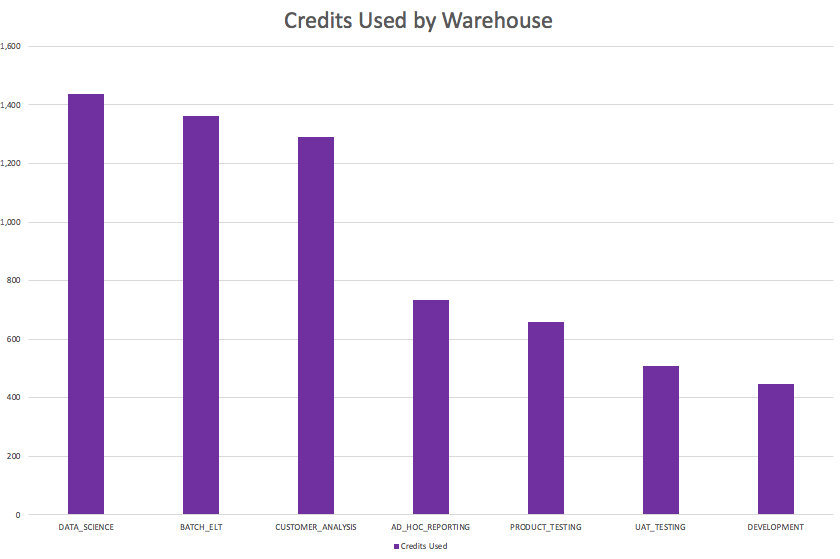
xxxxxxxxxx
-- Credits by Warehouse
select warehouse_name, sum(credits_used) as credits_used
from snowflake.account_usage.warehouse_metering_history wmh
group by warehouse_name
order by 2 desc
Credits by Hour
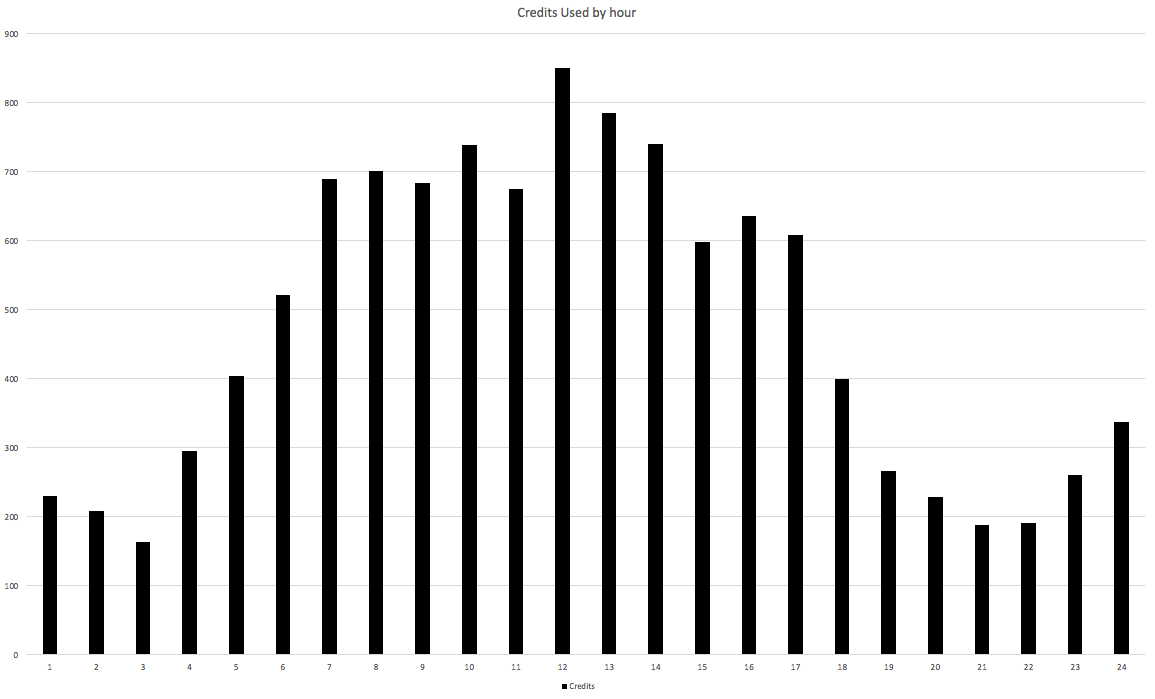
xxxxxxxxxx
-- Credits by hour of the day
select to_char(start_time,'HH24') as hour
, sum(credits_used)
from snowflake.account_usage.warehouse_metering_history wmh
where wmh.start_time >= dateadd(month, -1, current_date())
group by to_char(start_time,'HH24')
order by 1;
The above query indicates what time of the day queries are executing, and credits spent. This may be useful to indicate the peak times during the day, in addition to identifying unexpected high spending during what is normally a quiet time over night.
Data Storage Cost by Month
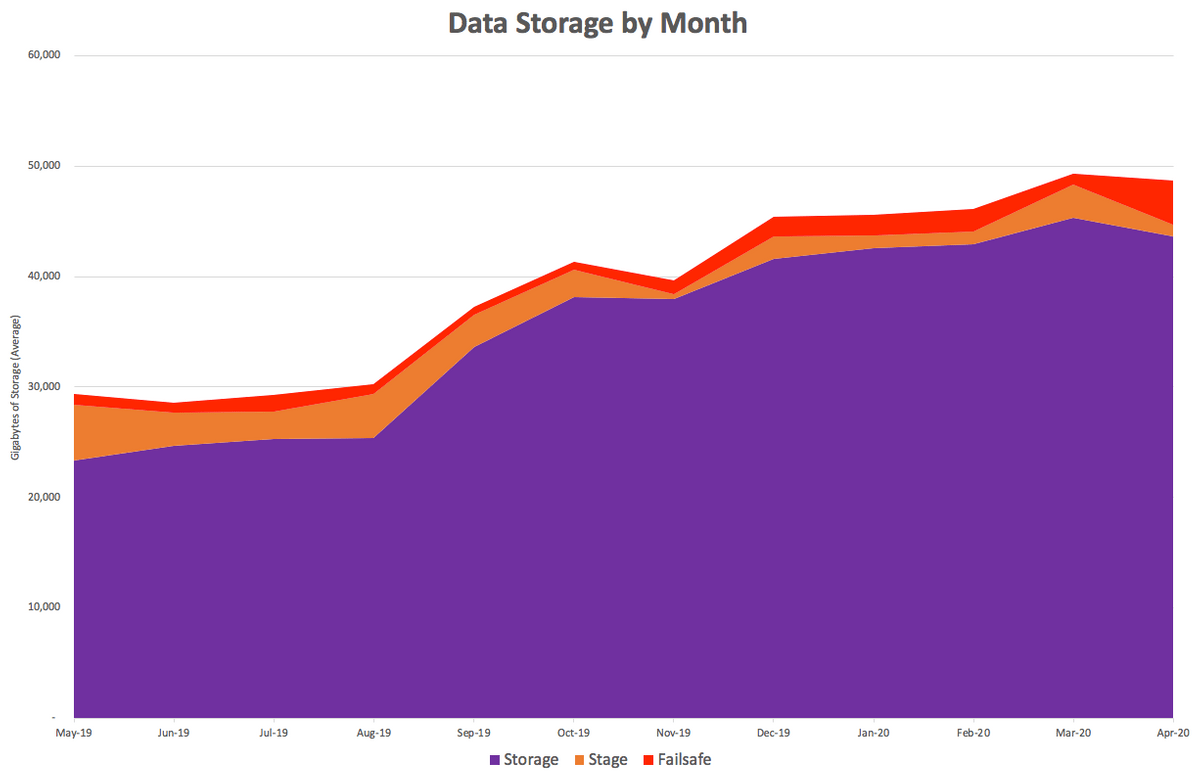
xxxxxxxxxx
-- Data Storage by Month and Type
select to_char(usage_date,'YYYYMM') as sort_month
, to_char(usage_date,'Mon-YYYY') as month
, avg(storage_bytes) as storage
, avg(stage_bytes) as stage
, avg(failsafe_bytes) as failsafe
from snowflake.account_usage.storage_usage
group by month, sort_month
order by sort_month;
The report above shows the monthly cost for storage broken by type. These indicate the cost by:
- Storage: This indicates the data stored in Snowflake tables.
- Stages: This indicates the data stored in files in Snowflake stages
- Failsafe: This indicates the storage in the 7-day failsafe area to protect against accidental data loss.
Freely Available Dashboards
There are also a number of freely available dashboards for the major Business Intelligence vendors below:
- Tableau - Snowflake Account Usage
- Looker - Snowflake Cost and Usage Analysis
- Microsoft PowerBI - Snowflake Usage Report
- Qlik - Snowflake Usage Dashboard
If you know of another vendor or an alternative dashboard, feel free to reach out to me on LinkedIn.
Disclaimer: The opinions expressed in my articles are my own and will not necessarily reflect those of my employer (past or present) or indeed any client I have worked with.
Originally published on: Analytics.Today
Published at DZone with permission of John Ryan. See the original article here.
Opinions expressed by DZone contributors are their own.
Comments