

MuleSoft Anypoint Platform Audit Logs to Splunk
This article addresses the overall approach to how to send the MuleSoft Anypoint platform Audit logs to Splunk. Learn more!
Join the DZone community and get the full member experience.
Join For FreeOverview
This article addresses the overall approach to how to send the MuleSoft Anypoint platform Audit logs to Splunk.
Audit Logs
Changes made by users within Anypoint Platform organizations are logged through an audit logging service. You can access the data logs through the audit logging query API or through the audit logging UI. Audit logs provide a quarriable history of actions performed within the Anypoint Platform. It also Keeps track of all users who have interacted with objects in the system and timestamps those actions. Provides mechanisms for querying the set of users who have performed actions.
Audit Log Retention Period
- The default retention period for the Audit log is six years.
- Users who have the Organization Administrator and Audit Log Config Manager permission can customize the retention period.
- Download your logs periodically if you want to maintain your log files for longer than six years or build a custom API to send the audit logs to an external monitoring tool like Splunk.
- You can specify the retention period as between 30 and 2190 days.
- The date the new retention period takes effect must be a minimum of seven days from the current date.
Access Audit Logs
Users who have the Organization Administrator permission or the Audit Log Viewer permission on the Anypoint Platform have access to both the UI and the Query API. The audit log service is business-group aware, which means you see only logs that are relevant to your own business group.
The audit log UI is embedded in Access Management.
- Log in to Anypoint Platform.
- In the navigation bar or the main Anypoint Platform page, click Access Management.
- In the Access Management navigation menu, click Audit Logs.
Currently, there is no available method to forward the audit logs to external logging services, such as Splunk. The only way we can achieve this is by using a custom integration, as the audit logs can only be retrieved using the Audit log Query REST API.
Audit Log Contents
Each log entry has a set of properties that provide information about the activity:
- Time: The timestamp when the activity occurred.
- Product: The product where the object resides, for example, Access Management
- Type: The type of the object on which the action is performed, for example, Organization
- Action: The action associated with the object, for example, Create
- Object: The name of the object, for example, foo
- User Name: The user who performed the action, for example, John
- Connected App: Name of the connected app that takes an action on behalf of a user or itself. If a connected app did not execute the action, the payload is N/A.
- Environment: Environment names for events from API Manager, Runtime Manager, CloudHub, Partner Manager, and MQ.
- Parent: (Optional) The parent of the object (if any) on which the action is performed. Mainly relevant to APIs.
- Payload: (Optional) More information about the log properties. For example, if an organization was created, then the payload would contain information about the organization and the owner, such as IDs.
Rate Limit Policy for Audit Log Query Endpoint
The Audit Log Query endpoint applies rate limits per IP in the three control planes: US, EU, and gov. The following table outlines the rate limits for each control plane:
Control Plane |
Allowed requests per minute per IP |
US |
700 |
EU |
40 |
Gov |
40 |
If a client exceeds the rate limit for a given control plane, the Audit Log Query endpoint returns a 503 Service Unavailable status code until the minute expires. During this time, the service is unavailable to the client.
It is recommended that users of the Audit Log Query Endpoint monitor their request rates and adjust their usage accordingly to avoid exceeding the rate limit. Note that exceeding the rate limit may result in the endpoint being temporarily unavailable.
Sequence Diagram to Customize and Send Audit Logs To External Logging Service
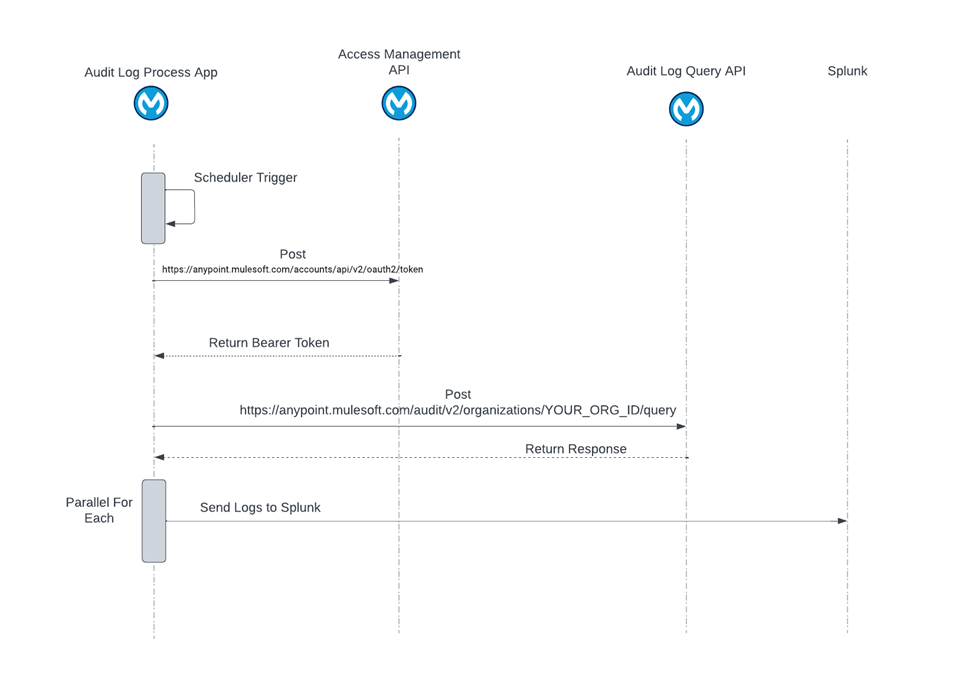
Procedure on how to get the Access token and Audit logs.
Step 1: Get Access Token
The Following method to get a token will used when the MFA is enabled on the user.
- In Anypoint Platform, navigate to Access Management -> Connected Apps:
- Next, click on "Create app".
- Enter a name for the App.

- Choose "App acts on its own behalf (client credentials)" and add the needed permissions.
- Click on “Add Scopes,” select Audit Log Viewer, and hit Next.

- Select the Business Groups for which you want to apply.

- Now, you can return to the screen from step 1. On the right-hand side of your app, click on "Copy ID". Please note this down somewhere.
- From step 7, on the right-hand side of your app, click on "Copy Secret." Please note this down somewhere.
- Now, you are ready to get the bearer token from the connected app's client ID and client secret.
Below is the curl command (you will need to replace the brackets with the id from step 7 and the secret from step 8
curl --location --request POST https://anypoint.mulesoft.com/accounts/api/v2/oauth2/token \--header 'Content-Type: application/x-www-form-urlencoded' \--data-urlencode 'client_id=<CLIENT ID from step 7>' \--data-urlencode 'client_secret=<CLIENT SECRET from step 8>' \--data-urlencode 'grant_type=client_credentials'Here is the response that you should receive:
{

    "access_token": "<bearer token>",

    "expires_in": 2043,

    "token_type": "bearer"

}
Step 2: Call the Audit Log API
Using the above token, call the Audit Log Query API. Below is the curl command to call the Audit Log Query API.
curl --location 'https://anypoint.mulesoft.com/audit/v2/organizations/<YOUR_ORG_ID/query' \--header 'Authorization: Bearer <bearer token>' \--header 'Content-Type: application/json' \--header 'Cookie: XSRF-TOKEN=k8vUwQIo-LA2RzHB1wX2Xk7OKt17Om46chnU; _csrf=Ut5lqk16VxB87VFWDBzUxEG5; mulesoft.sess=eyJpZCI6ImlNdlB6TWgwN0k5cEpFcnJrUHdkcGoxbjNTUExxUzVWIiwibWZhX3VzZXJfaWQiOiJmZDBiMmMzZS1kNDYyLTQ4ZWEtYmM1Yy0wNDg1M2Y1YTM4MDUifQ==; mulesoft.sess.sig=VRZ13zOJIohUNgbMZW6afFjiGfo; mulesoft.vaas.sess=eyJpZCI6ImlNdlB6TWgwN0k5cEpFcnJrUHdkcGoxbjNTUExxUzVWIiwibWZhX3VzZXJfaWQiOiJmZDBiMmMzZS1kNDYyLTQ4ZWEtYmM1Yy0wNDg1M2Y1YTM4MDUiLCJpc1JlYXV0aCI6ZmFsc2V9' \--data '{ "startDate": "2023-11-21T17:43:01.199-06:00", "endDate": "2023-11-22T17:43:01.2-06:00"}'Below is the response snippet you will receive.

Once we have retrieved the audit logs, we can send these logs to Splunk.
Download and Install Splunk Enterprise Edition
Download the Splunk Enterprise trial edition (for 60 days) from this link and install it on your local machine.
Setup Splunk To Receive Audit Logs
- Login to Splunk Enterprise Account.
- Go to settings -> Data inputs -> Http Event Collector -> New Token
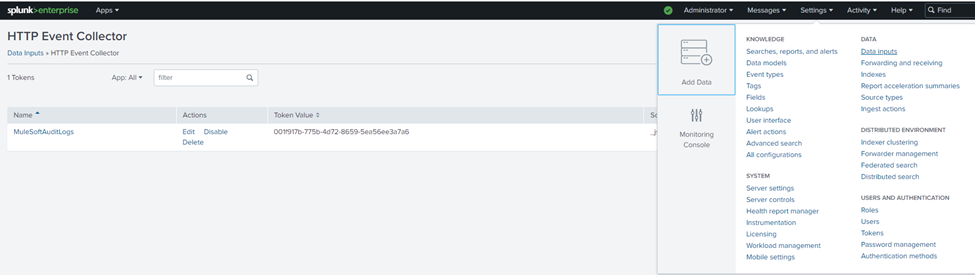
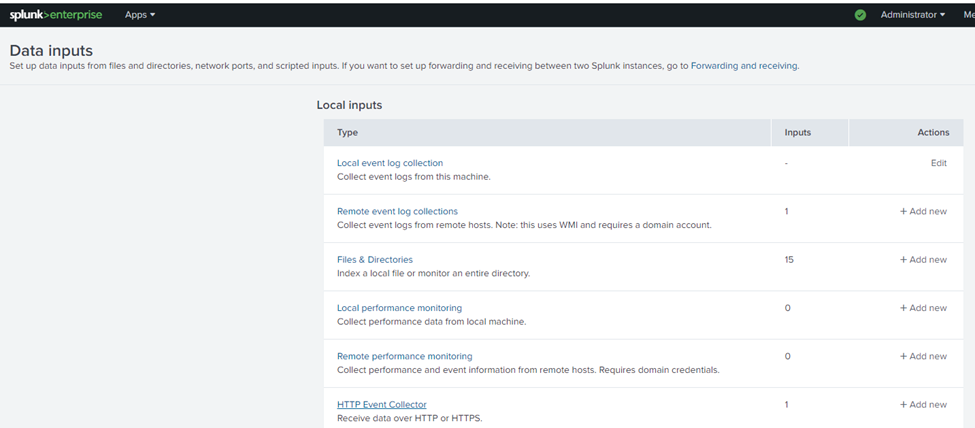

- Provide the Token Name and Click on Next
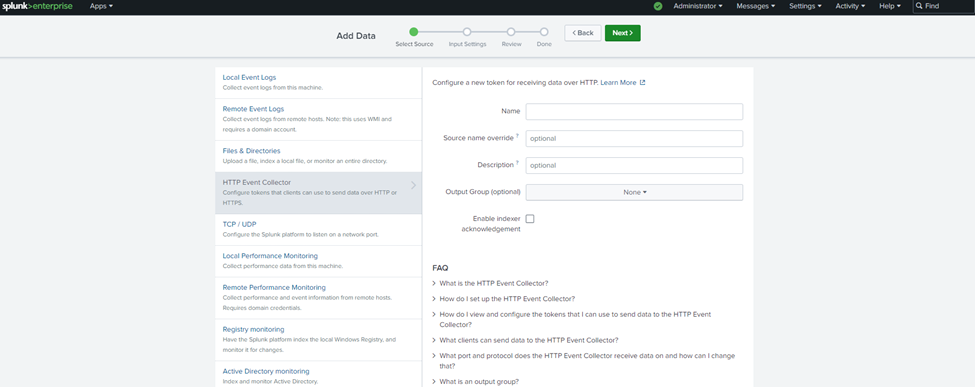
- In the input settings, provide source type by selecting the type as _json from the dropdown.
- Add the necessary indexes and click on Review.

- Review and submit.
- Navigate to settings -> Data Inputs - > Http Event collector.
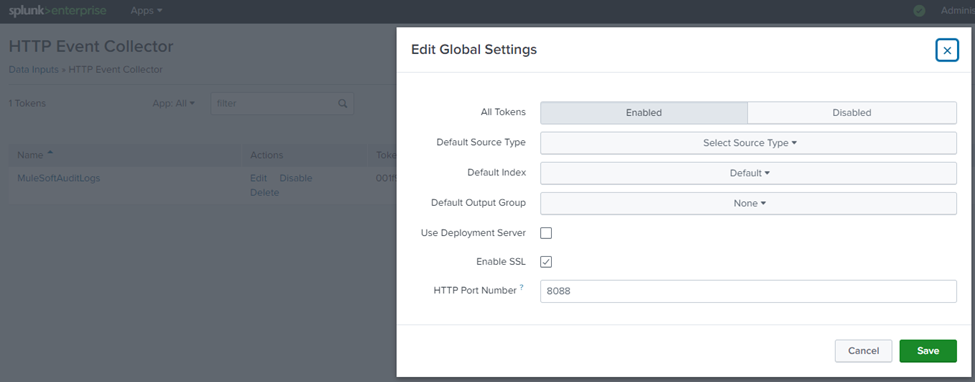
- Enable the tokens in Global settings -> All Tokens - > Enabled.
MuleSoft Code To Get Audit Logs and Then Send It to Splunk
There are two ways we can send the Audit logs to Splunk. One is by calling the HTTP request endpoint, and the other one is by using the log4j appender.
- Below is the MuleSoft flow where we can use HTTP Request to send the logs to Splunk.

- Below is the log4j appender details to send the logs to Splunk.
Below is the log4j.xml file configuration
<?xml version="1.0" encoding="utf-8"?>

<Configuration status="INFO" name="cloudhub" packages="com.mulesoft.ch.logging.appender, com.splunk.logging, org.apache.logging.log4j">

                <!--These are some of the loggers you can enable. There are several more you can find in the documentation. Besides this log4j configuration, you can also use Java VM environment variables to enable other logs like network (-Djavax.net.debug=ssl or all) and Garbage Collector (-XX:+PrintGC). These will be append to the console, so you will see them in the mule_ee.log file. -->

                <Appenders>

                                <RollingFile name="file" fileName="${sys:mule.home}${sys:file.separator}logs${sys:file.separator}app-info.log" filePattern="${sys:mule.home}${sys:file.separator}logs${sys:file.separator}artifactId%i.log">

                                                <PatternLayout pattern="[%d{MM-dd HH:mm:ss.SSS}] %-5p %c{1} [%t]: %m%n"/>

                                                <Policies>

                                                                <SizeBasedTriggeringPolicy size="10 MB"/>

                                                </Policies>

                                                <DefaultRolloverStrategy max="10"/>

                                </RollingFile>

                                <properties>

                                                <name>${artifactId}</name>

                                </properties>

                                <!-- Log4J2CloudhubLogAppender = Send log data to Cloudhub -->

                                <Log4J2CloudhubLogAppender name="cloudhub" addressProvider="com.mulesoft.ch.logging.DefaultAggregatorAddressProvider" applicationContext="com.mulesoft.ch.logging.DefaultApplicationContext" appendRetryIntervalMs="${sys:logging.appendRetryInterval}" appendMaxAttempts="${sys:logging.appendMaxAttempts}" batchSendIntervalMs="${sys:logging.batchSendInterval}" batchMaxRecords="${sys:logging.batchMaxRecords}" memBufferMaxSize="${sys:logging.memBufferMaxSize}" journalMaxWriteBatchSize="${sys:logging.journalMaxBatchSize}" journalMaxFileSize="${sys:logging.journalMaxFileSize}" clientMaxPacketSize="${sys:logging.clientMaxPacketSize}" clientConnectTimeoutMs="${sys:logging.clientConnectTimeout}" clientSocketTimeoutMs="${sys:logging.clientSocketTimeout}" serverAddressPollIntervalMs="${sys:logging.serverAddressPollInterval}" serverHeartbeatSendIntervalMs="${sys:logging.serverHeartbeatSendIntervalMs}" statisticsPrintIntervalMs="${sys:logging.statisticsPrintIntervalMs}">

                                                <PatternLayout pattern="[%d{MM-dd HH:mm:ss}] %-5p %c{1} [%t]: %m%n"/>

                                </Log4J2CloudhubLogAppender>

                                <SplunkHttp name="splunk" url="${splunk.host}" token="${splunk.token}" sourcetype="log4j" index="${splunk.index}" disableCertificateValidation="false">

                                                <PatternLayout pattern="%m"/>

                                </SplunkHttp>

                </Appenders>

                <Loggers>

                                <!-- Http Logger shows wire traffic on DEBUG. -->

                                <!--AsyncLogger name="org.mule.service.http.impl.service.HttpMessageLogger" level="DEBUG" /-->

                                <AsyncLogger name="org.mule.service.http" level="WARN"/>

                                <AsyncLogger name="org.mule.extension.http" level="WARN"/>

                                <!-- Mule logger -->

                                <AsyncLogger name="org.mule.runtime.core.internal.processor.LoggerMessageProcessor" level="INFO"/>

                                <AsyncRoot level="INFO">

                                                <AppenderRef ref="file"/>

                                                <AppenderRef ref="splunk"/>

                                                <AppenderRef ref="cloudhub"/>

                                </AsyncRoot>

                </Loggers>

</Configuration>
POM file dependencies
<dependency>

            <groupId>com.splunk.logging</groupId>

            <artifactId>splunk-library-javalogging</artifactId>

            <version>1.7.3</version>

</dependency>Opinions expressed by DZone contributors are their own.
Comments