Navigating Progressive Delivery: Feature Flag Debugging Common Challenges and Effective Resolution
Lightrun's Conditional Snapshot and Logs allow developers to create virtual breakpoints dynamically without impacting performance or sacrificing security.
Join the DZone community and get the full member experience.
Join For FreeIntroduction
Most modern software runs multiple versions of the application to conduct experiments (e.g., A/B testing) or to deploy new versions safely (e.g., canary, blue-green deployments). To support this, feature flags are commonly used to toggle different functionality at runtime. Developers may add feature flags to introduce a new feature and progressively roll it out in production. Alternatively, feature flags may introduce different business or behavior logic per some external variable for experimentation or data collection.
While feature flags are a great tool for minimizing risk in validating new features and modifying behavior without disruptive deployments, it also adds complexity in debugging when the number of feature flags grows to be large. For large applications, it’s not uncommon to see multiple feature flags per service. In fact, it was reported that Facebook had over 60 different versions of the navigation bar at one time. Coupling that number with all the various microservices it communicates with, the combination of possible states grows exponentially large. So at scale, feature flags may be managed by a feature management platform like LaunchDarkly or AWS AppConfig.
Pain Points
Now, imagine that you are a developer who has been paged to investigate an outage. After looking at the dashboard and sifting through relevant logs, you realize that a problem is occurring only under a certain condition. Thanks to feature flags, this may be impacting a small subset of customers under a specific combination of configurations. But it may not be immediately clear which combination of feature flags are causing the issue and what the impact might be to change those feature flags.
To illustrate, let’s take a look at a dummy Python code:
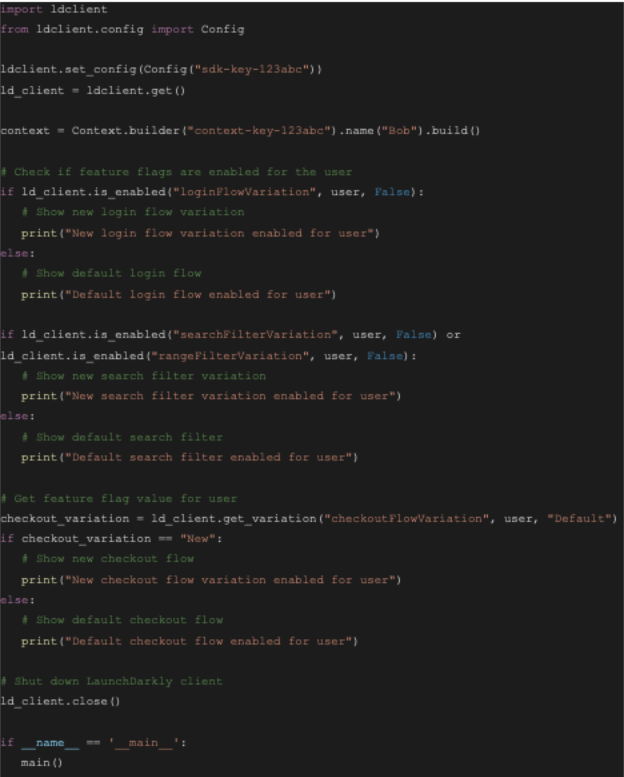
Imagine that separate business logic is executed under various feature flags (e.g., loginFlowVariation, searchFilterVariation, rangeFilterVariation, checkoutFlowVariation). First, looking at the logs and traces, you might determine that the error is occurring somewhere in this section of code. But if only the application logs are collected, it may not give the full stack to determine whether the call came from the searchFiltervariation/rangeFilterVariation or some other logic.
Even if we track the function call, to fix the issue, engineers must try to replicate the issue locally and debug from there. This is usually not a trivial thing to solve in codebases with complex business logic and conditional statements embedded behind feature flags.
So, how can we solve this while retaining the benefits of feature flags?
Ideal Solution
Locally, developers would use debuggers and place breakpoints to step through the code. Breakpoints placed throughout the code will reveal the state of the system at each step and allow the developer to walk through the logic. However, trying to replicate production issues locally is not always simple. First, developers may not have access to production data or testing data that is similar enough to reproduce the behavior. Even if the workloads can be simulated synthetically, it is hard to replicate the exact combination of feature flags to get to the root cause.
With that in mind, it would be ideal to debug live in production. However, with traditional tools, this is not easy to do. For one, adding debuggers live can seriously impact performance. And for serverless architectures, developers may not even have access to ssh in.
Ideally, what we want is the ability to create virtual breakpoints without impacting the performance or sacrificing security to expose the same level of information as running a debugger locally. Also, this should be added dynamically without having to change the code and force a new deployment.
Resolution: Lightrun’s Conditional Snapshot
Lightrun is a developer observability platform that can dynamically instrument logs and create virtual breakpoints in live applications. Lightrun injects an agent that can create conditional snapshots at runtime. Snapshots can be created on any line, inside any feature-flag branch, with full-syntax expression evaluation. You can even create your own virtual feature flag to conditionally create snapshots or logs to get a debugger-like experience.
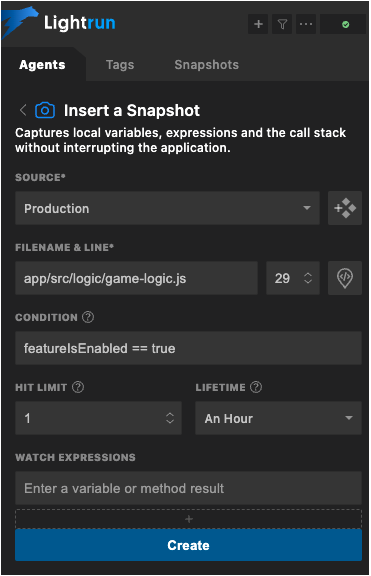
For example, you can take snapshots within an existing feature flag like:
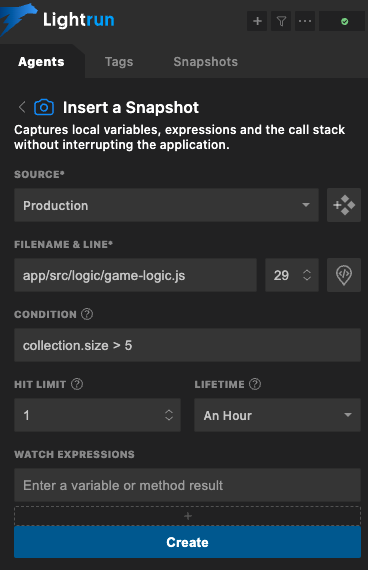
Alternatively, you could define a new condition to check your logic. Perhaps you want to see the state when some collection’s size is greater than 5:
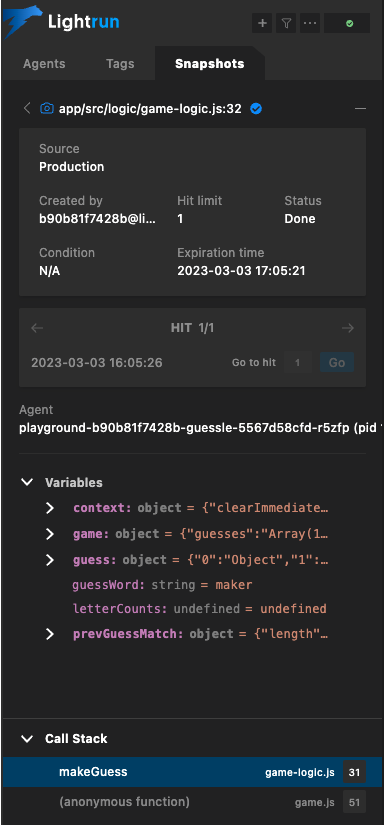
In either case, what you get is a debugger-like experience with some information about your variables and the call stack:
With Lightrun, developers can quickly get to the root of the issue or better understand the flow of logic in production by creating snapshots. This drastically reduces the mean time to resolution in the case of an outage, as well as saving the developer from the frustration of trying to figure out what’s happening with the combination of complex feature flag logic. With conditional snapshots, developers can also quickly rule out sections of code that are not being executed while also being able to dynamically add logs or different statements to debug without replicating them locally.
Also, Lightrun can be an extension to an existing feature flag solution such as LaunchDarkly, AWS AppConfig, and Split.io. After enabling a feature for only a small portion of users or traffic, you can use Lightrun to verify feature functionality quickly. You can then progressively add more for a safe deployment process. This helps improve development velocity and productivity. Try Lightrun today to enable your developers to debug in real-time without having to add new logs and redeploy to gather information exposed by snapshots.
Opinions expressed by DZone contributors are their own.
Comments