Node.js RESTful API to Create Interactive Charts
In this article, we'll use Node, Express, MongoDB, and jQuery to integrate an API into a web application. Read on to learn yet another use for Node!
Join the DZone community and get the full member experience.
Join For Free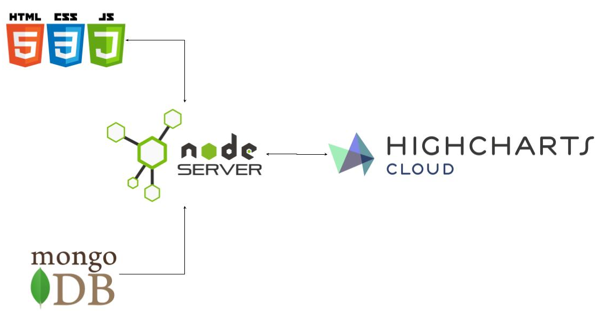
In this tutorial, I will show you how to build a web application that reads data from a database and uses the Highcharts Cloud API to create, duplicate and delete a chart. I will be using the following technologies: Node.js, Express.js, MongoDB, and jQuery. Basic knowledge of JavaScript, Node.js, and MongoDB is beneficial in order to better understand the application code.
You can download the code used in this article from the following GitHub link.
Before I go any further, please, make sure you have a Highcharts Cloud plan with API access (Enterprise or Team Advanced).
I will walk you through the architecture and some code first; then I will show you how to get and run the application.
Let’s get started.
The Architecture
The main idea is to create a RESTful application that exposes a simple API which lets a user create a Highcharts Cloud chart based on a dataset fetched from MongoDB.
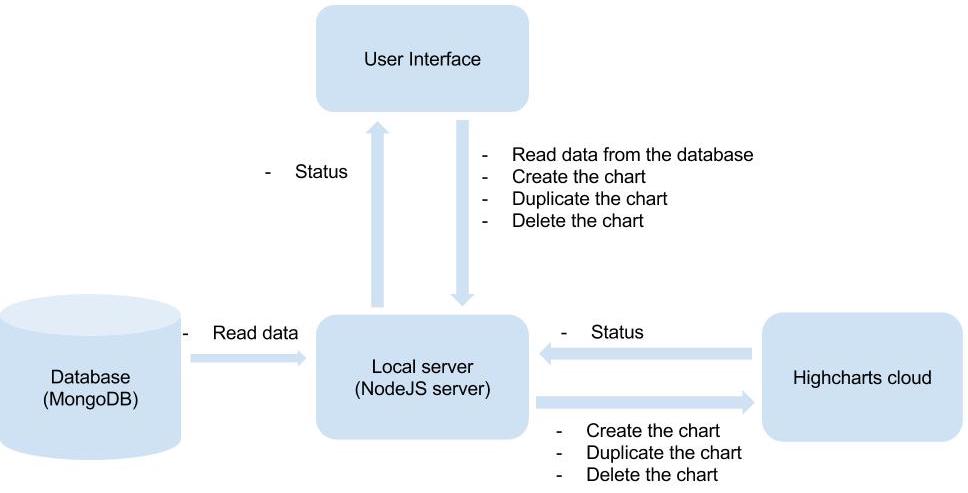
The application flow diagram below shows how two different requests are handled: read data and create chart. The duplicate and delete chart have the same code structure as create chart.

Let’s examine each element of the architecture.
Database
I use a MongoDB database to store the charts’ information such as the title and the series data. MongoDB is easy to use when building JavaScript apps, as it stores JSON natively. This means that the query results are represented as proper JavaScript objects, which makes things tidier.
Here is the structure of the data saved in the database:
{
    "data": [
        43934,
        52503,
        57177,
        69658,
        97031,
        119931,
        137133,
        154175,
        354175
    ],
    "title": "New Solar installation in 2030"
}
I use mLab (an online service) to manage my database. mLab offers a free plan, and it is sufficient for this application. Any other service or local MongoDB instance will work as well.
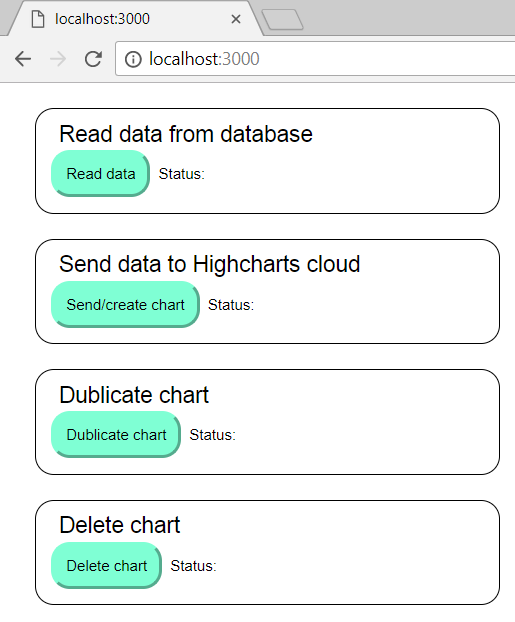
User Interface
The client-side page has the following functionality:
- Read data from a database.
- Create a chart.
- Duplicate a chart.
- Delete a chart.
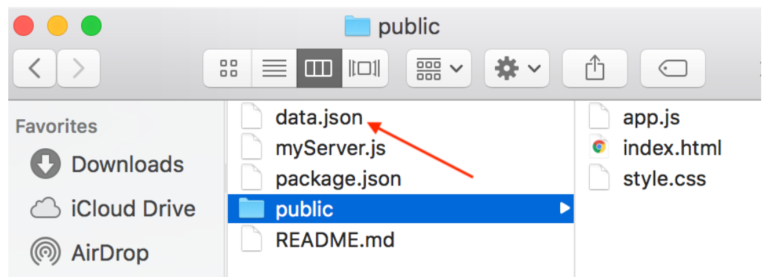
The HTML (index.html) and CSS (style.css) files are used to build the user interface; the JavaScript file (app.js) is in charge of executing the requests. If you have already downloaded the code from GitHub, you can find those files in the public folder:

I use jQuery to listen for button clicks, and for performing Ajax requests to the server. Any other library or framework will work fine as well, all you need to be able to do is bind to a click event, and perform an Ajax request. You could also use vanilla JavaScript by using XMLHttpRequest and getElementByID.
All four buttons have the same code structure.
Here is the code to send the readDataFromDB command:
  //Read data from DB to the myServer
  $("#readDataFromDB").click(function() {
    $.ajax({
      type: "GET",
      url: "http://localhost:3000/readDataFromDB",

      dataType: 'json',
      contentType: 'application/json',
      success: function(res) {
        //Show status
        console.log(res);
        showStatus(res.status, '#readDataFromDBLabel');
      },
      error: function() {
        //Show status
        console.log(res);
        showStatus(res.status, '#readDataFromDBLabel');
      }
    });
  });
This code binds a handler to the click event for our readDataFromDB button. The handler performs an Ajax request to the /readDataFromDB route on our RESTful server. Once the request has been completed, I change the caption of the status label next to the button to reflect what happened using the showStatus(status, target) function.
Notice that I set the dataType to json. This is because our RESTFul server responds with JSON-formatted data. It also tells jQuery to automatically convert the returned data to an actual JavaScript object. The status is passed as the first parameter to the function showSatus() to be published; the label is used as the second parameter, in this case with the ID readDataFromDBLabel.
function showStatus(result, label) {
  $(label).text("Status: " + result);
};
Here is the rest of the user interface code featuring all the requests:
document.addEventListener('DOMContentLoaded', function() {

  //Read data from DB to the myServer
  $("#readDataFromDB").click(function() {
    $.ajax({
      type: "GET",
      url: "http://localhost:3000/readDataFromDB",

      dataType: 'json',
      contentType: 'application/json',
      success: function(res) {
        //Show status
        console.log(res);
        showStatus(res.status, '#readDataFromDBLabel');
      },
      error: function() {
        //Show status
        console.log(res);
        showStatus(res.status, '#readDataFromDBLabel');
      }
    });

  });


  //Create chart
  $("#sendToHCCloud").click(function() {

    $.ajax({
      type: "GET",
      url: "http://localhost:3000/sendToHCCloud",

      dataType: 'json',
      contentType: 'application/json',
      success: function(res) {
        //Show status
        console.log(res);
        showStatus(res.status, '#sendToHCCloudLabel');
      },
      error: function() {
        //Show status
        console.log(res);
        showStatus(res.status, '#sendToHCCloudLabel');
      }
    });

  });

  //duplicate chart
  $("#duplicateChart").click(function() {

    $.ajax({
      type: "GET",
      url: "http://localhost:3000/duplicateChart",

      dataType: 'json',
      contentType: 'application/json',
      success: function(res) {
        //Show status
        console.log(res);
        showStatus(res.status, '#duplicateChartLabel');
      },
      error: function() {
        //Show status
        console.log(res);
        showStatus(res.status, '#duplicateChartLabel');
      }
    });

  });

  //Delete the chart
  $("#deleteChart").click(function() {
    $.ajax({
      type: "GET",
      url: "http://localhost:3000/deleteChart",

      dataType: 'json',
      contentType: 'application/json',
      success: function(res) {
        //Show status
        console.log(res);
        showStatus(res.status, '#deleteChartLabel');
      },
      error: function() {
        //Show status
        console.log(res);
        showStatus(res.status, '#deleteChartLabel');
      }
    });

  });

}, false);
Local Server
The local server (myServer) is the central element in this application since it connects the database, the user interface, and the Highcharts Cloud API.
I built the local server using Node.js, with the aid of the following modules :
- Express to create the local server.
- Request to communicate with the Highcharts Cloud tool.
- Mongoose to manage the Mongo database.
- Config-js to store logins and passwords of the database and the Highcharts Cloud.
- Cors to avoid cross-origin policy issues, to learn more about the policy click here.
- Path to deal with file paths in a portable way (note that this module is a part of node itself).
- Clear to launch the clear screen command before each session.
The first section of the myServer code is to require the modules:
//express to set the server
var express = require('express');
var app = express();
//request to communicate with the highcharts cloud
var request = require('request');
//cors to send/receive data in JSON format across domains
var cors = require('cors');
//to set the public path where the index.html is saved
var path = require('path');
//config-json to store the passwords, API key, etc
var config=require('config-json');
//Mongoose to communicate with the database
var mongoose = require('mongoose');
Then I create the object to store the data fetched from the database:
var dataToSendObject = {
  data: {
    template: {},
    options: {
      title: {
        text: ""
      },
      series: [{}]
    }
  }
};
All the credentials are saved in a separate file called config.json:
{
    //HCCloud team id
    "teamID" : 123456,

    //HCCloud API key
    "APIKey" : '123456',

    // MongoBD's username and password
    "dbCredentials":{
        "DBlogin" : 'name',
        "DBpwd" : '123456',
    },
    //MongoDB database link
    "BLink" : '123x123x',
}
Remark
If you did not create your API credentials for the Highcharts Cloud yet, go ahead and do it. You need to get:
- Highcharts Cloud team ID.
- Highcharts Cloud API key.
You also need to get your database credentials:
- Database login and password.
- Database hostname/URL.
You can find your Highcharts Cloud team ID number on the API management page.
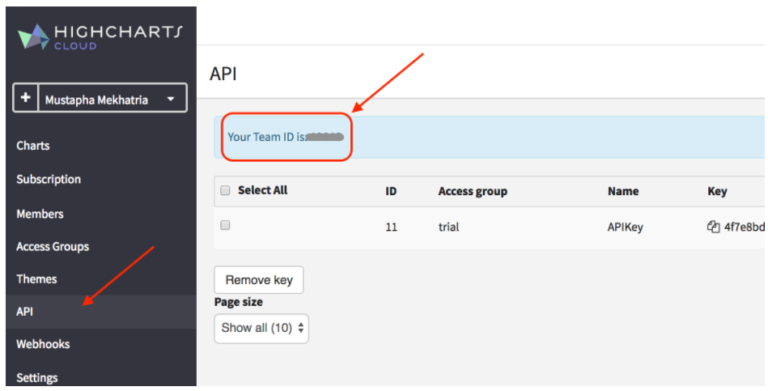
To access the Highchart clouds API key click on this link.
app.listen() is used to start our HTTP server, and we connect to the database using the connect method on the mongoose module (mongooose.connect(‘mongodb://’ + DBlogin + ‘:’ + DBPwd + DBLink);).
To retrieve data from MongoDB, I need to create the schema used for the Chart model:
var chartSchema = new Schema({
  entity_id: String,
  title: Object,
  data: Array
});
Technically, the only fields I need from the database are title and data, but I had to add the code>entity_id, as mLab creates it by default. Otherwise, I could not read the data properly.
Now, it is time to get serious. The front-end sends requests to myServer using Ajax. Here is a description of the API:
/readDataFromDBto read data from the database./sendToHCCloudbuilds a chart from the retrieved data, and uses it to create a chart in Highcharts Cloud./duplicateChartto duplicate the previously created chart./deleteChartto delete the previously created chart.
The last three API routes have the same structure, so let’s focus on the first and second requests.
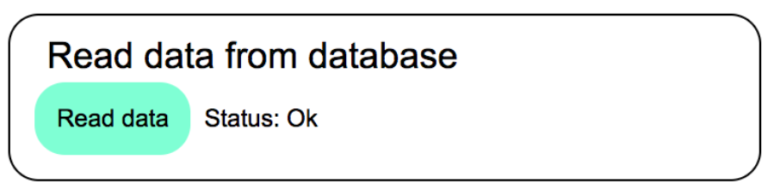
Read Data From the Database
Keep in mind that all requests are posted via the front-end (index.html). For instance, once the button Read data is clicked on the index.html, the app.js sends an Ajax request to myServer using the API route /readDataFromDB. myServer receives the request, and executes the handler we have set up for that route:
app.get('/readDataFromDB', function(reqUp, resUp) {
  Chart.find({}, function(err, data) { //Data represents the data fetched from the DB
    if (err) {
      return resUp.send({
        status: err
      });
    }
    console.log("Read from db: success");
    //Copy the title
    dataToSendObject.data.options.title.text = data[0].title;
    //Copy the data series
    dataToSendObject.data.options.series[0].data = data[0].data;

    //send status
    resUp.send({
      status: "Ok"
    });
  });
});
The handler uses the Chart.find() method to fetch the data from the database and stores the result in dataToSendObject. Then a status result is sent back to the app.js, which is used by the front-end to display a message using the label with the id readDataFromDBLabelTitle:
Remark
The query gets all data stored in the database, but only the first element is read and processed:
    dataToSendObject.data.options.title.text = data[0].title;
    dataToSendObject.data.options.series[0].data = data[0].data;
Cool, right?
Create Chart
Clicking on the Send/create chart button performs an Ajax request to myServer using the /sendToHCCloud route. The request handler for it looks like this:
app.get('/sendToHCCloud', function(reqUp, resUp) {
  //Set up request configuration
  var setChart = {
    url: 'https://cloud-api.highcharts.com/team/' + teamID + '/chart/',
    method: 'POST',
    headers: {
      'x-api-key': APIKey
    },
    json: true,
    body: dataToSendObject,
  };
  request(setChart, function(err, res, body) {
    if (!err && res.statusCode == msgCodeOk) {
      console.log("Create chart on Highcharts cloud:success");
      //save the chart id
      console.log("chart_id: " + body.chart_id);
      chartID = body.chart_id;
      resUp.send({
        status: res.statusMessage
      });
    } else {
      resUp.send({
        status: res.statusMessage
      });
    }
  });
});
I use requests to communicate with the Highcharts Cloud API. A request is sort of like an Ajax function for the backend – it performs an HTTP request to an external server. It accepts two arguments – a configuration object, and a handler function that’s executed when the request has been performed.
In the code above, I use the /team/:teamID/chart route, which creates a new chart for a given team. This is a POST route, so it’s important that the method/verb is set correctly when performing the request.
Also, note that the API key is part of the request (see the setChart object). The key is set as a special header on the request. The payload is set on the body attribute.
After creating our options object, I call the request() function to perform the request and then read back the chart id (generated by Highcharts Cloud), and request status.
Remark
To send and receive JSON data don’t forget to set the property json to true.
Now that you understand how the architecture and how the code works, it is time to do some practice.
Practice
Follow these steps:
1. Download the code
To get the demo app, go to this link on GitHub, and copy or clone the project.
Then, go to where you saved the project, open the folder, and create a config.json file and add your credentials.
Install the packages
Open a terminal, navigate to the folder you downloaded the code to, and type npm install and press Enter to install the module dependencies. To open a terminal on OSX press command + space and write terminal, to open one on windows, press Win+R, write cmd and hit enter. To navigate to the right folder in the terminal, write cd .

3. Start the application
Launch the server by typing: node myServer.js

Open your Highcharts Cloud account, then go to the Charts section to see the result of the application operations.

Open a new window or tab in your web-browser and go to http://127.0.0.1:3000. Click one button at a time, and wait for the status label to update before clicking on the next button in this sequence:
- Read data.
- Check the command line result and the label status.
- Send/create chart.
- Check the command line result, the label status, and the Highcharts Cloud Charts’ section.
- Duplicate chart.
- Check the command line result, the label status, and the Highcharts Cloud Charts’ section.
- Delete chart.
- Check the command line result, the label status, and the Highcharts Cloud Charts’ section.
If everything went OK, you should have the following results:
Well, that is it! Now, you know how to use Highcharts Cloud API using an application
I’d love to hear what your experience is with the Highcharts Cloud API. Feel free to share your comments/questions/requests below.
Published at DZone with permission of Mustapha Mekhatria. See the original article here.
Opinions expressed by DZone contributors are their own.
Comments