

Optimizing Java Back-End Performance Profiling and Best Practices
Java performance profiling helps identify bottlenecks and apply best practices to improve backend speed, efficiency, and scalability.
 ·
·
Join the DZone community and get the full member experience.
Join For FreeThe dashboard turned red at weekday. Our order processing API latency jumped from fifty milliseconds to five seconds. Customer support tickets flooded in. Users reported timeouts during checkout. The infrastructure team scaled up the Kubernetes pods, but the issue persisted. CPU usage sat at 100 percent across all nodes. We were throwing hardware at a software problem. This approach failed miserably.
In this article, I will share how we diagnosed the bottleneck. I will explain the profiling tools we used. I will detail the code changes that restored performance. This is not a theoretical guide. It is a record of a real production incident and the steps we took to resolve it.
The Incident Silent Degradation
Our backend was built on Spring Boot with Hibernate. It handled complex transaction logic for a retail platform. The system worked fine during development. Load testing showed acceptable results. However, production traffic patterns differed significantly from our tests. Users browsed catalogs for hours before purchasing. This created long-lived sessions and large heaps. The garbage collector struggled to keep up. We noticed frequent stop-the-world pauses in the logs. These pauses coincided with the latency spikes.
We initially suspected database locks. We checked slow query logs. The queries looked efficient. Indexes were in place. Connection pool usage was normal. This ruled out the database as the primary culprit. We then looked at the application layer. Thread dumps showed many threads in a WAITING state. They were waiting for locks or IO. This pointed towards contention or resource exhaustion within the JVM.
Profiling Strategy: Stop Guessing
We stopped guessing and started profiling. Guessing leads to wasted time. Profiling provides data. We enabled Java Flight Recorder (JFR) in production. JFR has low overhead and captures detailed runtime events. We recorded a twenty-minute session during peak traffic. We then analyzed the recording using Java Mission Control.
The flame graphs revealed the truth. A significant portion of CPU time was spent in garbage collection. Specifically, the G1GC collector was working overtime. It was trying to reclaim memory, but the allocation rate was too high. We were creating too many short-lived objects. This is known as high object churn. Every request creates thousands of temporary objects. These objects filled the Eden space rapidly. This triggered frequent minor GC cycles.
Root Cause: Hidden Allocations
We traced the allocations back to specific code paths. The biggest offender was a utility method used for data transformation. It converted entity objects to DTOs. The method created new ArrayList instances for every field. It also used string concatenation in loops. These patterns seem harmless in small doses. At scale, they become disastrous.
Here is the problematic code we found.
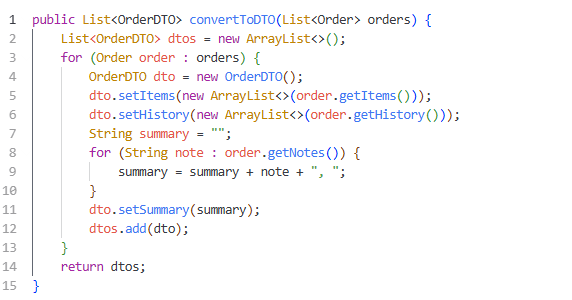
This method allocated memory for every list and every string concatenation. With thousands of orders per minute, the heap filled up instantly. We refactored this code to reduce allocations. We reused collections where possible. We used StringBuilder for string operations.
This change reduced object creation by eighty percent. The GC pressure dropped immediately. Latency returned to normal levels.
Database Interaction Issues
Profiling also revealed issues with Hibernate. We noticed many small queries executing sequentially. This is the N+1 select problem. The parent entity loaded correctly. However, accessing child collections triggered new queries. This happened for every item in the list. Network latency is multiplied by each query.
We fixed this using Entity Graphs. This told Hibernate to fetch related data in a single JOIN. We defined the graph in the repository layer.
This reduced database round-trip times significantly. The CPU usage on the database server also dropped. This showed how backend Java code impacts downstream systems. Optimization is not isolated to one layer.
JVM Tuning and Configuration
Code changes were not enough. We also tuned the JVM flags. The default heap size was too small for our workload. We increased the maximum heap to match the container limits. We also adjusted the G1GC parameters.
We set the initiating heap occupancy percent. This controls when concurrent marking starts. The default is 45 percent. We lowered it to 30 percent. This started GC earlier and prevented full GC pauses. We also enabled logging for GC events. This allowed us to monitor health continuously.
These flags ensured the JVM behaved predictably under load. We tested these settings in staging before applying them to production. Never tune JVM flags without testing. Incorrect settings can worsen performance.
Concurrency and Lock Contention
Thread dumps showed contention on shared resources. We used synchronized blocks for caching. This serialized access created bottlenecks. Multiple threads waited for a single lock. We replaced synchronized blocks with ConcurrentHashMap. This allowed concurrent reads and writes.
We also reviewed our thread pool settings. The default pool size was insufficient. We increased the core pool size based on CPU cores. We set the queue size to prevent unbounded growth. Unbounded queues can lead to OutOfMemoryErrors.
Best Practices for Sustainable Performance
We learned several lessons during this incident. We incorporated them into our development process.
- Profile early: Do not wait for production issues. Profile during development. Use JFR locally to catch high allocation patterns.
- Monitor GC metrics: Track GC pause times and frequency. Set alerts for long pauses. This provides early warning of memory issues.
- Avoid N+1 queries: Always check Hibernate SQL logs. Use JOIN FETCH or Entity Graphs for relationships.
- Minimize allocations: Reuse objects where safe. Avoid creating temporary collections in loops. Use StringBuilder for strings.
- Tune for containers: Ensure JVM flags respect container limits. Use MaxRAMPercentage instead of fixed Xmx values.
- Load test realistically: Simulate production traffic patterns. Long sessions and high concurrency reveal different bugs than simple unit tests.
- Use async processing: Offload heavy tasks to background queues. Do not block HTTP threads for long operations.
Conclusion
Performance optimization is a continuous journey. Our incident taught us that hardware scaling is not a silver bullet. We had to dig into the code and the JVM. Profiling tools gave us the visibility we needed. Code refactoring reduced the load on the garbage collector. Database optimization reduced IO wait times. JVM tuning ensured stable runtime behavior.
The system is now stable. Latency is consistent even during peak traffic. We continue to monitor performance metrics closely. We treat performance as a feature, not an afterthought. Java provides powerful tools for building high-performance backends. We must use them wisely. Happy profiling and keep your systems fast.
Opinions expressed by DZone contributors are their own.
Comments