Overview of the Data Science Pipeline
Interested in undertaking data science projects? Read on for a high-level overview of the data science process and the skills required.
Join the DZone community and get the full member experience.
Join For FreeThis article is a high-level overview of what to expect in a typical data science pipeline. From framing your business problem to creating actionable insights.
The initial step to solving any data science problem is to formulate the questions first that you will use the data to solve.
"Good data science is more about the questions you pose of the data rather than data munging and analysis." — Riley Newman
For example, you have gathered the data from online surveys, feedbacks from regular customers, historical purchase orders, historical complaints, past crises, etc. Now, using these piles of different data you may ask your data to answer the following:
- What should be the realistic sales goals for next quarter?
- What would be the optimal level of stock to have for the coming holiday season?
- What type of measures should the company take to retain customers?
- What can be done to minimize complaints?
- How can we bridge the gap between qualitative and quantitative matrices?
- What can be done to bring more happy customers?
Questions Are Important

The more questions you ask of your data, the more insight you will get. This is how your own data yields hidden knowledge which has the potential to transform your business totally.
The following graphic is the typical pipeline to address any data science problem.

- Getting your data.
- Preparing/cleaning your data.
- Exploration/visualization of data which allows you to find patterns in the numbers.
- Modeling the data.
- Interpreting the findings.
- Re-visiting/updating your model.
Getting Your Data
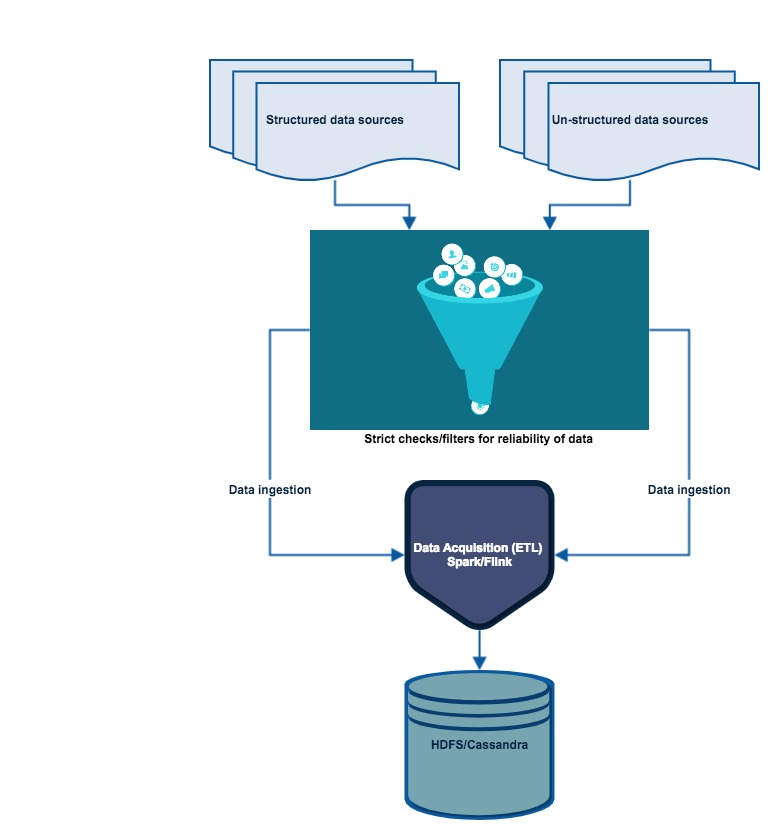
Data science can’t answer any question without data. So, the most important thing is to obtain the data, but not just any data; it must be “authentic and reliable data.” It’s simple, garbage goes in garbage comes out.
As a rule of thumb, there must be strict checks when obtaining your data. Now, gather all of your available datasets (which can be from the internet or external/internal databases/third parties) and extract their data into a usable format (.csv, JSON, XML, etc.).

Skills Required:
- Distributed Storage: Hadoops, Apache Spark/Flink.
- Database Management: MySQL, PostgresSQL, MongoDB.
- Querying Relational Databases.
- Retrieving Unstructured Data: text, videos, audio files, documents.
Preparing/Cleaning Your Data
This phase of the pipeline is very time consuming and laborious. Most of the time data comes with its own anomalies like missing parameters, duplicate values, irrelevant features, etc. So it becomes very important that we do a cleanup exercise and take only the information which is important to the problem asked, because the results and output of your machine learning model are only as good as what you put into it. Again, garbage in-garbage out.
The objective should be to examine the data thoroughly to understand every feature of the data you’re working with, identifying errors, filling data holes, removal of duplicate or corrupt records, throwing away the whole feature sometimes, etc. Domain level expertise is crucial at this stage to understand the impact of any feature or value.

Skills Required:
- Coding language: Python, R.
- Data Modifying Tools: Python libs, Numpy, Pandas, R.
- Distributed Processing: Hadoop, Map Reduce/Spark.
Exploration/Visualization of Data
During the visualization phase, you should try to find out patterns and values your data has. You should use different types of visualizations and statistical testing techniques to back up your findings. This is where your data will start revealing the hidden secrets through various graphs, charts, and analysis. Domain-level expertise is desirable at this stage to fully understand the visualizations and their interpretations.
The objective is to find out the patterns through visualizations and charts which will also lead to the feature extraction step using statistics to identify and test significant variables.

Skills Required:
- Python: NumPy, Matplotlib, Pandas, SciPy.
- R: GGplot2, Dplyr.
- Statistics: Random sampling, Inferential.
- Data Visualization: Tableau.
Modeling the Data (Machine Learning)
Machine learning models are generic tools. You can access many tools and algorithms and use them to accomplish different business goals. The better features you use the better your predictive power will be. After cleaning the data and finding out the features that are most important for a given business problem by using relevant models as a predictive tool will enhance the decision-making process.
The objective of this is to do the in-depth analytics, mainly the creation of relevant machine learning models, like predictive model/algorithm to answer the problems related to predictions.
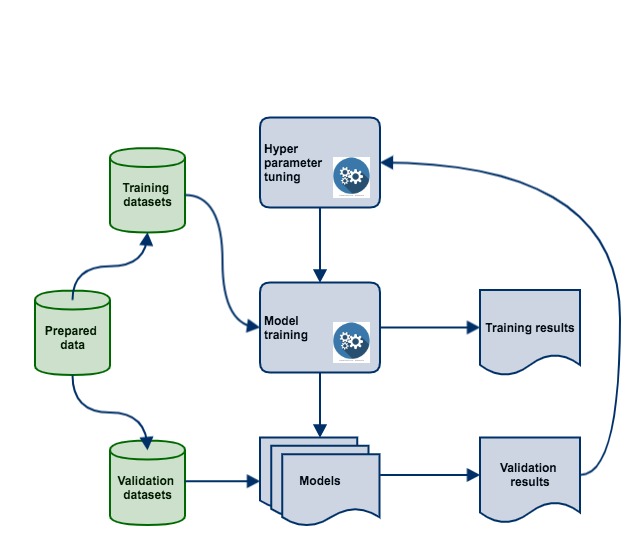
The second important objective is to evaluate and refine your own model. This involves multiple sessions of evaluation and optimization cycles. Any machine learning model can’t be superlative on the first attempt. You will have to increase its accuracy by training it with fresh ingestion of data, minimizing losses, etc.
Various techniques or methods are available to assess the accuracy or quality of your model. Evaluating your machine learning algorithm is an essential part of data science pipeline. Your model may give you satisfying results when evaluated using a metric say accuracy_score but may give poor results when evaluated against other metrics such as logarithmic_loss or any other such metric. Use of classification accuracy to measure the performance of a model is a standard way, however, it is not enough to truly judge a model. So, here you would test multiple models for their performance, error rate, etc., and would consider the optimum choice per your requirements.
Some of the commonly used methods are:
- Classification accuracy.
- Logarithmic loss.
- Confusion matrix.
- Area under curve.
- F1 score.
- Mean absolute error.
- Mean squared error.

Skills Required:
- Machine Learning: Supervised/Unsupervised algorithms.
- Evaluation methods.
- Machine Learning Libraries: Python (Sci-kit Learn, NumPy).
- Linear algebra and Multivariate Calculus.
Interpreting the Data
Interpreting the data is more like communicating your findings to the interested parties. If you can’t explain your findings to someone believe me, whatever you have done is of no use. Hence, this step becomes very crucial.
The objective of this step is to first identify the business insight and then correlate it to your data findings. You might need to involve domain experts in correlating the findings with business problems. Domain experts can help you in visualizing your findings according to the business dimensions which will also aid in communicating facts to a non-technical audience.
Skills required:
- Business domain knowledge.
- Data visualization tools: Tableau, D3.js, Matplotlib, ggplot2, Seaborn.
- Communication: Presenting/speaking and reporting/writing.
Revisiting Your Model
As your model is in production, it becomes important to revisit and update your model periodically, depending on how often you receive new data or as per the changes in the nature of the business. The more data you receive the more frequent the updates will be. Assume you’re working for a transport provider company and, one day, fuel prices went up and the company had to bring out the electric vehicles in their stable. Your old model doesn’t take this into account and now you must update the model that includes this new category of vehicles. If not, your model will degrade over time and won’t perform as well, leaving your business to degrade too. The introduction of new features will alter the model performance either through different variations or possibly correlations to other features.
In Summary
Identify your Business Problem and put questions.
Obtain the relevant data from authentic and reliable sources.
Obtain your data, clean your data, explore your data with visualizations, model your data with different machine learning algorithms, interpret your data by evaluation, and update your old model periodically.
Most of the impact you analyses make will come from the great features you build into the data platform, not great machine learning algorithms. So, the basic approach is:
Make sure your pipeline is solid, end to end.
Start with a reasonable objective.
Understand your data intuitively.
Make sure that your pipeline stays solid.
So, this is how I look into the data science pipeline. If there is anything that you guys would like to add to this article or if you find any slip-ups, feel free to leave a message and don’t hesitate! Any sort of feedback is truly appreciated. Thanks!
Opinions expressed by DZone contributors are their own.

Comments