Performance of SOAP/HTTP vs. SOAP/JMS
Join the DZone community and get the full member experience.
Join For Freetoday soa is the most prevalent enterprise architecture style. in most cases services (s in soa) are realized using web services specification(s). web services are, in most cases, implemented using http as transport protocol but other options exists. as new architecture style emerges, such as eda, more message friendly transport protocols pops out. in java environments most used is jms. in spite the fact that soap/jms specification is still in draft, jms is supported in all major (java) ws stacks. ibm supports soap/jms bindings in their implementation of jax-rpc framework and recently in jax-ws for websphere application server (was) 7. reason for choosing jms in most cases is reliability. but there are other things that come in mind whether to choose jms or http.
reasons to go with http:
- firewall friendly (web services exposed over internet)
- supported on all platforms (easiest connectivity in b2b scenario)
- clients can be simple and lightweight
reasons to go with jms:
- assured delivery and/or only once delivery
- asynchronous support
- publish/subscribe
- queuing if better for achieving larger scalability and reliability
- better handles temporary high load
- large volume of messages (eda)
- better support in middleware software
- transaction boundary
in soa architecture best practice is to use jms internally (for clients/providers that can easily connect to esb) and http for connecting to outside partners (over internet).
performance report
it will be interesting to compare performance of soap/http and soap/jms services. a few documents on this subject can be found. one of the documents, titled “efficiency of soap versus jms” can be found on the link http://www.unf.edu/~ree/1024ic.pdf. this paper is research paper and compares performance of soap/http to jms system (not soap/jms). it will be interesting to see how soap/http compares to soap/jms using same framework.
test setup
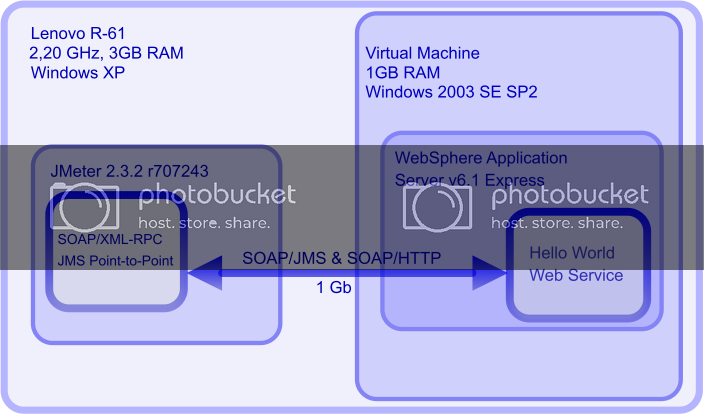
i have created a simple “hello world” web service using jax-rpc. wsdl has soap/http and soap/jms binding and is deployed to websphere application server v6.1 express (was). server was installed in most basic installation (without http server and db2). was default messaging provider (also called sibus) was used for jms. as implementation is the same for both bindings we can measure communication overhead and compare protocols. i have set up only one machine so we can’t compare scalability. that can be read in paper mentioned above. what we can do, we can test protocols with various concurrent requests and different message sizes. as test tool jmeter is used (http://jakarta.apache.org/jmeter/). jmeter is well known load and performance tool. test was performed on laptop lenovo r61 with 3 gb of ram. server was installed in virtual machine and connected with 1gb network with host (private network with host). at all scenarios processer wasn’t used up to 100% percent so speed of network was limiting factor.
to test protocols with different message sizes there are 4 different soap messages. each “hello world” message is simple message with x times hello like: <q0:helloworldrequest><in>hellohellohellohellohello…</in></q0:helloworldrequest>. message sizes are in range from half of kilobyte to 102 kilobytes. the same message was send using http and jms 3 times. response time was measured alternating number of concurrent requests. results of the test can be seen in table below.

we can look the same results using graph representation. bars are colored according to message size and on vertical axis is average response. every test was performed with loop count set to 100 (except the 102kb messages, tests were stopped when average time was stable).
1. single request
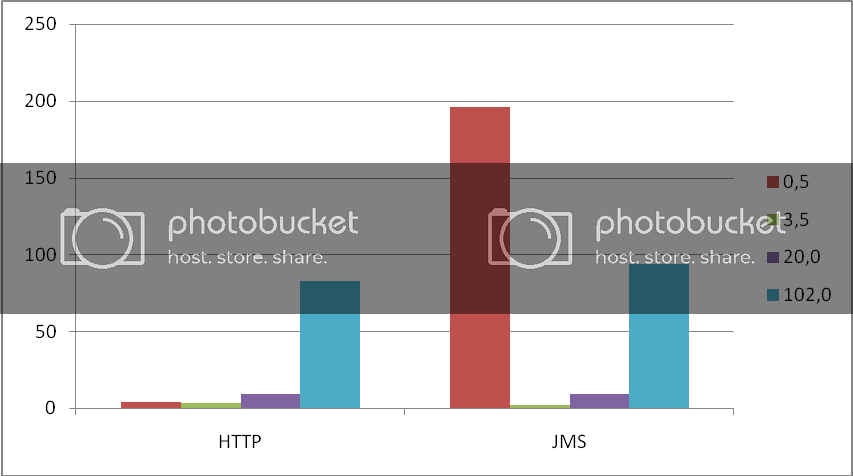
when conducting test with only one request we can see some strange results. differences between http and jms are not big, in all scenarios but first. i believe that first request was taking 196 ms because jmeter needed to create initialcontext and fetch queue connection factory and queues from jndi. however same remark doesn’t fit other message sizes. jmeter probably had resources in its internal cache.
2. 30 concurrent requests
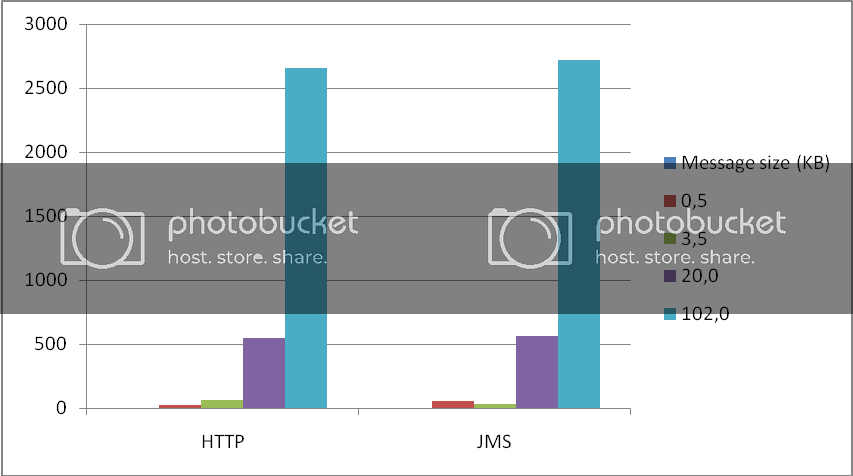
testing performance with 30 conurrent users we can’t see big differences except with really small messages where http is faster and messages with size of 3,5 kb where jms was faster. it looks like penalty for creating jms connection is higher than penalty for creating new http request. strange results are with 3,5 kb messages. it looks like jms likes messages with that size more than http.
3. 100 concurrent requests
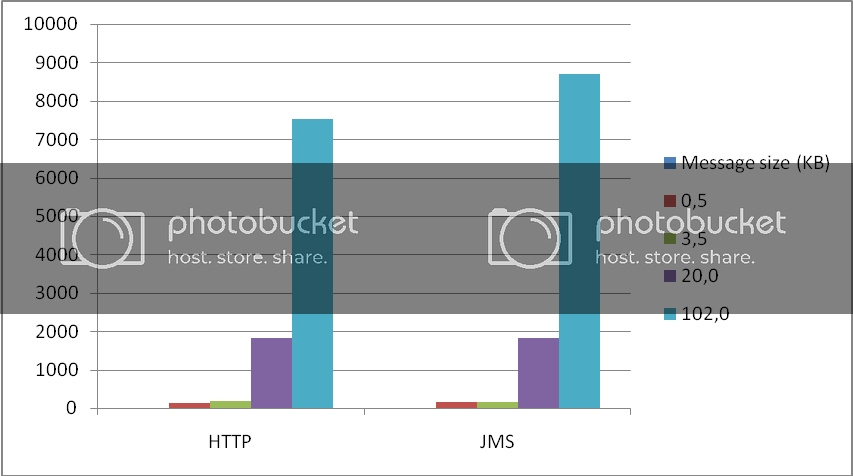
i didn’t put load over 100 concurent requests because it was too much for build in http server in was. if i did, after short amount of time, i was getting errors from jmeter http client. again we can see that jms is little slower then http with all messages except 3,5 kb messages when is actually faster.
4. all together
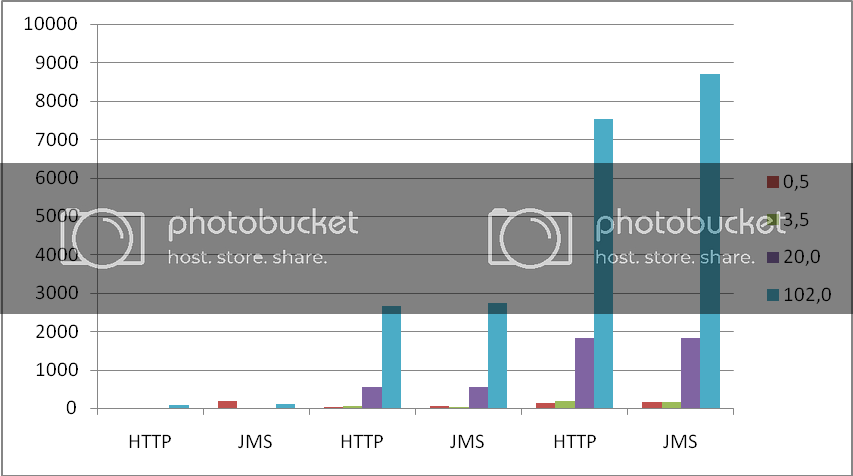
putting all data on one graph we can see that there are no big differences in speed between http and jms. choosing one or other should be decided based on non-functional requirements other then performance.
miroslav rešetar
mresetar@gmail.com
Opinions expressed by DZone contributors are their own.

Comments