Predicting Ad Viewability With XGBoost Regressor Algorithm
This article explores how data-driven decision-making enhances digital advertising, focusing on predicting ad viewability rates using machine learning.
Join the DZone community and get the full member experience.
Join For FreeExtracting insights from data and leveraging them in decision-making processes is becoming increasingly prevalent. Today, this approach enables impactful actions across various domains, including digital advertising. In the world of digital advertising, interactions between users exposed to ads and the platforms displaying those ads hold critical importance.
Matches between advertisers and publishers are facilitated by auctions conducted within milliseconds on demand-side platforms (DSPs) and supply-side platforms (SSPs). Accurate matching is vital for both user satisfaction and revenue management. One of the most important KPIs in this regard is the ad viewability rate.
Delivering the right ads to the right audience plays a significant role in maximizing advertising budget efficiency and improving user satisfaction. In this article, we’ll develop a machine learning model to predict ad viewability rates. We’ll use the highly effective XGBoost Regressor algorithm for this task.
Modeling Process
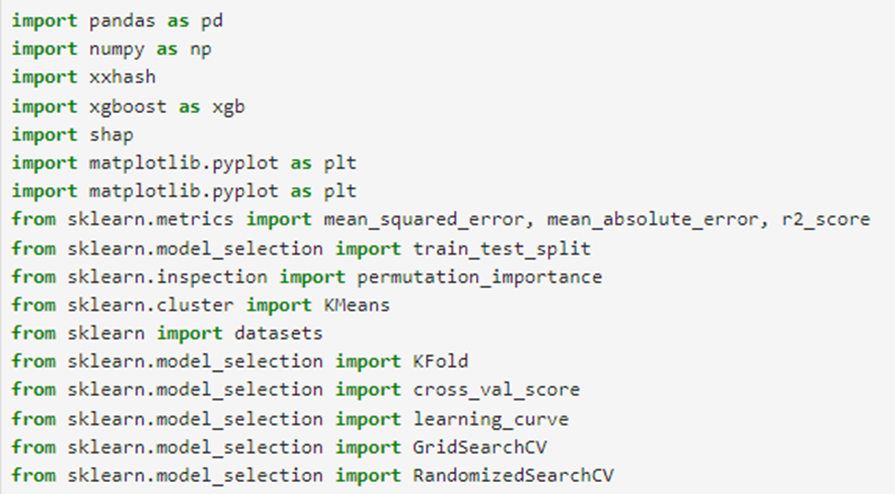
1. Importing Libraries
The first step is to import the Python libraries we’ll use in our project. If you encounter any missing libraries, you’ll need to install them using the pip install command.
2. Preparing the Data
Next, we import the dataset we’ll use in our model.

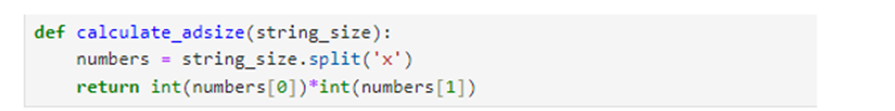
After importing the data, several preprocessing steps are required. For example, the creative_adsize variable, which represents ad sizes, is initially a categorical variable (e.g., "640x480"). However, since ad size significantly influences the target variable, we transform this feature into a numerical format to enhance the model's understanding of ad dimensions.
Additionally, we identify and remove outliers within variable values and handle missing data by imputing the mean or applying other appropriate methods based on the variable's characteristics.
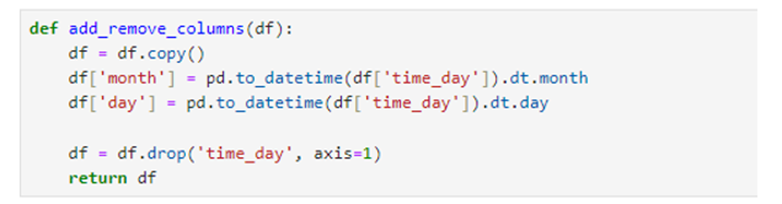
We also derive month and day variables from the date feature, as seasonal effects and factors like the beginning or end of the month may influence ad viewability rates.
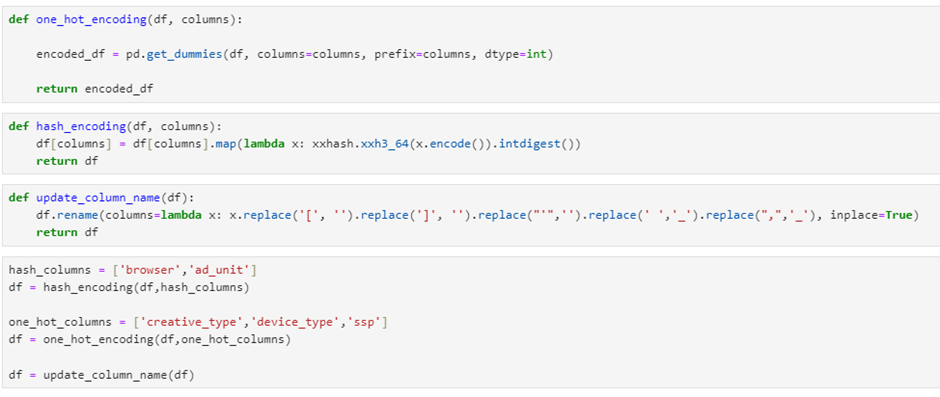
To include categorical variables in our model, we perform encoding:
- One-hot encoding. Applied to variables with a limited number of categories, such as
creative_type, SSP, anddevice_type. - Hash encoding. Used for variables with a larger number of categories, such as browser and
ad_unit.
The final set of features in our model includes:
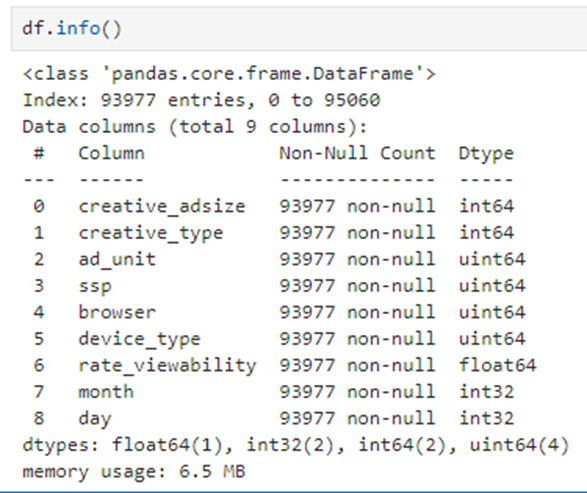
The column’s descriptions are:
| Variables | descriptions |
|---|---|
|
Creative_adsize |
Advertisement’s size. |
|
Creative_type |
Advertisement type, for example, image or video. |
|
Ad_unit |
Advertisement’s placement ID in the website. |
|
Ssp |
Supply side platform. |
|
Browser |
User’s website browser. |
|
Device_type |
User’s device type, for example, phone, personal computer, tablet. |
|
Rate_viewability |
The target variable in this model shows the advertisement’s rate of viewability. |
|
Month |
The month of the user’s visit. |
|
Day |
The day of the user’s visit. |
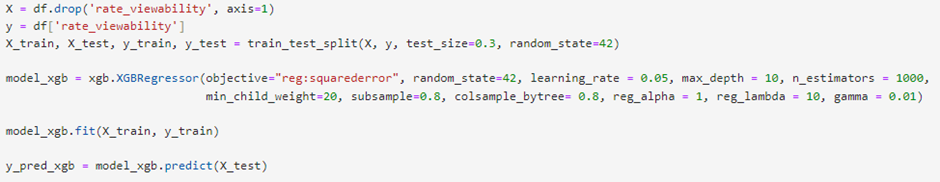
3. Training the Model
After completing the encoding and feature engineering process, we split the data into training and testing sets. Also, the XGBoost algorithm includes numerous parameters designed to improve the model's ability to generalize better.
To determine which parameter values are most suitable for your specific dataset and task, you can use hyperparameter optimization methods such as Grid Search, Random Search, or Bayesian Optimization. These methods help systematically explore different parameter combinations to find the optimal settings that balance model performance and prevent overfitting.
4. Evaluating Model Performance
To evaluate the model's performance, we use metrics like Mean Squared Error (MSE) and R².
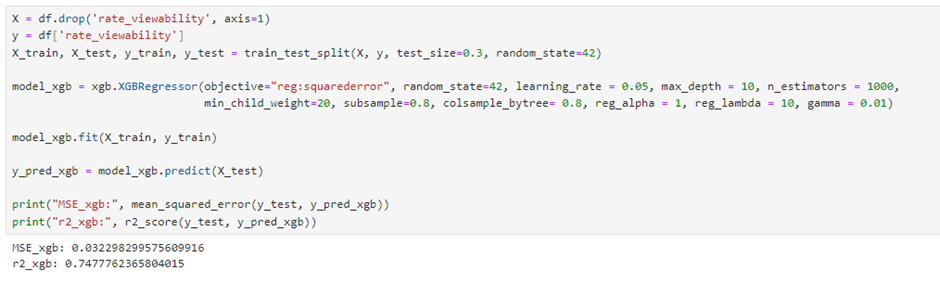
When evaluating R² and Mean Square Error scores, we expect the R² value to be high and the Mean Square Error to be low. However, an excessively high R² value is not always a good result, as the model might be overfitting. This aspect should also be considered, and we will discuss how to assess the risks of overfitting and underfitting in this text.
An R² value of 0.74 currently seems sufficient for our model. Our MSE value is also 0.03, which is not bad. To improve the results, we can increase the dataset size, add new features, or fine-tuning model parameters for better performance.
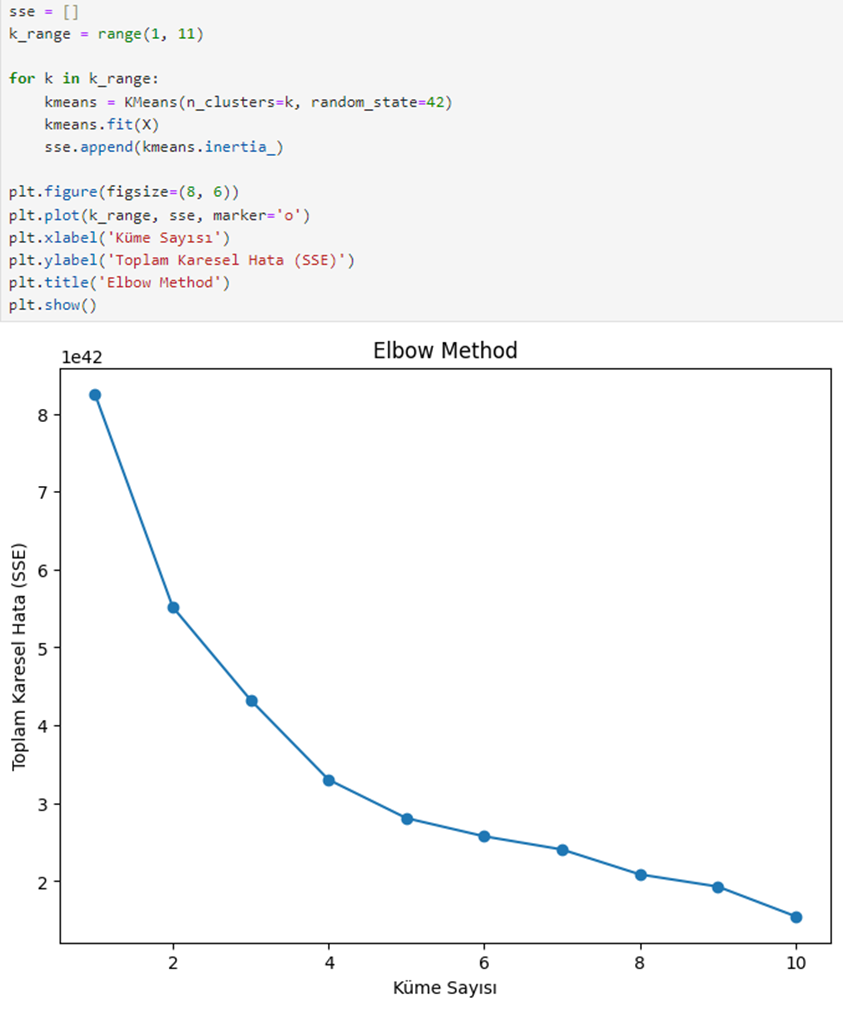
To ensure the model performs consistently across different samples, we use K-Fold Cross Validation. We determine the optimal value of K using the Elbow Method, setting K to 4.
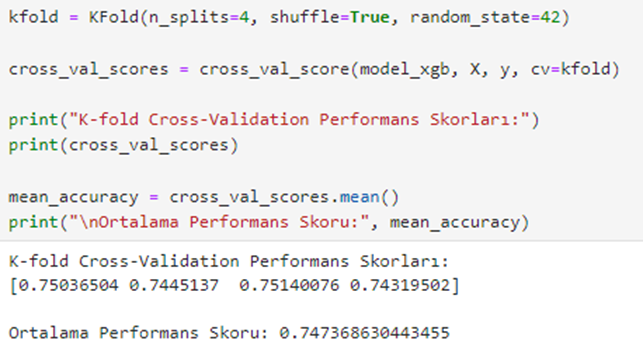
For all 4 folds, we observe a balanced distribution of R² scores. They are 0.75, 0.74, 0.75, and 0.74.
If our test results using k-cross validation had been unbalanced, the clusters with values significantly different from the model's R² value would have needed to be examined separately.
5. Feature Importance Analysis
To understand which variables have the most significant impact on the model, we use the Permutation Importance method. This analysis helps visualize how independent variables affect the dependent variable.
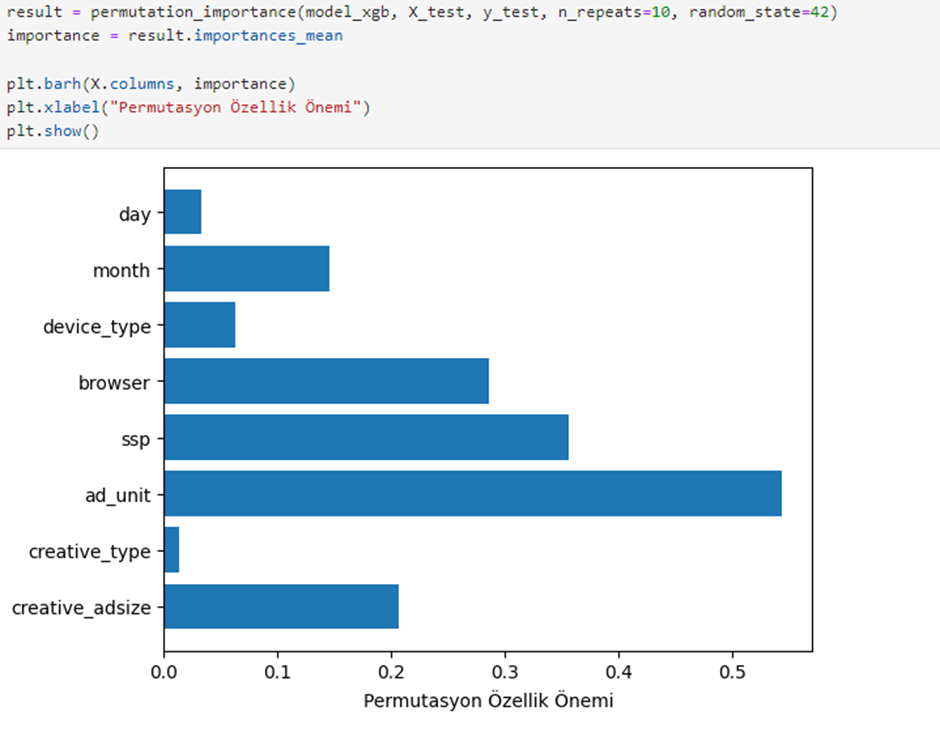
Using the Permutation Importance method, we find that the most impactful features are ad_unit, SSP, browser, creative_adsize.
Meanwhile, the least impactful features include month, device_type, day, and creative_type.
To analyze which feature has a greater impact on model performance, there are methods other than the Permutation method. Gain, Weight, and SHAP are some of them. If a detailed analysis is needed, SHAP values can be used.
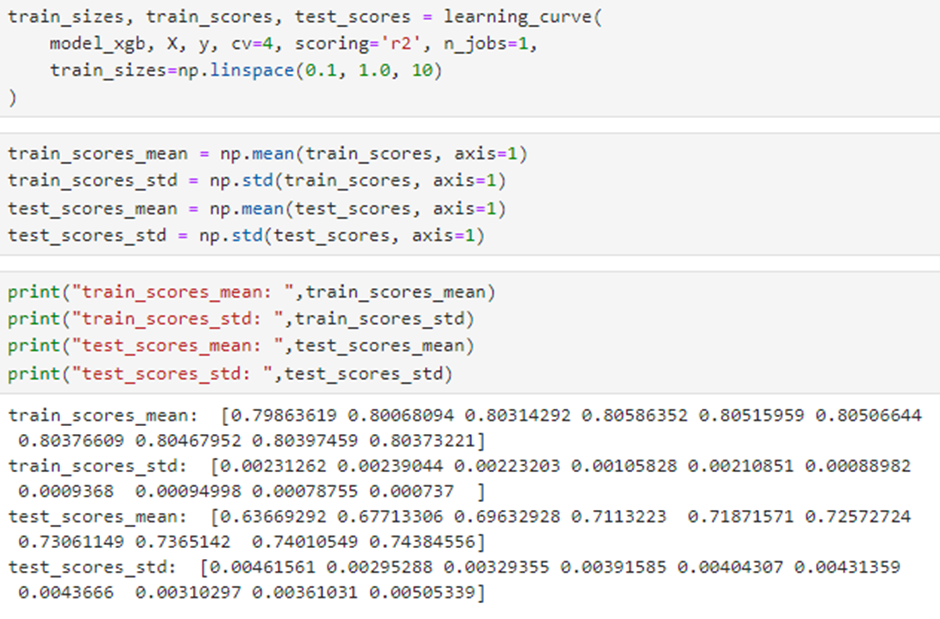
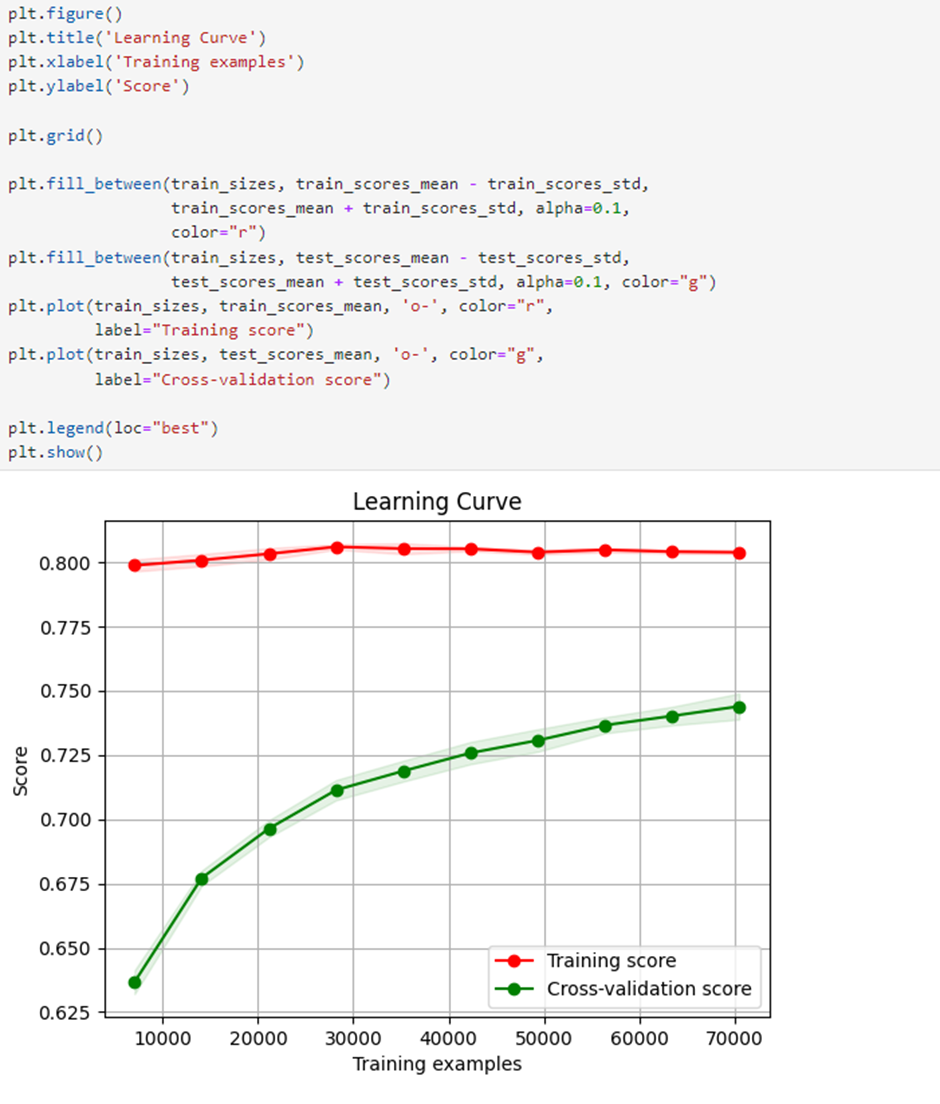
6. Overfitting and Underfitting Checks
To check if the model suffers from overfitting or underfitting, we use Learning Curve Analysis. The visualizations show no signs of overfitting or underfitting. Moreover, the test model performance improves as the data size increases.
Although there is overfitting at the beginning, as the amount of data increases, we see that the overfitting decreases and the model generalizes better.
Conclusion
In this article, we developed a model to predict ad viewability rates using the XGBoost Regressor algorithm. We hope this study proves helpful for you as well. Feel free to share your thoughts and questions!
Opinions expressed by DZone contributors are their own.
Comments