How to Prevent Your Java Collections From Wasting Memory
Wondering about the memory impact of your Java collections? Here's how to think about your collections while keeping overhead in mind.
Join the DZone community and get the full member experience.
Join For FreeJDK collections are the standard library implementations of lists and maps. If you look at a memory snapshot of a typical big Java app, you will see thousands or even millions of instances of java.util.ArrayList, java.util.HashMap, etc. Collections are indispensable for in-memory data storage and manipulation. But did you ever consider whether all of the collections in your app use memory optimally? To put it differently: if your Java application crashed with the infamous OutOfMemoryError or experienced long GC pauses — did you check its collections for memory waste? If your answer is "no" or "not sure", then read on.
First, note that the internals of JDK collections are not magic. They are written in Java. Their source code comes with the JDK, so you can open it in your IDE. It can also be easily found on the web. And, as it turns out, most of the collections are not very sophisticated when it comes to optimizing memory footprint.
Consider, for example, one of the simplest and most popular collection classes: java.util.ArrayList. Internally each ArrayList maintains an Object[] elementData array. That's where the elements of the list are stored. Let's see how this array is managed.
When you create an ArrayList with the default constructor, i.e. invoke new ArrayList(), elementData is set to point to a singleton shared zero-size array (elementData could as well be set to null, but a singleton array provides some minor implementation advantages). Once you add the first element to the list, a real, unique elementData array is created, and the provided object is inserted into it. To avoid resizing the array every time a new element is added, it is created with length 10 ("default capacity"). Here comes a catch: if you never add more elements to this ArrayList, 9 out of 10 slots in the elementData array will stay empty. And even if you clear this list later, the internal array will not shrink. The diagram below summarizes this lifecycle:

How much memory is wasted here? In absolute terms, it's calculated as (object pointer size) * 9. If you use the HotSpot JVM (which comes with the Oracle JDK), pointer size depends on the maximum heap size (see https://blog.codecentric.de/en/2014/02/35gb-heap-less-32gb-java-jvm-memory-oddities/ for the details). Normally, if you specify -Xmx less than 32 gigabytes, pointer size is 4 bytes; for bigger heaps, it's 8 bytes. So an ArrayList initialized with the default constructor, with only one element added, wastes either 36 or 72 bytes.
In fact, an empty ArrayList wastes memory too, because it doesn't carry any workload, yet the size of an ArrayList object itself is non-zero and bigger than you probably think. That's because, for one thing, every object managed by the HotSpot JVM has a 12- or 16-byte header, that is used by the JVM for the internal purposes. Next, most collection objects contain the size field, a pointer to the internal array or another "workload carrier" object, a modCount field to keep track of contents modifications, etc. Thus even the smallest possible object representing an empty collection will likely need at least 32 bytes of memory. Some, like ConcurrentHashMap, take a lot more.
Consider another ubiquitous collection class: java.util.HashMap. Its lifecycle is similar to that of ArrayList and is summarized below:

As you can see, a HashMap containing only one key-value pair wastes 15 internal array slots, which translates into either 60 or 120 bytes. These numbers are small, but what matters is how much memory is lost by all collections in your app relative terms. And it turns out that some applications can waste a lot in this way. For example, several popular open-source Hadoop components that the author analyzed, lost around 20 percent of their heap in some scenarios! For products developed by less experienced engineers and not regularly scrutinized for performance, memory waste may be even higher. There are enough use cases where, for example, 90% of nodes in a huge tree contain only one or two children (or none at all), and other situations where the heap is full of 0-, 1- or 2-element collections.
If you discover unused or underutilized collections in your app, how do you fix them? Below are some common recipes. Here our problematic collection is assumed to be an ArrayList referenced by the Foo.list data field.
If most of the instances of list are never used, consider initializing it lazily. Thus the code that previously looked like...
void addToList(Object x) {
    list.add(x);
}
...should be refactored into something like
void addToList(Object x) {
  getOrCreateList().add(x);
}

private list getOrCreateList() {
    // To conserve memory, we don't create the list until the first use
    if (list == null) list = new ArrayList();
    return list;
}
Keep in mind that you will sometimes need to take additional measures to address possible races. For example, if you maintain a ConcurrentHashMap that may be updated by multiple threads concurrently, the code that initializes it lazily should not allow two threads to create two copies of this map accidentally:
private Map getOrCreateMap() {
    if (map == null) {
        // Make sure we aren't outpaced by another thread
        synchronized (this) {
            if (map == null) map = new ConcurrentHashMap();
        }
    }
    return map;
}
If most instances of your list or map contain just a handful of elements, consider initializing them with the more appropriate initial capacity, e.g.
list = new ArrayList(4); // Internal array will start with length 4If your collections are either empty or contain just one element (or key-value pair) in most cases, you may consider one extreme form of optimization. It works only if the collection is fully managed within the given class, i.e. other code cannot access it directly. The idea is that you change the type of your data field from e.g. List to a more generic Object, so that it can now point either to a real list, or directly to the only list element. Here is a brief sketch:
// *** Old code ***
private List<Foo> list = new ArrayList<>();

void addToList(Foo foo) { list.add(foo); }

// *** New code ***

// If list is empty, this is null. If list contains only one element,
// this points directly to that element. Otherwise, it points to a
// real ArrayList object.
private Object listOrSingleEl;

void addToList(Foo foo) {
    if (listOrSingleEl == null) { // Empty list
        listOrSingleEl = foo;
    } else if (listOrSingleEl instanceof Foo) { // Single-element
        Foo firstEl = (Foo) listOrSingleEl;
        ArrayList<Foo> list = new ArrayList<>();
        listOrSingleEl = list;
        list.add(firstEl);
        list.add(foo);
    } else { // Real, multiple-element list
        ((ArrayList<Foo>) listOrSingleEl).add(foo);
    }
}
Obviously, such an optimization makes your code less readable and more difficult to maintain. But if you know that you will save a lot of memory in this way, or will get rid of long GC pauses, it may be worthwhile.
And this probably already made you think: how do I know which collections in my app waste memory, and how much?
The short answer is: this is hard to find out without proper tooling. Attempting to guess the amount of memory used or wasted by data structures in a big, complex application almost never works. And without knowing exactly where the memory goes, you may spend a lot of time chasing the wrong targets while your application stubbornly keeps failing with OutOfMemoryError.
Thus, you need to inspect your app's heap with a tool. From experience, the most optimal way to analyze the JVM memory (measured as amount of information available vs. the tool's impact on application performance) is to obtain a heap dump and then look at it offline. A heap dump is essentially a full snapshot of the heap. It can be either taken at an arbitrary moment by invoking the jmap utility, or the JVM can be configured to produce it automatically if it fails with OutOfMemoryError. If you Google for "JVM heap dump", you will immediately see a bunch of articles explaining in detail how to obtain a dump.
A heap dump is a binary file of about the size of your JVM's heap, so it can only be read and analyzed with special tools. There is a number of such tools available, both open-source and commercial. The most popular open-source tool is Eclipse MAT; there is also VisualVM and some less powerful and lesser-known tools. The commercial tools include the general-purpose Java profilers: JProfiler and YourKit, as well as one tool built specifically for heap dump analysis called JXRay (disclaimer: the author has developed the latter).
Unlike the other tools, JXRay analyzes a heap dump right away for large number of common problems such as duplicate strings and other objects, as well as suboptimal data structures. The problems with collections described above fall into the latter category. The tool generates a report with all the collected information in HTML format. The advantage of this approach is that you can view the results of analysis anywhere at any time and share it with others easily. It also means that you can run the tool on any machine, including big and powerful, but "headless" machines in a data center.
JXRay calculates the overhead (how much memory you would save if you get rid of a particular problem) in bytes and as a percentage of used heap. It groups together collections of the same class that have the same problem...

...and then groups problematic collections that are reachable from some GC root via the same reference chain, as in the example below
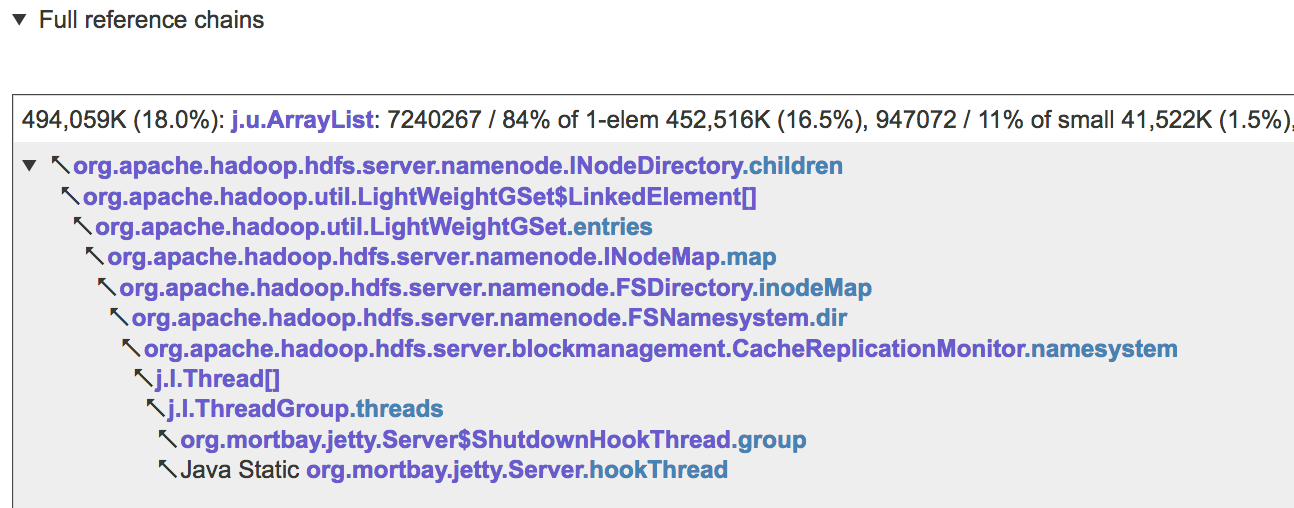
Knowing what reference chains and/or individual data fields (e.g. INodeDirectory.children above) point to collections that waste most memory, allows you to quickly and precisely pinpoint the code that is responsible for the problem, and then make the necessary changes.
In summary, suboptimally configured Java collections may waste a lot of memory. In many situations, this problem is easy to address, but sometimes, you may need to change your code in non-trivial ways to achieve a significant improvement. It is very difficult to guess which collections need to be optimized to make the biggest impact. To avoid wasting time optimizing wrong parts of the code, you need to obtain a JVM heap dump and analyze it with an appropriate tool.
If you enjoyed this article and want to learn more about Java Collections, check out this collection of tutorials and articles on all things Java Collections.
Opinions expressed by DZone contributors are their own.
Comments