Profiling With JVisualVM
Learn more about profiling with the JVisualVM!
Join the DZone community and get the full member experience.
Join For FreeA few days back, I faced an issue on one of the Java service-hosted servers. The server load, resource consumption, and response time of service were too high.
Everyone was under the impression that the latest deployment of the JAR caused this issue, whereas the service code and performance on the local machine looked fine.
To be sure, we need data for the latest deployment to not cause this issue — that's where the use case of JVisualVM comes.
What Is the JVisualVM?
This is one of the useful, free utilities that come in the JDK bundle. It's basically a JMX client application. This utility shows stats like memory used, heap data, garbage collector, and CPU profiling.
It helps us to improve the application performance after analyzing memory leaks, heap data, and CPU consumption
With features like thread analysis and head dump analysis, it is very handy in solving run-time problems, too.
Adding JMX Properties
To enable JVisualVM to collect stats of application hosted on a remote server, we have to run our application with jmx system properties. They are as follows:
com.sun.management.jmxremote.portto specify the port number through which the application will be exposedcom.sun.management.jmxremote.sslto specify whether secure sockets layer (SSL) encryption will be activated to secure the connection to the applicationcom.sun.management.jmxremote.authenticateto specify whether the connection will be password protected
Jar command looks like:
java -jar -Dcom.sun.management.jmxremote.port=1098 -Dcom.sun.management.jmxremote.authenticate=false -Dcom.sun.management.jmxremote.ssl=false my-service.jar
Running JVisualVM on a Local Machine
I am an Ubuntu user and jvisualvm is available at:
/usr/lib/jvm/java-8-oracle/bin/jvisualvm
We can run jvisualVM using the following command in bash terminal as follows:

The application will launch as follows:

Create SOCKS Proxy Connection
The SOCKS proxy can be created either by SOCKS client or ssh utility on Linux.
We usedthe following command to create a secure tunnel between localhost and remote server:
ssh -fN -D 1098 my-username@my-remote-server-IP -pXXXX
-f option forks the process and tunnel create command runs in the background
-N option tells ssh that we don’t send any command once the tunnel setup
completed
-D option used to select the listening port
-p Port to connect to on the remote host
You will be asked password to set up the SOCKS proxy.
Add Proxy Setting in JVisualVM
Use following steps from the tools menu:
Tools->Options->Network – Manual Proxy Settings – check it and configure SOCKS Proxy at localhost and port 1098

Add Remote Host in JVisualVM
Use the following steps from the JVisualVM sidebar.
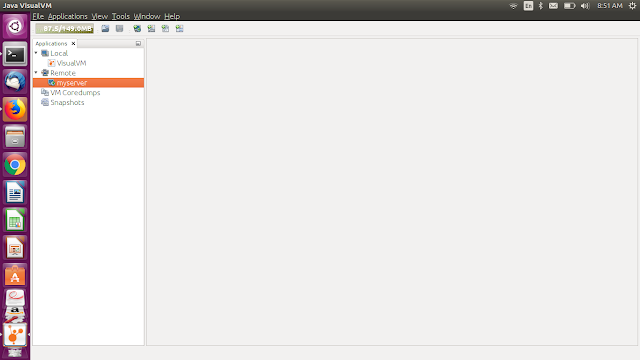
Right click on the remote host -> Add remote host -- Type the IP of the server

Note: I have added display name myserver to hide the serverIP
Add JMX Connection
Use following steps to add the JMX connection
Right click on myserver->Type the jmx port (add 1098)

Note: I have added display name myservice-on-myserver to hide the serverIP.
Collecting Stats
Now, we can analyze the collected stats like CPU usage, system properties, detailed Threads report with access to stack traces, CPU sampling, etc.
Final snapshot will be like as follows:
All the best on your JVisualVM endeavors!
Opinions expressed by DZone contributors are their own.


Comments