Remote Debugging With USB-Based JTAG/SWD Debug Probes
Learn more about remote debugging with the USB-based JTAG/SWD probes.
Join the DZone community and get the full member experience.
Join For FreeFor some projects, it is not possible to have the device under debug available on my desk — the board might be in another room, on another site, or in a place where physical access is not possible or even dangerous. In that case, an IP-based debug probe (see Debugging ARM Cores with IP based Debug Probes and Eclipse) is very useful, as long as I can access its IP address, which works fine. It is an excellent solution even if the board is moving or rotating. You can hook it up to a WLAN access point and still use it as it would be on my desk.
But what if I have a debug probe only connected to USB? This article shows how to turn a USB debug probe into an IP-based debug solution. That way, I can easily debug a board remotely while connected to the network:

IP Based Debugging with USB Debug Probe
But IP-based debug probes are more expensive than USB based ones.

LAN Port
Such a probe is a very good investment, but what if you don't have one available?
Overview
The block diagram below shows how to set up a remote debug connection to a board:

Remote Debugging
A server PC is configured to run a GDB server talking to the local (USB) Debug probe. With this, any host PC with Eclipse and GDB Client can connect to it over TCP/IP and debug the board.
Preconditions
All I need is:
- A SEGGER J-Link or P&E Multilink debug probe. This can handle any external probe or use an evaluation board to debug probe a circuit (e.g. J-Link OpenSDA or P&E OpenSDA)
- A host machine attached to this debug probe. That host machine needs to be accessible on the network
- Eclipse CDT with a J-Link or P&E support, e.g. the GNU MCU Eclipse plugins (they are used e.g. in NXP Kinetis Design Studio) or the NXP MCUXpresso IDE (I'm using 10.3.1 in this article)
Server PC
On the server PC, I need to start the GDB server (see Command Line Debugging with GDB).
For Segger, I can use the JLinkGDBServerCL (Command Line) or JLinkGDBServer (GUI). On Windows, it uses a GUI, which shows the configuration:

J-Link GDB Server Configuration
Then, it will wait for a remote debugger connection:

GDB Server Waiting for Connection
For P&E, I have to start the 'pegdbserver_console':

pegdbserver_console.exe in NXP MCUXpresso IDE 10.3.1
You need to know the hostname (or IP address) of that host machine in the next step. In my case, the host machine has the following IP address: 192.168.0.112.
Host PC
On the Host PC, using Eclipse CDT with the GNU MCU Eclipse plugins, uncheck 'start the J-Link GDB Server locally' and enter the remote IP address (default port is 2331):

Remote Debugging in GNU MCU Eclipse
In MCUXpresso IDE 10.3.1, enter the IP address and use manual server startup with 'start server' option disabled:

Remote Debugging in MCUXpresso IDE 10.3.1
For P&E, there is a similar setting here:
PEMicro Remote GDB Settings
Remote Debugging
With this, I can debug the remote target as it would be connected locally. The SEGGER Server will show the connection status like this:
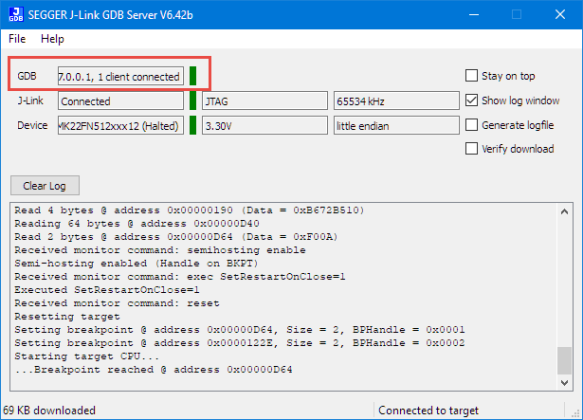
Connected to GDB Server
And with this, I can do some remote debugging:

Remote Debugging with NXP MCUXpresso IDE
Summary
It is very easy to do IP-based remote debugging. I need to run the P&E or SEGGER GDB server on a machine, and then, I can connect from everywhere to that server and debug that board without having physical access to it. This is especially useful with sharing a board on a machine or if that board is not accessible otherwise. The price (instead of using a real IP-based debug probe) is that I need a remote host machine. If there is no IP-based debug probe at hand, this should be a very doable solution. Of course, with high-latency networks, this will impact debug performance, but this is expected.
The approach described here needs a network connection which usually is available inside a company network, but not to the outside world behind the firewalls. For debugging boards beyond the firewall I can use a SEGGER server, see Remote Board Debugging: J-Link Remote Server with Eclipse
Happy IPing!
Links
Published at DZone with permission of Erich Styger. See the original article here.
Opinions expressed by DZone contributors are their own.
Comments