Reporting JSON Data With Couchbase and PowerBI
Using Couchbase and PowerBI to visualize data with native connectivity through N1QL REST API
Join the DZone community and get the full member experience.
Join For Freepowerbi and native json processing
powerbi is one of the great new reporting environments you can use to visualize data. one great advantage of powerbi is its native json support and built-in programmable transformation engine. power-bi can simply directly talk to couchbase server and report on the data. no odbc or jdbc driver required!
visualize data in couchbase server v4 in 4 steps
lets walk through the 3 steps to get your couchbase server data visualized in powerbi:
#1 get some sample data:
i am using the travel-sample bucket that comes with couchbase server 4. install this dataset using the "settings" tab in admin console or during installation. you will be able to follow along with the examples.
#2 query through the n1ql rest api:
i will use a fairly simple query for the sample: this query returns full list of all airlines with their total flights to each destination airport.
  select a.name, r.destinationairport, count(a.name) as total_flights
  from `travel-sample` r join `travel-sample` a on keys r.airlineid
  where r.type ="route" and a.type="airline"
  group by r.destinationairport, a.name
  order by r.destinationairport
to connect powerbi with n1ql. we will use the n1ql rest api to execute the query. some may not know this but n1ql comes with a rest api that takes in an ad-hoc statement. n1ql rest api is documented here and you can use the json aware tool of your choice to directly hit this api. my tool of choice is postman (available on the chrome macketplace as well). n1ql rest api combined with postman gives me the full visability to what's travelling over the wire.
in the following figure, i am hitting a local cluster node on port 8093 with the above query with postman.

we will pass the encoded url to power bi and it looks like this:
http://10.0.0.52:8093/query/service?statement=select%20a.name,r.destinationairport,%20count(a.name)%20total_flights%20from%20`travel-sample`%20r%20join%20`travel-sample`%20a%20on%20keys%20r.airlineid%20where%20r.type%20=%22route%22%20and%20a.type=%22airline%22%20group%20by%20r.destinationairport,%20a.name%20order%20by%20r.destinationairport#3 submit and transform data in powerbi:
last, you need to fire up the desktop version of power bi to get your memory into shape. desktop version is free and is available here .

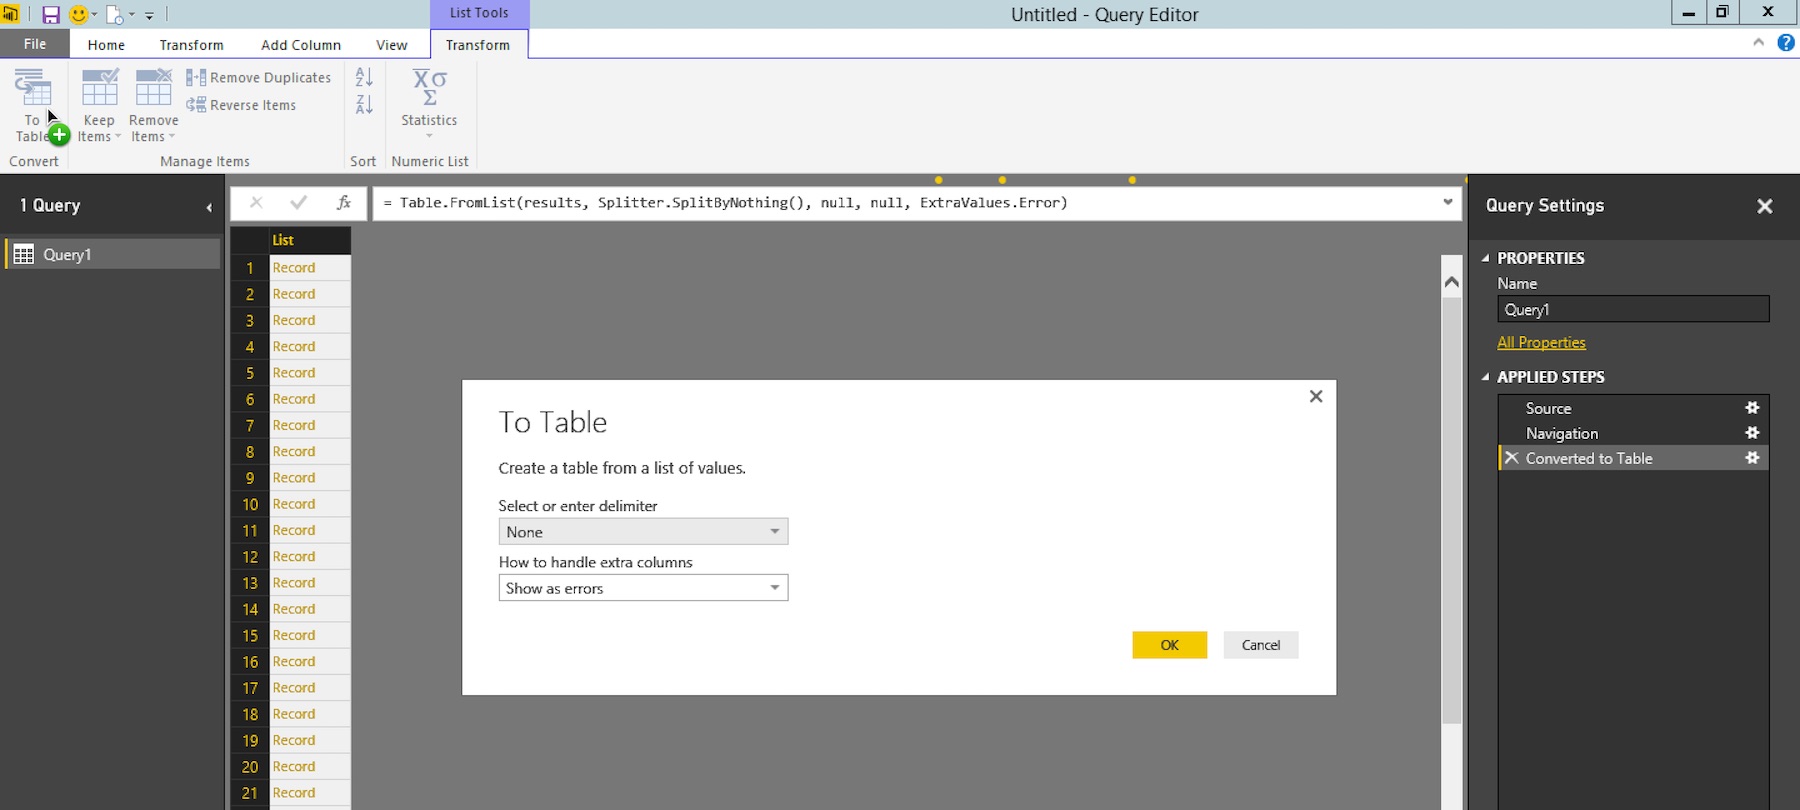
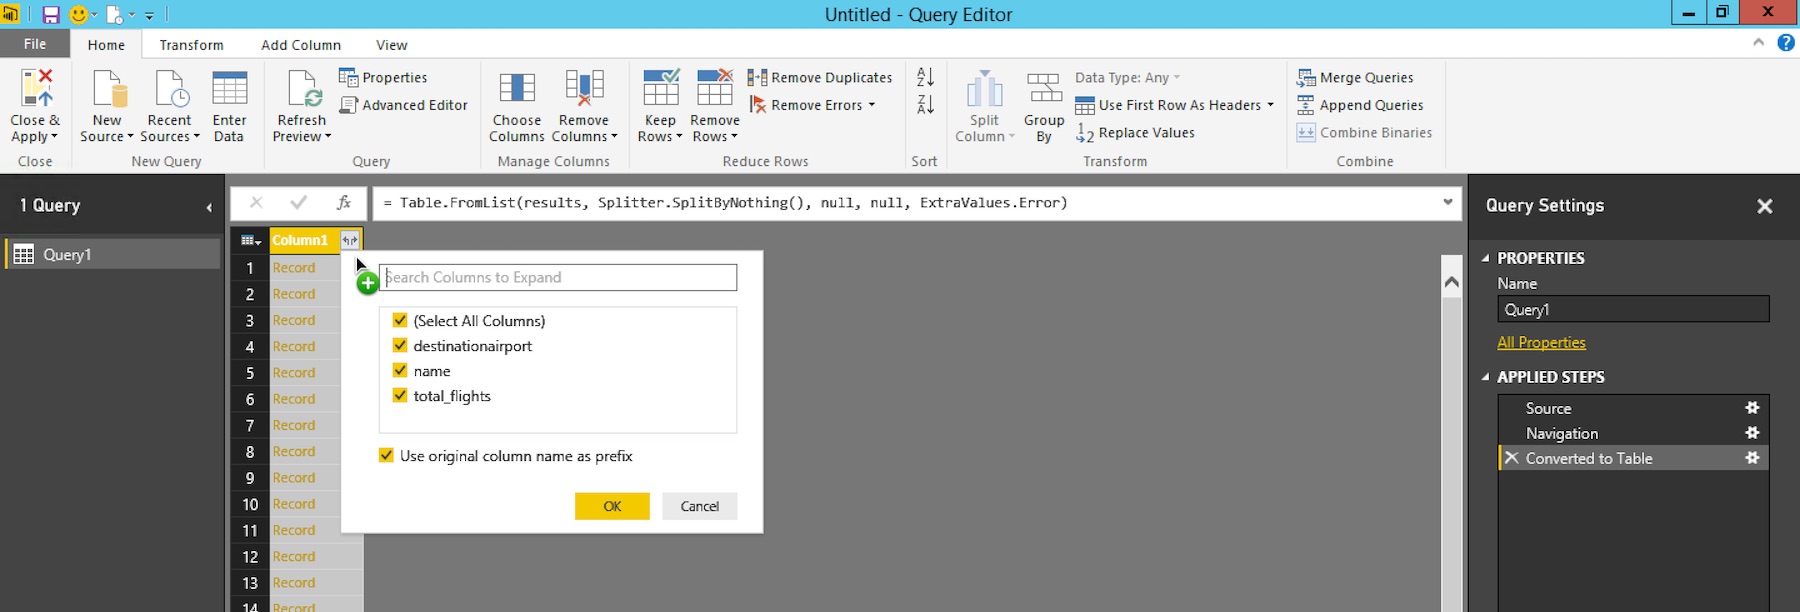
- once the results are streamed into power bi, you will see the json attributes that come back from n1ql. drill into "results" by clicking the "list" link in the screen.

#4 visualize data in powerbi:
i like to use the treemap visualization for displaying the most popular destinations for each airline. to get there,
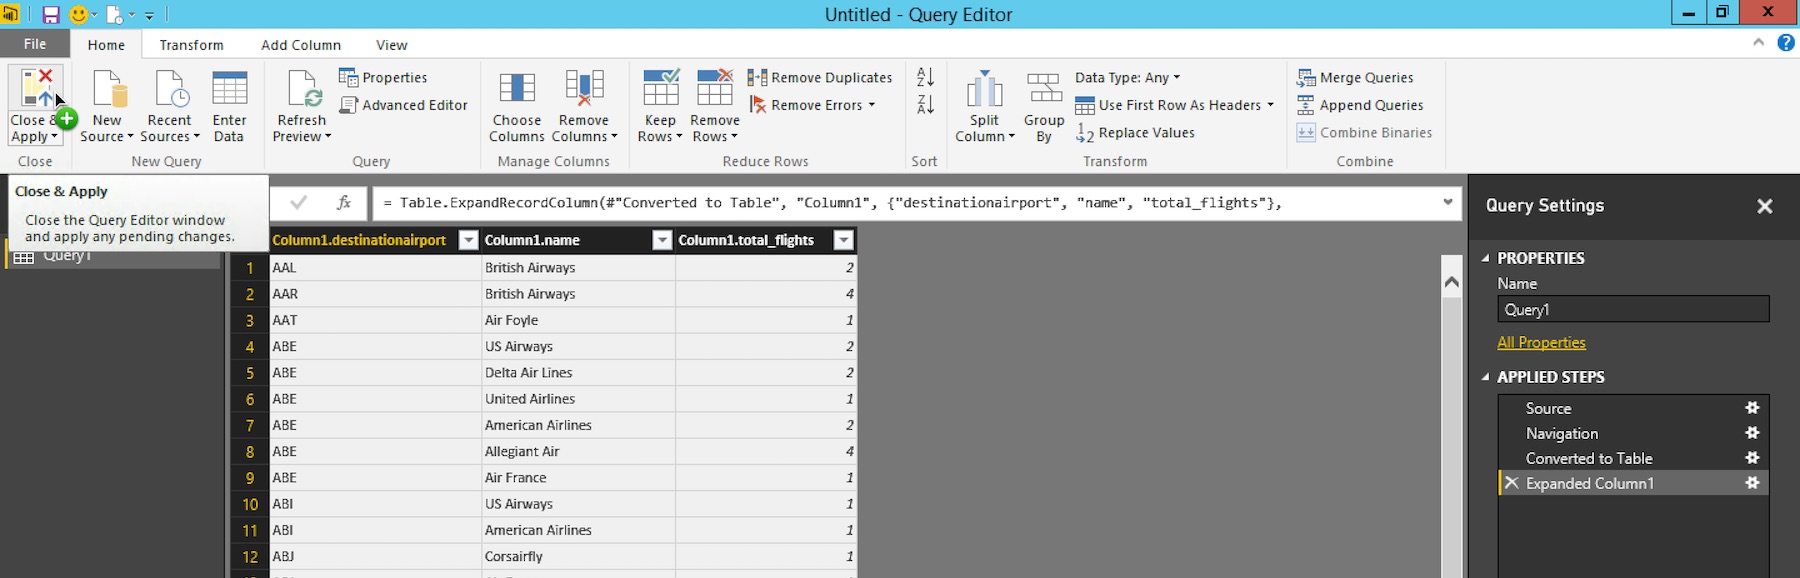
- drag "column1.destinationairport" under group
- drag "column1.total_flights" to values.
- drag "column1.name" to page level filters and expand the field to filter on "air foyle".
you will also modify the data type for total_flights. to get there, there are 2 more clicks. follow the green plus on the figure below.
- change the data type for column total_flights to "whole number".
- change the aggregation on total_flights to "sum".
and you are done!.

previous decades, relational data with tables and columns were the most popular shape. odbc and jdbc provided a great deal of ease to connecto to that data. couchbase server provides this option as well. here is the link to download free odbc and jdbc drivers for couchbase server. however... what i am seeing in todays world is, majority of the new data that is generated and stored is in json. with these changes, the new data visualization platforms are adding powerful support around json. powerbi has done a great job to to make it super easy to work with data in couchbase server without and odbc driver.
Published at DZone with permission of Cihan B.. See the original article here.
Opinions expressed by DZone contributors are their own.
Comments