Why Round-Robin Won't Save You: Load Balancing Challenges in Data Streaming Services With Heterogeneous Traffic
Throughput-based load balancing breaks down when streaming messages have heterogeneous processing costs — the fix is balancing on actual per-partition resource usage.
Join the DZone community and get the full member experience.
Join For FreeIf you've ever run a data streaming service that handles more than one type of workload, you've probably hit a wall that no amount of round-robin tuning can fix. This is a common failure mode in production streaming environments. This post is about the specific ways traditional load-balancing strategies break down when your traffic isn't uniform.
I'll focus on CPU utilization as the primary example throughout, since it's the most common bottleneck in compute-heavy streaming workloads, but the same principles apply to memory, network bandwidth, and other system resources.
What Makes Streaming Services Different
A typical data streaming service ingests messages from an upstream log or message bus, partitions them into logical units of work, and processes each partition on one or more compute instances. An orchestrator may assign partitions to compute instances and attempt to keep the load even.
On paper, this sounds like any other load-balancing problem. In practice, it's trickier. The load balancer operates on observable proxy metrics - bytes per second, messages per second, number of assigned partitions - while the actual bottleneck can often be the resource consumption per partition.
In a perfectly homogeneous world, these proxies correlate tightly with actual resource consumption. But the real world is not homogeneous, and the gap between proxy and reality is where all the problems live.
Not All Messages Are Created Equal
The most insidious source of imbalance is heterogeneous processing cost per message. I think of this as the "hidden weight" problem.
Consider a streaming service that processes two classes of workloads. The first class is lightweight messages: each triggers a simple, low-cost operation, and processing cost tracks proportionally with message count or byte volume.
The second class is compute-intensive messages: a single message may trigger operations that are 10-100x more expensive than a lightweight one. The cost depends on domain-specific factors - algorithm complexity, data structure sizes, model inference, and so on.
A load balancer that distributes partitions based on throughput sees these two classes as equivalent if their throughput numbers are similar. Instance A gets six lightweight partitions; Instance B gets five lightweight partitions and one compute-intensive partition. The balancer reports equal throughput on both instances. But Instance B's CPU is at 80% while Instance A sits at 30%.
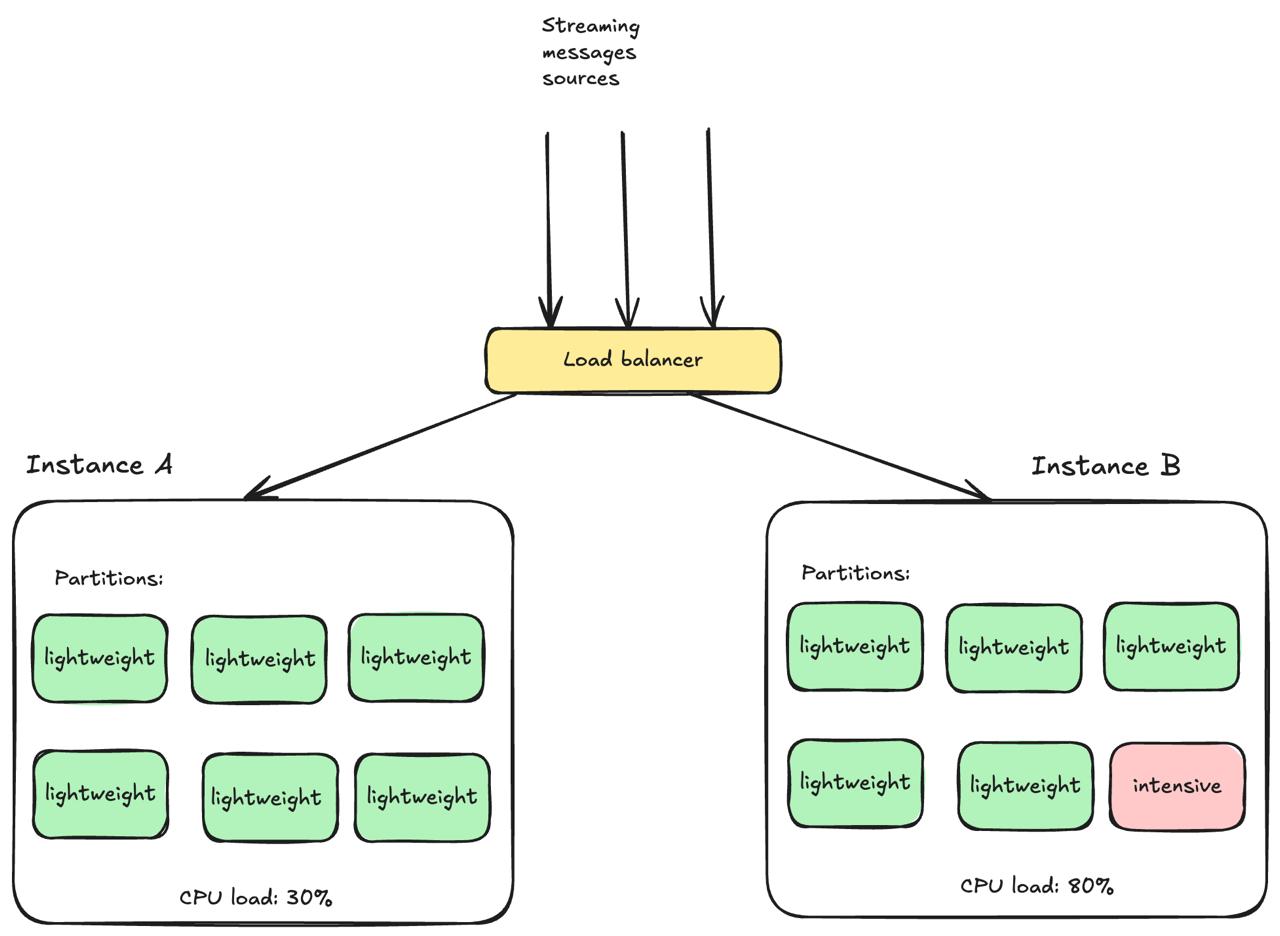
The core problem is that throughput is a necessary but not sufficient signal for load balancing when workloads are heterogeneous. Messages that trigger expensive computation look identical to simple messages from a throughput counter's perspective, but they consume fundamentally different amounts of system resources.
Heterogeneous Hardware Makes It Worse
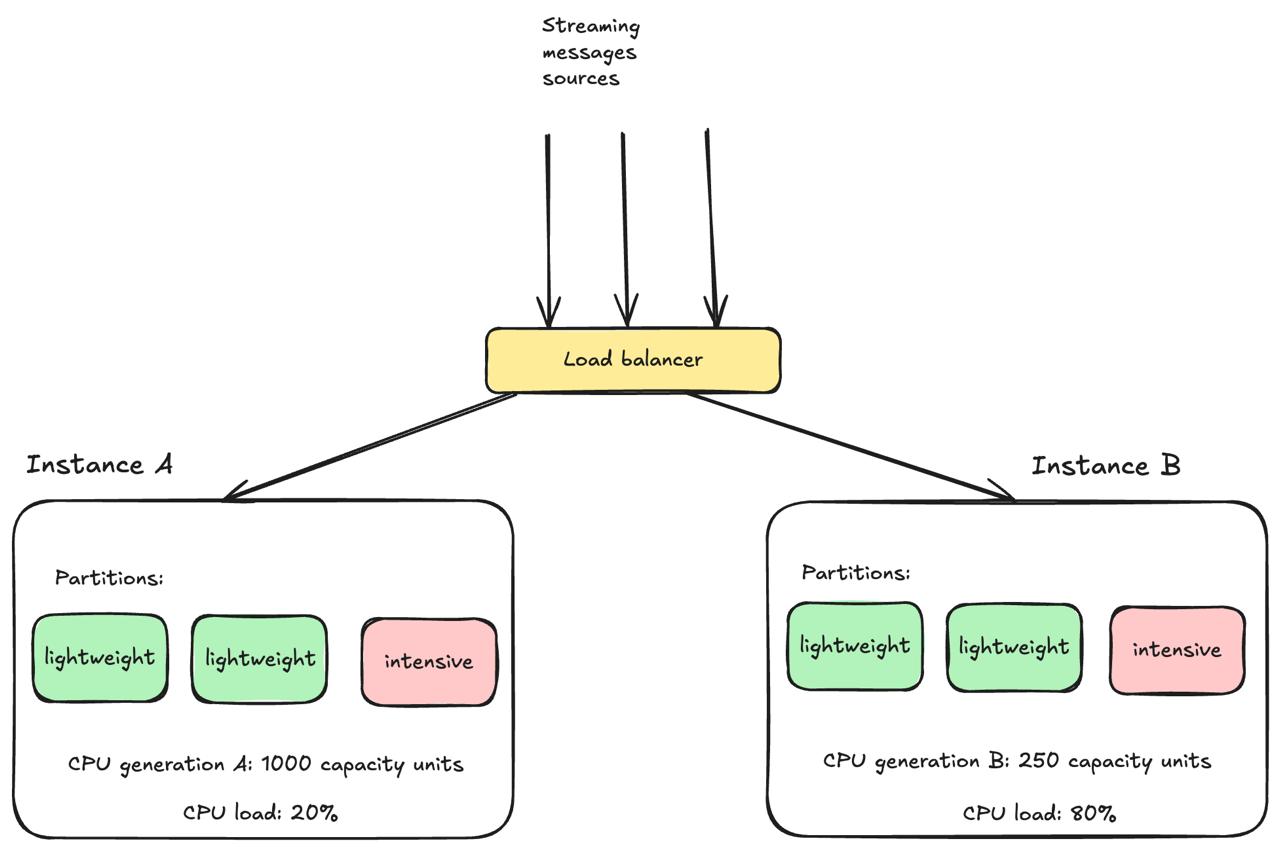
Even if all workloads had identical per-message processing costs, fleet hardware heterogeneity can still defeat throughput-based balancing. Whether you're running on-premise or in the cloud, your fleet may contain multiple generations and configurations of compute instances. One instance might have a modern high-core-count processor; another might be running on older hardware with fewer cores or different per-core performance characteristics.
If the load balancer distributes an equal number of messages to both, the older machine hits 80% CPU while the newer one idles at 20%.
The classic answer is weighted round-robin with weights proportional to compute instance capacity. But this only works when:
- You can accurately quantify relative compute instance capacity for your specific workload
- That capacity ratio remains stable across workload mixes
- The mapping from capacity units to actual throughput is linear
In streaming services with heterogeneous traffic, none of these assumptions reliably holds. A compute instance's effective capacity depends on which partitions are assigned to it, and that changes continuously as partitions are rebalanced. In production environments, throughput distribution often appears uniform while CPU utilization spans 2-3x across hardware generations.
Uniform throughput does not mean uniform load.
The Proxy Metric Trap
When the direct signal — per-partition resource usage — isn't available, engineers naturally reach for proxy metrics. The most common ones are:
- Messages per second – assuming each message costs roughly the same to process
- Bytes per second – assuming larger messages are more expensive
- Number of partitions – assuming each partition represents equal work
Each of these breaks in predictable ways:
- Messages per second fails with heterogeneous workloads
- Bytes per second fails when cost comes from computation, not I/O
- Number of partitions fails when partition throughput and complexity vary
The temptation is to try increasingly sophisticated combinations of these proxies.
I ran several experiments along these lines for my streaming use case, and the results were consistent: balancing on messages per second alone gets you part of the way but leaves a 2-3x spread in CPU utilization, and removing secondary metrics to focus on the single best proxy helps only marginally.
The lesson I took from this: no amount of algebraic creativity with throughput-derived proxies can substitute for measuring the thing you actually care about.
The Outlier Problem
Load imbalance doesn't manifest as a smooth gradient. It concentrates on a small number of outlier instances, and those outliers are where the real damage happens.
In a fleet of 100 instances, a typical distribution might look like this: The difference between the median and the worst case is 3×, but the number of truly overloaded instances might be just one or two.
- p50 CPU utilization: ~20%
- p95 CPU utilization: ~35%
- MAX CPU utilization: ~65%+
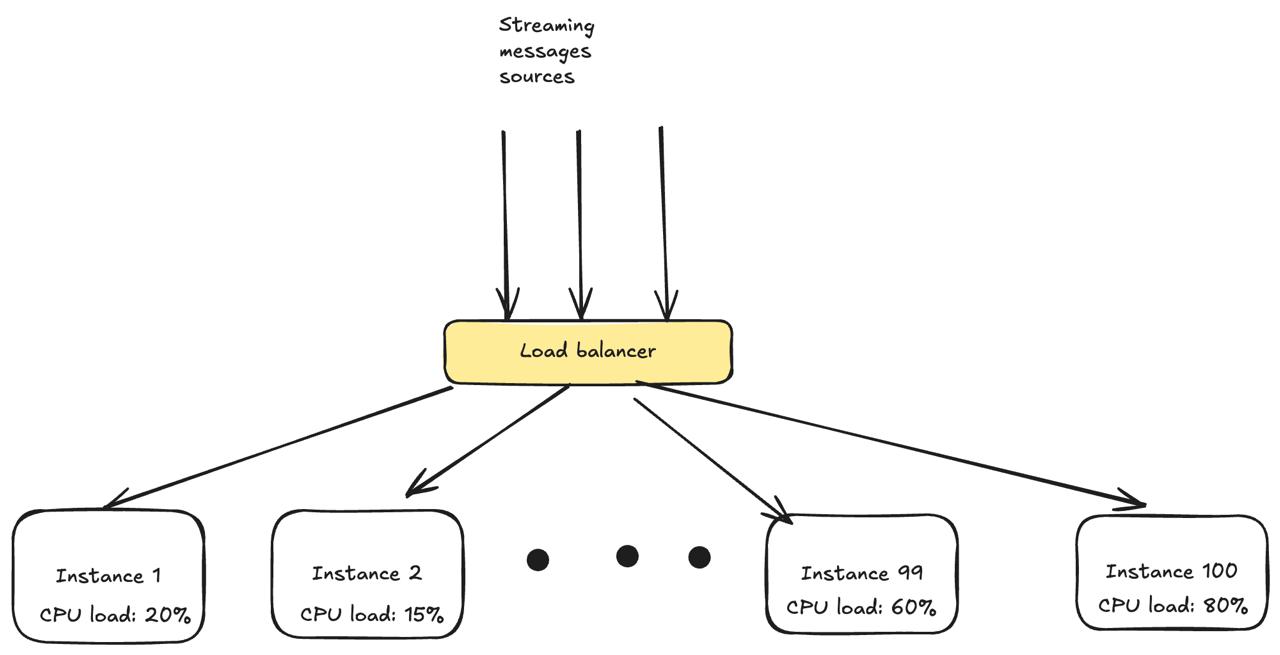
Those one or two instances are the ones that cause tail latency spikes, processing lag, OOM kills, and cascading failures. Your effective capacity is governed not by your average utilization, but by your worst-case instances.
A fleet running at 20% average CPU sounds healthy until you realize the hottest instances are already at risk of overload.
Partitioning Constraints Add Friction
Data streaming services may have an additional constraint that stateless web services typically don't: partition affinity. Each partition represents a subset of the input data, and reassigning a partition to a different instance may involve state transfer, warm-up time, or temporary processing gaps.
When this constraint applies, the load balancer can't freely shuffle work around the way a web load balancer directs HTTP requests. Rebalancing has a cost, and frequent rebalancing creates its own instability.
The balancer must find the sweet spot between:
- Reacting quickly enough to prevent overload on individual instances
- Not thrashing partitions so aggressively that the system never stabilizes
What Actually Works: Measuring Real Resource Consumption
After systematic experimentation with proxy metrics, the answer turned out to be straightforward in concept: measure actual per-partition resource consumption and use it as the primary load-balancing signal.
In practice, this means three things:
1. Instrumenting the service to report per-partition resource usage — CPU time, memory, or a normalized compute metric:
class PartitionCPUTracker:
  # Accumulated CPU time per partition (in seconds)
  _cpu_time: dict[str, float] = field(default_factory=lambda: defaultdict(float))
  # Timestamp of last report
  _last_report_time: float = field(default_factory=time.monotonic)
  # Reporting interval (seconds)
  report_interval: float = 300 # 5 minutes

  def measure_partition_work(self, partition_id: str, process_fn, message):
    """Wrap message processing to measure CPU time per partition."""
    cpu_start = time.process_time()
    try:
      result = process_fn(message)
      return result
    finally:
      cpu_elapsed = time.process_time() - cpu_start
      self._cpu_time[partition_id] += cpu_elapsed


  def get_cpu_usage_report(self) -> dict[str, float]:
    """Return per-partition CPU usage as a fraction of total capacity.
    Called periodically by the orchestrator to make placement decisions.
    """
    now = time.monotonic()
    wall_elapsed = now - self._last_report_time
    if wall_elapsed <= 0:
    	return {}

    num_cpus = os.cpu_count() or 1
    total_capacity = wall_elapsed * num_cpus # max possible CPU-seconds

    report = {}
    for partition_id, cpu_seconds in self._cpu_time.items():
      # Fraction of total CPU capacity consumed by this partition
      report[partition_id] = cpu_seconds / total_capacity

    # Reset counters for next interval
    self._cpu_time = defaultdict(float)
    self._last_report_time = now
    return report
2. Reporting these metrics to the orchestrator as the primary resource to balance:
def report_to_orchestrator(self, orchestrator_client):
  """Send per-partition CPU usage to the orchestrator."""
  report = self.get_cpu_usage_report()
  for partition_id, cpu_fraction in report.items():
    orchestrator_client.report_resource(
      partition_id=partition_id,
      resource_type="partition_cpu_usage",
      utilization=cpu_fraction,
  	)
3. Letting the orchestrator make placement decisions based on actual resource consumption rather than throughput proxies:
# Load-balancer (orchestrator) config

...
number_of_instances = 100
max_partitions_per_instance = 50
resources_to_balance = {
	# "partition_messages_per_second": {"deviation_pct": 10}  # <-- old metric
	"partition_cpu_usage": {"deviation_pct": 5}  # <-- new metric
}
...
When I implemented this approach, the results were significant:
- Load distribution became much more uniform. The difference between p10 and p95 CPU utilization tightened dramatically — from roughly 50% down to less than 10%, with p50 settling around 30%.
- Maximum fleet capacity increased. Because peak CPU utilization on the hottest instances dropped from ~65% to ~40%, the fleet could absorb substantially more traffic before any single instance became a bottleneck.
The more uniform distribution also made capacity planning much easier to reason about. When load correlates with a directly measured resource, you can look at aggregate resource usage, compare it to fleet capacity, and make defensible decisions about provisioning.
But the Numbers Weren't the Most Important Part: Implementation Considerations
Measuring per-partition resource usage is harder than it sounds, and there are several practical challenges worth calling out.
- Attribution accuracy. In a multi-threaded service processing multiple partitions, correctly attributing resource consumption to individual partitions requires careful instrumentation. Approaches include per-partition timing around processing loops, or proportional attribution based on known cost proxies within the measurement framework.
- Hardware normalization. Resource consumption on different hardware must be normalized. The same workload will report different absolute numbers on different processor generations. Establishing a common unit of compute across your fleet is essential but non-trivial.
- Reporting granularity. The orchestrator needs per-partition resource reports at a granularity that captures steady-state behavior without being too noisy. In my particular case, reporting intervals of 5-10 minutes worked better than 1-minute intervals, which tended to be too reactive.
- Cold start. When a partition is first assigned to an instance, there's no resource usage history. The balancer must rely on throughput-based estimates until enough data accumulates.
Key Takeaways
If you're running a data streaming service with heterogeneous traffic, here's what I've found worth keeping in mind:
- Throughput-based load balancing fails silently when per-message processing costs vary across workloads. Round-robin distribution can result in 2-3x CPU spread between median and worst-case hosts.
- Measuring actual per-partition resource consumption is the only reliable load signal for heterogeneous streaming workloads. No combination of proxy metrics substitutes for direct measurement.
- Hardware heterogeneity compounds the proxy metric problem. Uniform throughput across a mixed hardware fleet does not mean uniform resource utilization.
- Load imbalance concentrates in a small number of outlier hosts. Capacity planning is governed by peak utilization, not average utilization.
- Per-partition instrumentation requires careful attention to attribution accuracy, hardware normalization, reporting granularity, and cold-start behavior.
The challenges described here are common across any system that processes heterogeneous streaming data at scale — from real-time ML feature pipelines and search index builders to event-driven microservices and change data capture (CDC) processors. The specifics vary, but the fundamental tension between throughput-based proxies and actual resource consumption is universal.
Opinions expressed by DZone contributors are their own.
Comments