Web App Load Testing Using Maven Plugins for Apache JMeter, and Analyzing the Results
How to perform a complete load-testing with Java Maven and processing the performance metrics through a dedicated POM file
Join the DZone community and get the full member experience.
Join For FreeIn this article, we will walk you through how to conduct a load test and analyze the results using Java Maven technology. We'll covering everything from launching the test to generating informative graphs and tables.
For this demonstration, we'll utilize various files, including Project Object Model (POM) files, JMeters scripts, and CSV data, from the jpetstore_loadtesting_dzone project available on GitHub. This will help illustrate the steps involved and the functionality of the necessary plugins and tools. You can find the project here: https://github.com/vdaburon/jpetstore_loadtesting_dzone.
The web application being tested is a well-known application called JPetStore, which you can further explore at https://github.com/mybatis/jpetstore-6.

Advantages of This Solution for Launching and Analyzing Tests
The details of how to implement this solution and the details of Maven launches will be covered in the subsequent chapters. For now, let's highlight the key advantages:
- For Installation
- There is no need to pre-install Apache JMeter to conduct the load tests, as the JMeter Maven Plugin automatically fetches the Apache JMeter tool and the necessary plugins from the Maven Central Repository.
- The file paths used are relative to the Maven project, which means they can vary across different machines during the development phase and in Continuous Integration setups.
- For Continuous Integration
- This solution seamlessly integrates into Continuous Integration pipelines (such as Jenkins and GitLab). Tests can be easily run on a Jenkins node or a GitLab Runner, making it accessible for both developers and testers.
- Performance graphs from operating system or Java monitoring tools can be easily added using monitoring tools like nmon + nmon visualizer for Linux environments.
- For Developers and Testers
- Java developers and testers familiar with Maven will feel comfortable with the pom.xml files and Git.
- The load testing project is managed like a standard Java Maven project within the Integrated Development Environments (IDEs) such as IntelliJ, Eclipse, and Visual Studio.
- The various files (POM, JMeter script, CSV data) can be version-controlled using Git or other source control systems.
- The project's
README.mdfile (in Markdown format) can serve as valuable documentation on how to run load tests and analyze results, particularly in Integrated Control (IC).
- For Analysis
- The analysis is fast, as various output files are created in just a few minutes.
- Users can filter results to focus only on specific pages, excluding the URLs invoked within them.
- The plugin's filter tool allows users to analyze results by load steps, running it multiple times with different start and end offset parameters.
- For clearer graphs, users can filter to present response times per scenario with a manageable number of curves.
- Users can force the Y-axis for better comparison of graphs because they are on the same scale, for example, setting Y = 5000 ms for response times or from 0 to 100% for CPU usage.
- Aggregate and Synthesis reports are available in both CSV format and HTML tables for easy display on a webpage.
- After executing a load test, users can quickly review results through the generated index.html page, which provides easy access to graphs and HTML tables.
- The generated HTML page includes links to file sizes, and clicking on these links offers a view of content, like JMeter logs, in a browser.
- If a particular graph is missing, users can create duration graphs for each URL called on a page using the "JMeterPluginsCMD Command Line Tool" and "Filter Results Tool" from the JMeter results file or directly through JMeter's Swing GUI interface.
- For Report Generation
- Graphs created during the analysis can be directly imported into reports created in Microsoft Word or LibreOffice Writer formats.
- CSV reports can be edited in a spreadsheet software (Microsoft Excel or LibreOffice Calc), and the formatted values can then be easily copied into a Word or Writer report.
- For Archiving
- Archiving results is quite simple; users can save the zipped directory containing all the results and analyses.
- This archiving format approach makes it easy to compare different load test campaigns.
- The retention period for results can be extensive, stretching several years, as the file format is simple and clear; unlike data stored in documents, relational databases, or temporal databases, it remains easily accessible and understandable.
Running a Load Test With Maven and Apache JMeter
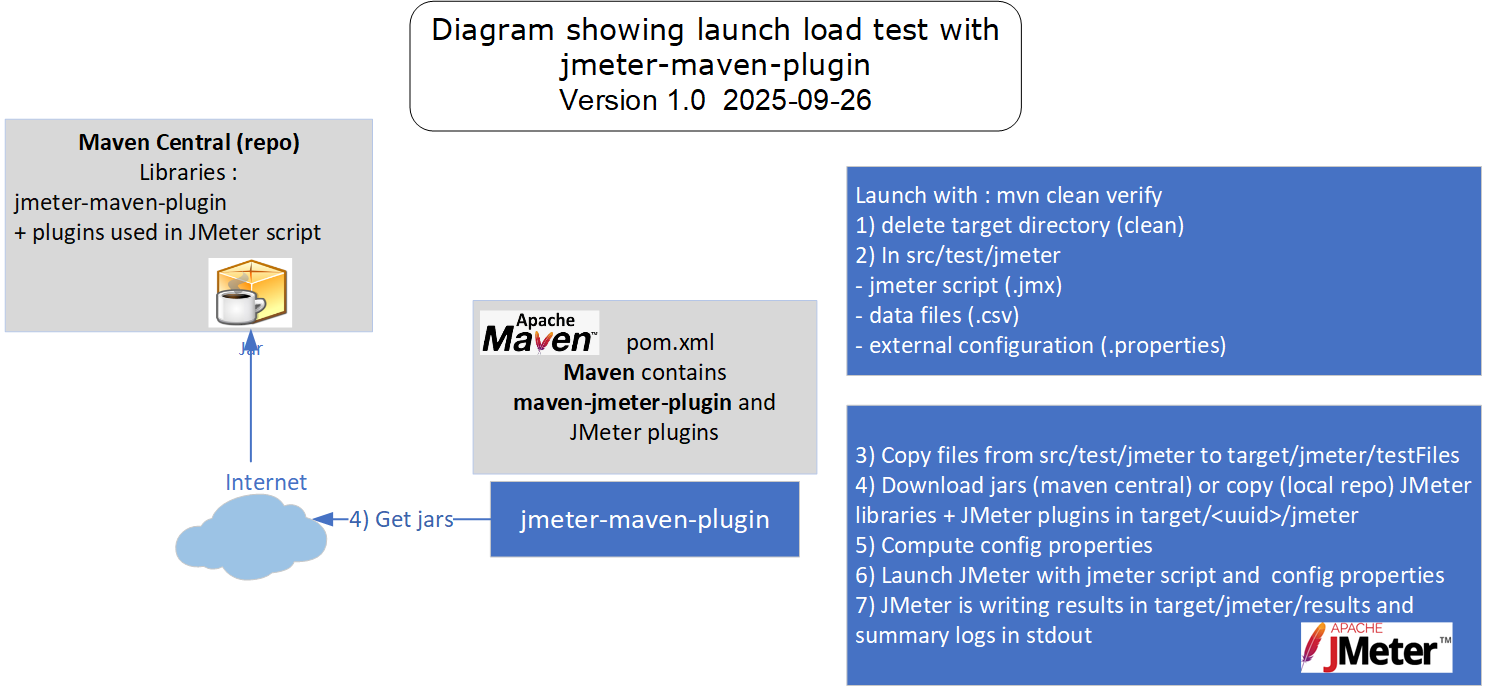
If you're looking to run a load test using Apache JMeter, there is a Maven plugin available for that purpose. This plugin is called the jmeter-maven-plugin , and you can find it at its project URL: https://github.com/jmeter-maven-plugin/jmeter-maven-plugin.
To effectively run your performance tests with Java Maven, you need a few essentials:
- A JDK/JRE version 1.8 or higher (such as version 17)
- A recent version of Maven (3.7 or higher)
- A Maven
pom.xmlfile
One of the great things about this setup is that you don't need to install Apache JMeter beforehand. It's also a good idea to have a Git client available for fetching crucial resources from the repository such as the JMeter script, external configuration files, and any CSV data files you'll need.
For easier management, it is recommended to maintain two Maven files:
- The first Maven file, pom.xml (
pom_01_launch_test.xml), is dedicated to launching the performance test - The second Maven file, pom.xml (
pom_02_analyse_results.xml), is for analyzing the results
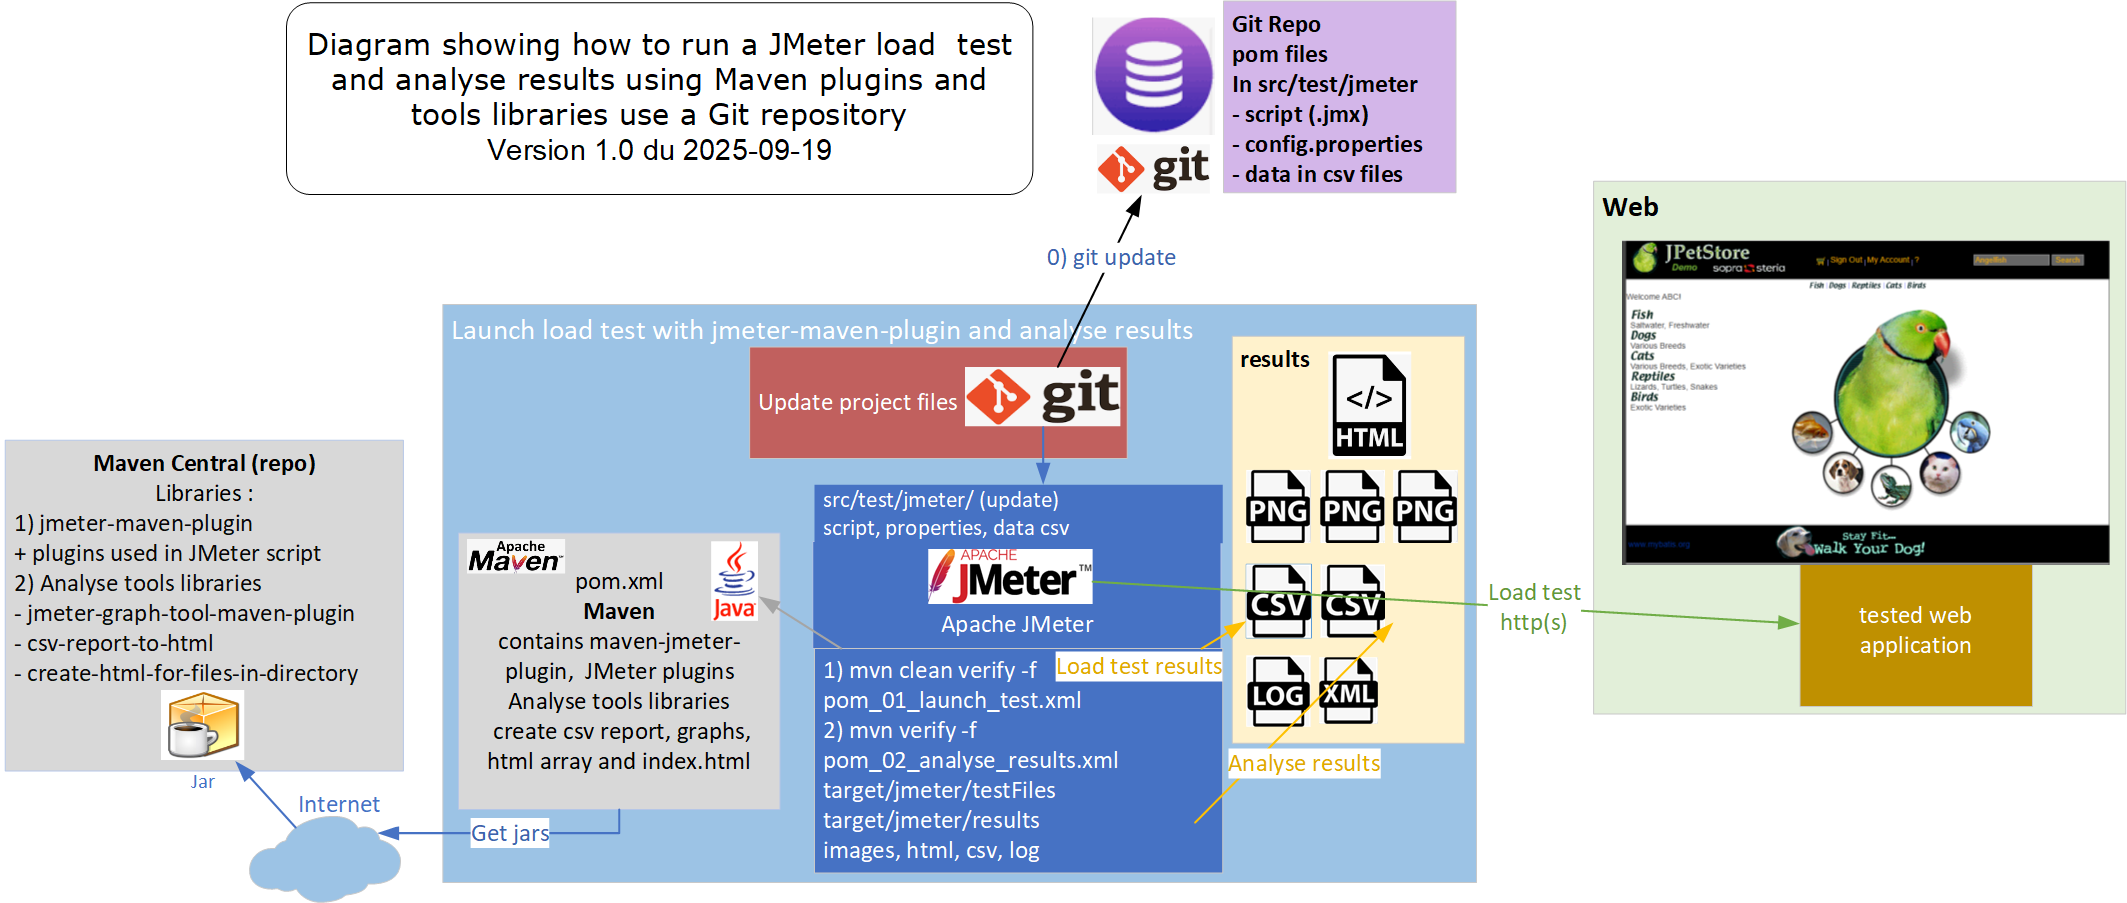
JMeter Maven Plugin Recommended Project Directory Structure
The Maven project designed for launching load tests comes with a predefined directory structure. For the jmeter-maven-plugin , this structure can be found at: ${project.base.directory}/src/test/jmeter
In this directory, you need to place the following items:
- The JMeter script (.jmx)
- The dataset files (.csv)
- External configuration files referenced in the JMeter script (.properties)
- The JMeter configuration file (user.properties) if you are using any non-standard properties
The pom.xml File for Launching the Load Test
The first pom.xml file (pom_01_launch_test.xml) includes the declaration of the jmeter-maven-plugin with some configuration properties.
<project xmlns="http://maven.apache.org/POM/4.0.0" xmlns:xsi="http://www.w3.org/2001/XMLSchema-instance"
         xsi:schemaLocation="http://maven.apache.org/POM/4.0.0 https://maven.apache.org/xsd/maven-4.0.0.xsd">
    <modelVersion>4.0.0</modelVersion>
    <groupId>io.github.vdaburon</groupId>
    <artifactId>jpetstore-maven-load-test-dzone</artifactId>
    <version>1.0</version>
    <packaging>pom</packaging>

    <name>01 - Launch a load test of the JPetstore web application with the maven plugin</name>
    <description>Launch a load test of the JPetstore web application with the maven plugin</description>
    <inceptionYear>2025</inceptionYear>
    <developers>
        <developer>
            <id>vdaburon</id>
            <name>Vincent DABURON</name>
            <email>[email protected]</email>
            <roles>
                <role>architect</role>
                <role>developer</role>
            </roles>
        </developer>
    </developers>

    <properties>
        <project.build.sourceEncoding>UTF-8</project.build.sourceEncoding>
        <maven.compiler.source>1.8</maven.compiler.source>
        <maven.compiler.target>1.8</maven.compiler.target>
        <jmeter.version>5.6.3</jmeter.version>
        <jvm_xms>256</jvm_xms>
        <jvm_xmx>756</jvm_xmx>

        <prefix_script_name>jpetstore</prefix_script_name>
        <config_properties_name>config_test_warm_up.properties</config_properties_name>
    </properties>

    <build>
        <plugins>
            <plugin>
                <!-- Launch load test with : mvn clean verify -->
                <groupId>com.lazerycode.jmeter</groupId>
                <artifactId>jmeter-maven-plugin</artifactId>
                <version>3.6.1</version>
                <executions>
                    <!-- Generate JMeter configuration -->
                    <execution>
                        <id>configuration</id>
                        <goals>
                            <goal>configure</goal>
                        </goals>
                    </execution>
                    <!-- Run JMeter tests -->
                    <execution>
                        <id>jmeter-tests</id>
                        <goals>
                            <goal>jmeter</goal>
                        </goals>
                    </execution>
                    <!-- Fail build on errors in test                     <execution>
                        <id>jmeter-check-results</id>
                        <goals>
                            <goal>results</goal>
                        </goals>
                    </execution>
                    -->
                </executions>
                <configuration>
                    <jmeterVersion>${jmeter.version}</jmeterVersion>
                    <jmeterExtensions>
                        <!-- add jmeter plugins in JMETER_HOME/lib/ext -->
                        <artifact>kg.apc:jmeter-plugins-functions:2.2</artifact>
                        <artifact>kg.apc:jmeter-plugins-dummy:0.4</artifact>
                        <artifact>io.github.vdaburon:pacing-jmeter-plugin:1.0</artifact>
                    </jmeterExtensions>
                    <testPlanLibraries>
                        <!-- add librairies in JMETER_HOME/lib -->
                        <!-- e.g: <artifact>org.postgresql:postgresql:42.5.1</artifact> -->
                    </testPlanLibraries>
                    <downloadExtensionDependencies>false</downloadExtensionDependencies>
                    <jMeterProcessJVMSettings>
                        <xms>${jvm_xms}</xms>
                        <xmx>${jvm_xmx}</xmx>
                        <arguments>
                            <argument>-Duser.language=en</argument>
                            <argument>-Duser.region=EN</argument>
                        </arguments>
                    </jMeterProcessJVMSettings>
                    <testFilesIncluded>
                        <jMeterTestFile>${prefix_script_name}.jmx</jMeterTestFile>
                    </testFilesIncluded>
                    <propertiesUser>
                        <!-- folder for csv file relatif to script folder -->
                        <relatif_data_dir>/</relatif_data_dir>
                        <!-- PROJECT_HOME/target/jmeter/results/ -->
                        <resultat_dir>${project.build.directory}/jmeter/results/</resultat_dir>
                    </propertiesUser>
                    <customPropertiesFiles>
                        <!-- like -q myconfig.properties , add my external configuration file -->
                        <file>${basedir}/src/test/jmeter/${config_properties_name}</file>
                    </customPropertiesFiles>
                    <logsDirectory>${project.build.directory}/jmeter/results</logsDirectory>
                    <generateReports>false</generateReports>
                    <testResultsTimestamp>false</testResultsTimestamp>
                    <resultsFileFormat>csv</resultsFileFormat>
                </configuration>
            </plugin>
        </plugins>
    </build>
</project>
Launching a Load Test on the JPetstore Web Application
To launch a performance test on the JPetstore application at 50% load for a duration of 10 minutes, specify:
- The JMeter script prefix with
-Dprefix_script_name=jpetstore(for the jpetstore.jmx file) - The properties file name with
-Dconfig_properties_name=config_test_50pct_10min.properties, which contains the virtual users' configuration needed for the 50% load and a 10-minute duration) - The properties file (e.g., config_test_50pct_10min.properties), should contain external configuration, including JMeter properties such as the test URL, the number of virtual users per scenario, and the duration of the test.
To launch the load test, use the following command:mvn -Dprefix_script_name=jpetstore -Dconfig_properties_name=config_test_50pct_10min.properties -f pom_01_launch_test.xml clean verify
Notes to keep in mind:
- Ensure that the
mvnprogram is included in the PATH environment variable or that theMAVEN_HOMEenvironment variable is set. - Since Maven relies on a JDK/JRE, make sure the path to the
javaprogram is specified in the launch file, or that theJAVA_HOMEenvironment variable is configured. - If you need to stop the test before it reaches its scheduled time, run the shell script located at
<JMETER_HOME>/bin/shutdown.sh(for Linux) orshutdown.cmd(for Windows).
The test has started. The "Summary logs" provide an overview of the performance test's progress. We specifically keep an eye on the time elapsed since the launch and the number of errors encountered. Here's an example of the logs from a test that was launched in the IntelliJ IDE:
C:\Java\jdk1.8.0_191\bin\java.exe ... -Dmaven.home=C:\software\maven3  -Dprefix_script_name=jpetstore -Dconfig_properties_name=config_test_50pct_10min.properties -f pom_01_launch_test.xml clean verify -f pom_01_launch_test.xml
[INFO] Scanning for projects...
[INFO] [INFO] --< io.github.vdaburon:jpetstore-maven-load-test-dzone >---
[INFO] Building 01 - Launch a load test of the JPetstore web application with the maven plugin 1.0
[INFO]   from pom_01_launch_test.xml
[INFO] --------------------------------[ pom ]---------------------------------
[INFO] [INFO] --- clean:3.2.0:clean (default-clean) @ jpetstore-maven-load-test-dzone ---
[INFO] [INFO] --- jmeter:3.6.1:configure (configuration) @ jpetstore-maven-load-test-dzone ---
[INFO]  [INFO] -------------------------------------------------------
[INFO] C O N F I G U R I N G    J M E T E R
[INFO] -------------------------------------------------------
[INFO]  [INFO] Creating test configuration for execution ID: configuration
[INFO] Building JMeter directory structure...
[INFO] Generating JSON Test config...
[INFO] Configuring JMeter artifacts...
[INFO] Populating JMeter directory...
[INFO] Copying extensions to C:\demo\jpetstore_loadtesting_dzone\target\1515b131-17ff-4f97-bcb7-ba2eec698862\jmeter\lib\ext Downloading dependencies: false
[INFO] Copying junit libraries to C:\demo\jpetstore_loadtesting_dzone\target\1515b131-17ff-4f97-bcb7-ba2eec698862\jmeter\lib\junit Downloading dependencies: true
[INFO] Copying test plan libraries to C:\demo\jpetstore_loadtesting_dzone\target\1515b131-17ff-4f97-bcb7-ba2eec698862\jmeter\lib Downloading dependencies: true
[INFO] Configuring JMeter properties...
[INFO] [INFO] --- jmeter:3.6.1:jmeter (jmeter-tests) @ jpetstore-maven-load-test-dzone ---
[INFO]  [INFO] -------------------------------------------------------
[INFO]  P E R F O R M A N C E    T E S T S
[INFO] -------------------------------------------------------
[INFO]  [INFO] Executing test: jpetstore.jmx
[INFO] Arguments for forked JMeter JVM: [java, -Xms256M, -Xmx756M, -Duser.language=en, -Duser.region=EN, -Djava.awt.headless=true, -jar, ApacheJMeter-5.6.3.jar, -d, C:\demo\jpetstore_loadtesting_dzone\target\1515b131-17ff-4f97-bcb7-ba2eec698862\jmeter, -j, C:\demo\jpetstore_loadtesting_dzone\target\jmeter\results\jpetstore.jmx.log, -l, C:\demo\jpetstore_loadtesting_dzone\target\jmeter\results\jpetstore.csv, -n, -q, C:\demo\jpetstore_loadtesting_dzone\src\test\jmeter\config_test_50pct_10min.properties, -t, C:\demo\jpetstore_loadtesting_dzone\target\jmeter\testFiles\jpetstore.jmx, -Dsun.net.http.allowRestrictedHeaders, true]
[INFO]  [INFO] WARN StatusConsoleListener The use of package scanning to locate plugins is deprecated and will be removed in a future release
[INFO] WARN StatusConsoleListener The use of package scanning to locate plugins is deprecated and will be removed in a future release
[INFO] WARN StatusConsoleListener The use of package scanning to locate plugins is deprecated and will be removed in a future release
[INFO] WARN StatusConsoleListener The use of package scanning to locate plugins is deprecated and will be removed in a future release
[INFO] Creating summariser <summary>
[INFO] Created the tree successfully using C:\demo\jpetstore_loadtesting_dzone\target\jmeter\testFiles\jpetstore.jmx
[INFO] Starting standalone test @ September 24, 2025 11:30:22 AM CEST (1758706222410)
[INFO] Waiting for possible Shutdown/StopTestNow/HeapDump/ThreadDump message on port 4445
[INFO] summary +     33 in 00:00:08 =    4.2/s Avg:   100 Min:    30 Max:  1089 Err:     0 (0.00%) Active: 2 Started: 2 Finished: 0
[INFO] summary +     67 in 00:00:29 =    2.3/s Avg:    53 Min:    28 Max:   174 Err:     0 (0.00%) Active: 5 Started: 5 Finished: 0
[INFO] summary =    100 in 00:00:37 =    2.7/s Avg:    69 Min:    28 Max:  1089 Err:     0 (0.00%)
[INFO] summary +     81 in 00:00:30 =    2.7/s Avg:    69 Min:    27 Max:   858 Err:     0 (0.00%) Active: 7 Started: 7 Finished: 0
[INFO] summary =    181 in 00:01:07 =    2.7/s Avg:    69 Min:    27 Max:  1089 Err:     0 (0.00%)
…
[INFO] summary +     47 in 00:00:31 =    1.5/s Avg:    86 Min:    30 Max:   471 Err:     0 (0.00%) Active: 7 Started: 7 Finished: 0
[INFO] summary =   1381 in 00:09:38 =    2.4/s Avg:    71 Min:    27 Max:  1184 Err:     0 (0.00%)
[INFO] summary +     36 in 00:00:22 =    1.6/s Avg:    69 Min:    30 Max:   150 Err:     0 (0.00%) Active: 0 Started: 7 Finished: 7
[INFO] summary =   1417 in 00:10:00 =    2.4/s Avg:    71 Min:    27 Max:  1184 Err:     0 (0.00%)
[INFO] Tidying up ...    @ September 24, 2025 11:40:23 AM CEST (1758706823339)
[INFO] ... end of run
[INFO] Completed Test: C:\demo\jpetstore_loadtesting_dzone\target\jmeter\testFiles\jpetstore.jmx
[INFO]  [INFO] ------------------------------------------------------------------------
[INFO] BUILD SUCCESS
[INFO] ------------------------------------------------------------------------
[INFO] Total time:  10:08 min
[INFO] Finished at: 2025-09-24T11:40:24+02:00
[INFO] ------------------------------------------------------------------------
[INFO] Shutdown detected, destroying JMeter process...
[INFO]  Process finished with exit code 0
The results can be found in the following directory: <PROJECT_HOME>/target/jmeter/results
- jpetstore.jmx.log (JMeter logs)
- error.xml (contains information about failed samplers)
- jpetstore.csv (JMeter results)
Analysis of Results
We use the second Maven POM file specifically for analysis purposes, which is named: pom_02_analyse_results.xml
The launch parameter is: prefix_script_name, representing the script prefix without its extension. This is important because the JMeter results file follows the format <script prefix>.csv (for instance, jpetstore.csv).
To launch the analysis, type the following command:mvn -Dprefix_script_name=jpetstore -f pom_02_analyse_results.xml verify
Note: DO NOT use the clean command as it will erase the test results that we want to retain.
The Maven File With the Plugin and Tools for Analysis
The Maven plugin and tools:
- jmeter-graph-tool-maven-plugin
- csv-report-to-html
- create-html-for-files-in-directory
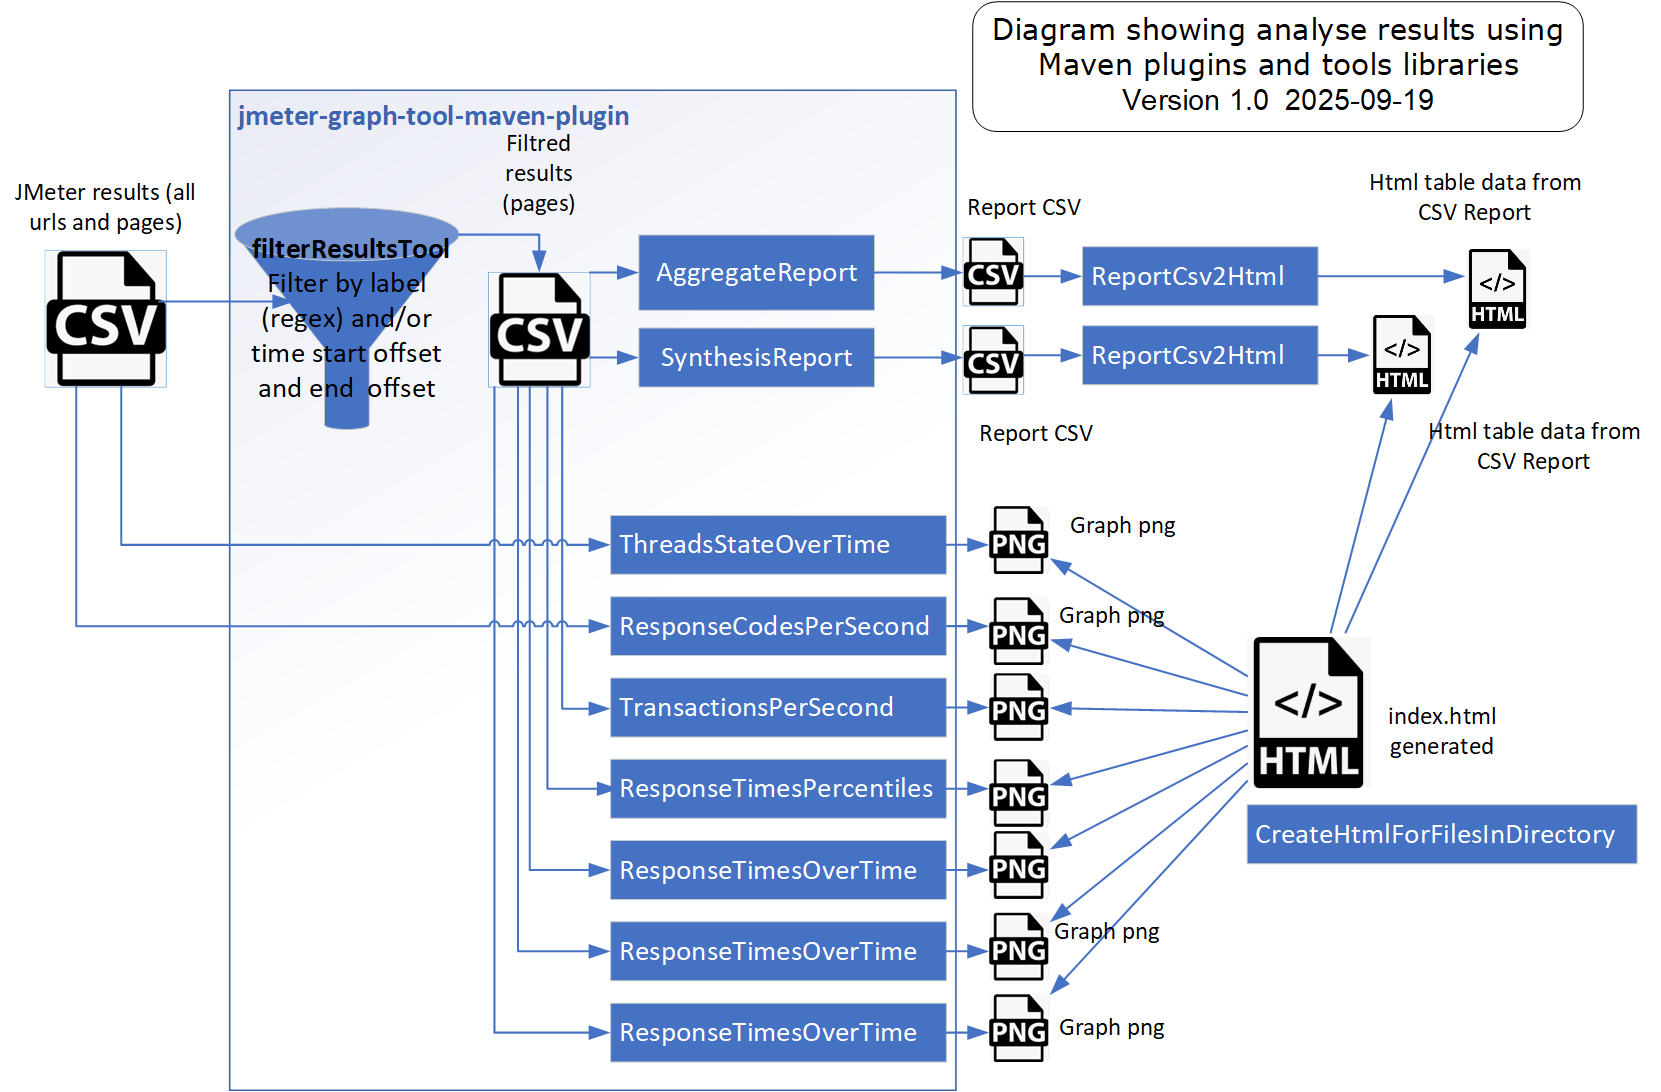
The jmeter-graph-tool-maven-plugin plugin allows you to:
- Filter JMeter results files by retaining only the pages while removing the page URLs. It can also narrow down the data by test period, ensuring that only the steps with a stable number of virtual users are included.
- Generate a "Summary" report in CSV format
- Generate a "Synthesis" report in CSV format
- Create graphs in PNG format to visual various metrics, including:
- Threads State Over Time
- Response Codes Per Second
- Bytes Throughput Over Time
- Transactions Per Second
- Response Times Percentiles
- Response Times Over Time
The csv-report-to-html tool reads the generated CSV reports (both Summary and Synthesis) and generates an HTML table displaying the data contained within.
Meanwhile, the create-html-for-files-in-directory tool browses the target/jmeter/results directory and creates an index.html page. This page serves as a convenient hub for viewing various image files, HTML tables, and create links to other files present in the directory.
The pom_02_analyse_results.xml File for Analysis
The contents of the pom_02_analyse_results.xml file are outlined below:
<project xmlns="http://maven.apache.org/POM/4.0.0" xmlns:xsi="http://www.w3.org/2001/XMLSchema-instance"
xsi:schemaLocation="http://maven.apache.org/POM/4.0.0 https://maven.apache.org/xsd/maven-4.0.0.xsd">
<modelVersion>4.0.0</modelVersion>
<groupId>io.github.vdaburon</groupId>
<artifactId>jpetstore-maven-analyse-result-dzone</artifactId>
<version>1.0</version>
<packaging>pom</packaging>
<name>02 - Analyzes the results of the web application JPetstore load test with deditated maven plugins</name>
<description>Analyzes the results of the web application JPetstore load test with deditated maven plugins</description>
<inceptionYear>2025</inceptionYear>
<developers>
<developer>
<id>vdaburon</id>
<name>Vincent DABURON</name>
<email>[email protected]</email>
<roles>
<role>architect</role>
<role>developer</role>
</roles>
</developer>
</developers>
<properties>
<project.build.sourceEncoding>UTF-8</project.build.sourceEncoding>
<maven.compiler.source>1.8</maven.compiler.source>
<maven.compiler.target>1.8</maven.compiler.target>
<jvm_xms>256</jvm_xms>
<jvm_xmx>756</jvm_xmx>
<graph_width>960</graph_width>
<graph_height>800</graph_height>
<prefix_script_name>jpetstore</prefix_script_name>
</properties>
<dependencies>
<dependency>
<groupId>io.github.vdaburon</groupId>
<artifactId>csv-report-to-html</artifactId>
<version>1.2</version>
</dependency>
<dependency>
<groupId>io.github.vdaburon</groupId>
<artifactId>create-html-for-files-in-directory</artifactId>
<version>1.9</version>
</dependency>
</dependencies>
<build>
<plugins>
<plugin>
<groupId>io.github.vdaburon</groupId>
<artifactId>jmeter-graph-tool-maven-plugin</artifactId>
<version>1.2</version>
<executions>
<execution>
<id>create-graphs</id>
<goals>
<goal>create-graph</goal>
</goals>
<phase>verify</phase>
<configuration>
<directoryTestFiles>${project.build.directory}/jmeter/testFiles</directoryTestFiles>
<filterResultsTool>
<filterResultsParam>
<inputFile>${project.build.directory}/jmeter/results/${prefix_script_name}.csv</inputFile>
<outputFile>${project.build.directory}/jmeter/results/${prefix_script_name}_filtred.csv</outputFile>
<successFilter>false</successFilter>
<includeLabels>SC[0-9]+_P.*</includeLabels>
<includeLabelRegex>true</includeLabelRegex>
</filterResultsParam>
</filterResultsTool>
<graphs>
<graph>
<pluginType>AggregateReport</pluginType>
<inputFile>${project.build.directory}/jmeter/results/${prefix_script_name}.csv</inputFile>
<generateCsv>${project.build.directory}/jmeter/results/G01_AggregateReport.csv</generateCsv>
<includeLabels>SC[0-9]+_.*</includeLabels>
<includeLabelRegex>true</includeLabelRegex>
</graph>
<graph>
<pluginType>SynthesisReport</pluginType>
<inputFile>${project.build.directory}/jmeter/results/${prefix_script_name}.csv</inputFile>
<generateCsv>${project.build.directory}/jmeter/results/G02_SynthesisReport.csv</generateCsv>
<includeLabels>SC[0-9]+_.*</includeLabels>
<includeLabelRegex>true</includeLabelRegex>
</graph>
<graph>
<pluginType>ThreadsStateOverTime</pluginType>
<inputFile>${project.build.directory}/jmeter/results/${prefix_script_name}.csv
</inputFile>
<width>${graph_width}</width>
<height>${graph_height}</height>
<generatePng>${project.build.directory}/jmeter/results/G03_ThreadsStateOverTime.png</generatePng>
<relativeTimes>no</relativeTimes>
<paintGradient>no</paintGradient>
<autoScale>no</autoScale>
</graph>
<graph>
<pluginType>ResponseCodesPerSecond</pluginType>
<inputFile>${project.build.directory}/jmeter/results/${prefix_script_name}.csv</inputFile>
<width>${graph_width}</width>
<height>${graph_height}</height>
<generatePng>${project.build.directory}/jmeter/results/G05_ResponseCodesPerSecond.png</generatePng>
<relativeTimes>no</relativeTimes>
<paintGradient>no</paintGradient>
<limitRows>100</limitRows>
<autoScale>no</autoScale>
<excludeLabels>SC[0-9]+_.*</excludeLabels>
<excludeLabelRegex>true</excludeLabelRegex>
</graph>
<graph>
<pluginType>TransactionsPerSecond</pluginType>
<inputFile>${project.build.directory}/jmeter/results/${prefix_script_name}_filtred.csv</inputFile>
<width>${graph_width}</width>
<height>${graph_height}</height>
<generatePng>${project.build.directory}/jmeter/results/G07_TransactionsPerSecondAggregated.png</generatePng>
<relativeTimes>no</relativeTimes>
<aggregateRows>yes</aggregateRows>
<paintGradient>no</paintGradient>
<limitRows>100</limitRows>
<autoScale>no</autoScale>
</graph>
<graph>
<pluginType>ResponseTimesPercentiles</pluginType>
<inputFile>${project.build.directory}/jmeter/results/${prefix_script_name}_filtred.csv</inputFile>
<width>${graph_width}</width>
<height>${graph_height}</height>
<generatePng>${project.build.directory}/jmeter/results/G08_ResponseTimesPercentiles.png</generatePng>
<aggregateRows>no</aggregateRows>
<paintGradient>no</paintGradient>
</graph>
<graph>
<pluginType>ResponseTimesOverTime</pluginType>
<inputFile>${project.build.directory}/jmeter/results/${prefix_script_name}_filtred.csv</inputFile>
<width>${graph_width}</width>
<height>${graph_height}</height>
<generatePng>${project.build.directory}/jmeter/results/G11_ResponseTimesOverTime_SC01.png</generatePng>
<relativeTimes>no</relativeTimes>
<paintGradient>no</paintGradient>
<limitRows>100</limitRows>
<includeLabels>SC01.*</includeLabels>
<includeLabelRegex>true</includeLabelRegex>
<forceY>2000</forceY>
</graph>
</graphs>
<jMeterProcessJVMSettings>
<xms>${jvm_xms}</xms>
<xmx>${jvm_xmx}</xmx>
<arguments>
<argument>-Duser.language=en</argument>
<argument>-Duser.region=EN</argument>
<!-- Date format is not standard,
The format must be the same as declared in the user.properties set for the load test.
Not mandatory but these properties prevent error messages when parsing the results file.
-->
<argument>-Djmeter.save.saveservice.timestamp_format=yyyy/MM/dd HH:mm:ss.SSS</argument>
<argument>-Djmeter.save.saveservice.default_delimiter=;</argument>
</arguments>
</jMeterProcessJVMSettings>
</configuration>
</execution>
</executions>
</plugin>
<plugin>
<groupId>org.codehaus.mojo</groupId>
<artifactId>exec-maven-plugin</artifactId>
<version>1.2.1</version>
<executions>
<execution>
<!-- individual launch : mvn exec:java@aggregate_csv_to_html -->
<id>aggregate_csv_to_html</id>
<phase>verify</phase>
<goals>
<goal>java</goal>
</goals>
<configuration>
<mainClass>io.github.vdaburon.jmeter.utils.ReportCsv2Html</mainClass>
<arguments>
<argument>${project.build.directory}/jmeter/results/G01_AggregateReport.csv</argument>
<argument>${project.build.directory}/jmeter/results/G01_AggregateReportSorted.html</argument>
<argument>sort</argument>
</arguments>
</configuration>
</execution>
<execution>
<!-- individual launch : mvn exec:java@synthesis_csv_to_html -->
<id>synthesis_csv_to_html</id>
<phase>verify</phase>
<goals>
<goal>java</goal>
</goals>
<configuration>
<mainClass>io.github.vdaburon.jmeter.utils.ReportCsv2Html</mainClass>
<arguments>
<argument>${project.build.directory}/jmeter/results/G02_SynthesisReport.csv</argument>
<argument>${project.build.directory}/jmeter/results/G02_SynthesisReportSorted.html</argument>
<argument>sort</argument>
</arguments>
</configuration>
</execution>
<execution>
<!-- individual launch : mvn exec:java@create_html_page_for_files_in_directory -->
<id>create_html_page_for_files_in_directory</id>
<phase>verify</phase>
<goals>
<goal>java</goal>
</goals>
<configuration>
<mainClass>io.github.vdaburon.jmeter.utils.HtmlGraphVisualizationGenerator</mainClass>
<arguments>
<argument>${project.build.directory}/jmeter/results</argument>
<argument>index.html</argument>
</arguments>
<systemProperties>
<systemProperty>
<key>image_width</key>
<value>${graph_width}</value>
</systemProperty>
<systemProperty>
<key>add_toc</key>
<value>true</value>
</systemProperty>
</systemProperties>
</configuration>
</execution>
</executions>
</plugin>
</plugins>
</build>
</project>
In the results directory, you'll find the graphs, CSV files containing reports, and HTML tables for the reports. There is also an index.html page, which allows you to view the results and provides links to the different files. This directory can be found at target/jmeter/results within your Maven project.
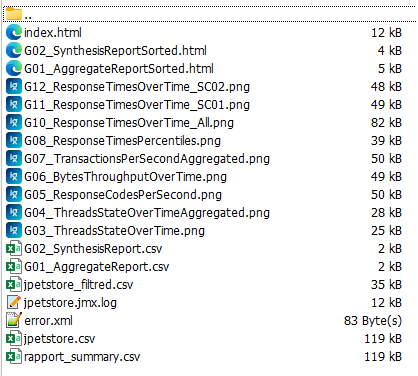
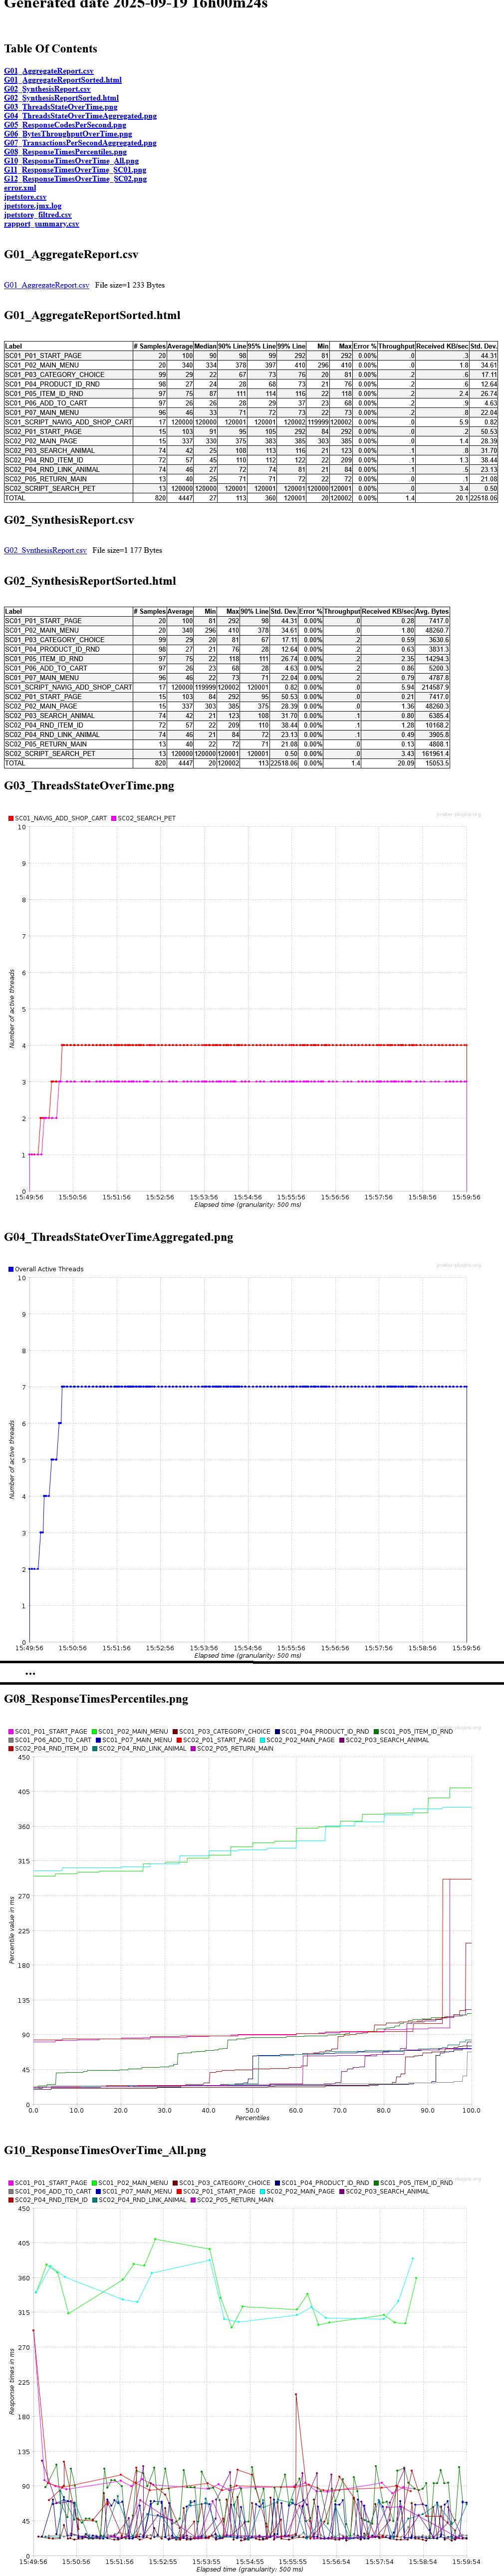
The generated index.html page allows you to view the graphs and access file links directly in your web browser. Here's a glimpse of what the HTML page displays:
The JMeter log file can be found in the directory: target/jmeter/results . This is not the default location; the pom.xml file, specifically pom_01_launch_test.xml , has been modified to specify the file location log:<logsDirectory>${project.build.directory}/jmeter/results</logsDirectory>. Consequently, the created log file is named with a prefixed that combines the script file name and the ".log" extension, for example, jpetstore.jmx.log.
Limitations of the Load Testing Solution With Maven
The limitations encountered don't come directly from Maven itself, but rather from the computer (whether it's a VM or a POD) that is running the load test. When dealing with heavy loads, it's often necessary to modify system settings to increase the limits of the account that runs Apache JMeter. In Linux, the limits can be found in the in the file located at /etc/security/limits.conf. The default values are generally insufficient for high-load testing scenarios.
To check the current limits for a Linux account, you can run the command:ulimit -a
By default, the maximum number of open files and network connections is capped at 1024. Additionally, the number of processes is limited to 4096. To modify these limits, you'll need to edit the /etc/security/limits.conf file as a root user. Make sure to change the values for the Linux user (in this case, JMeter) that is running Java, to accommodate the necessary commands.
jmeter             hard    nproc     16384
jmeter             soft    nproc     16384
jmeter             hard    nofile    16384
jmeter             soft    nofile    16384
When a test is launched by a GitLab Runner (or a Jenkins node), it's essential for the Runner to have system settings adjusted to accommodate CPU load, available memory, and network bandwidth.
Going Further
Additional Steps
To manage the size of the JMeter results and the XML error files, consider adding a compression step, as these files tend to be quite large and compress efficiently. There are two available plugins that can help validate the results against Key Performance Indicators (KPIs):
- JUnitReportKpiJMeterReportCsv (https://github.com/vdaburon/JUnitReportKpiJMeterReportCsv)
- JUnitReportKpiCompareJMeterReportCsv (https://github.com/vdaburon/JUnitReportKpiCompareJMeterReportCsv)
Aditionally, you can broaden your analysis to include the generation of KPI results, allowing your Continuous Integration pipeline to fail if any KPIs fall short. In you need to generate a PDF document from the index.hml page, tools like convert-html-to-pdf (https://github.com/vdaburon/convert-html-to-pdf) can help you accomplish that.
Monitoring
It is important to monitor the environment being tested during load tests. You can incorporate additional steps to start monitoring before the test begins and to stop it after the load test is complete. This way, you can retrieve the files generated during the monitoring phase for further analysis.
It is recommended to use Application Performance Monitoring tools (such as Dynatrace or ELASTIC APM) to observe both the application and the environment throughout the load test.
Opinions expressed by DZone contributors are their own.
Comments