Scaling Prometheus With Thanos
Learn how to scale Prometheus using Thanos for long-term storage, global view metrics, and improved performance in large-scale Kubernetes environments.
Join the DZone community and get the full member experience.
Join For FreeObservability is a crucial pillar of any application, and monitoring is an essential component of it. Having a well-suited, robust monitoring system is crucial. It can help you detect issues in your application and provide insights once it is deployed. It aids in performance, resource management, and observability. Most importantly, it can help you save costs by identifying issues in your infrastructure. One of the most popular tools in monitoring is Prometheus.
It sets a de facto standard with its straightforward and powerful query language PromQL, but it has limitations that make it unsuitable for long-term monitoring. Querying historical metrics in Prometheus is challenging because it is not designed for this purpose. Obtaining a global metrics view in Prometheus can be complex. While Prometheus can scale horizontally with ease on a small scale, it faces challenges when dealing with hundreds of clusters. In such scenarios, Prometheus requires significant disk space to store metrics, typically retaining data for around 15 days. For instance, generating 1TB of metrics per week can lead to increased costs when scaling horizontally, especially with the Horizontal Pod Autoscaler (HPA). Additionally, querying data beyond 15 days without downsampling further escalates these costs.
There are many Projects like Thanos, M3, Cortex, and Victoriametrics. But Thanos is the most popular among these. Thanos addresses these issues with Prometheus and is the ideal solution for scaling Prometheus in environments with extensive metrics or multiple clusters where we require a global view of historical metrics. In this blog, we will explore the components of Thanos and will try to simplify its architecture by building it step by step, starting with the main components. We will also have a demo using k6-metrics. Before diving into Thanos, I recommend reading "Monitoring with Prometheus" if you are not already familiar with Prometheus.
Thanos
Started in November 2017, Thanos is an open-source CNCF incubating project with over 12.8k stars on GitHub. Built on top of Prometheus, Thanos aims to provide a highly available Prometheus environment with long-term storage support and a global view of metrics. Companies like Disney, Abode, eBay, SoundCloud, and ByteDance use Thanos for monitoring at scale. However, setting up Thanos can be complex and requires expertise with Prometheus and industry experience.
Now, let's delve into the components of Thanos and understand its complete architecture.
Thanos Components and Architecture
Thanos Query/Querier
Thanos Query serves as the backend for Thanos, utilizing the gRPC StoreAPI to retrieve data from various components. It is completely stateless and horizontally scalable, allowing it to query multiple sources and merge them into one, effectively avoiding duplicate metrics. With Thanos Query, data can be fetched from various sources. Below is an example of retrieving data from a Thanos Sidecar.
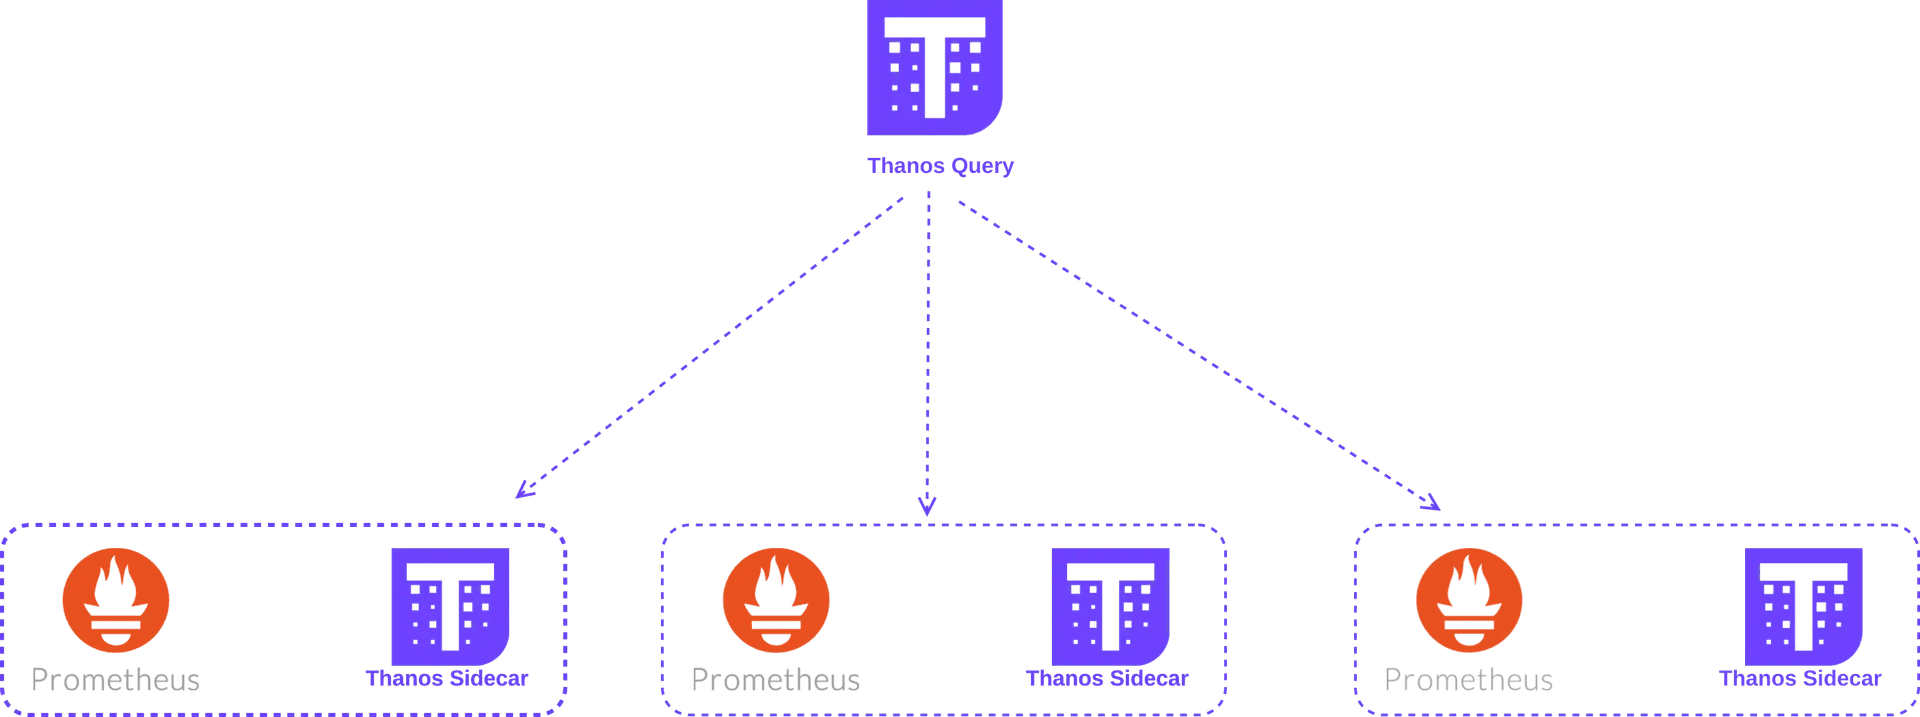
Thanos Query
Prometheus is unaware of StoreAPI, so Thanos Query requests metrics from the Thanos Sidecar. This way, Thanos Query indirectly communicates with the Prometheus instance in a sidecar architecture. While it is possible to deploy Thanos Query without a sidecar model, before that, let's explore the benefits and functionalities of a sidecar model.
Thanos Sidecar
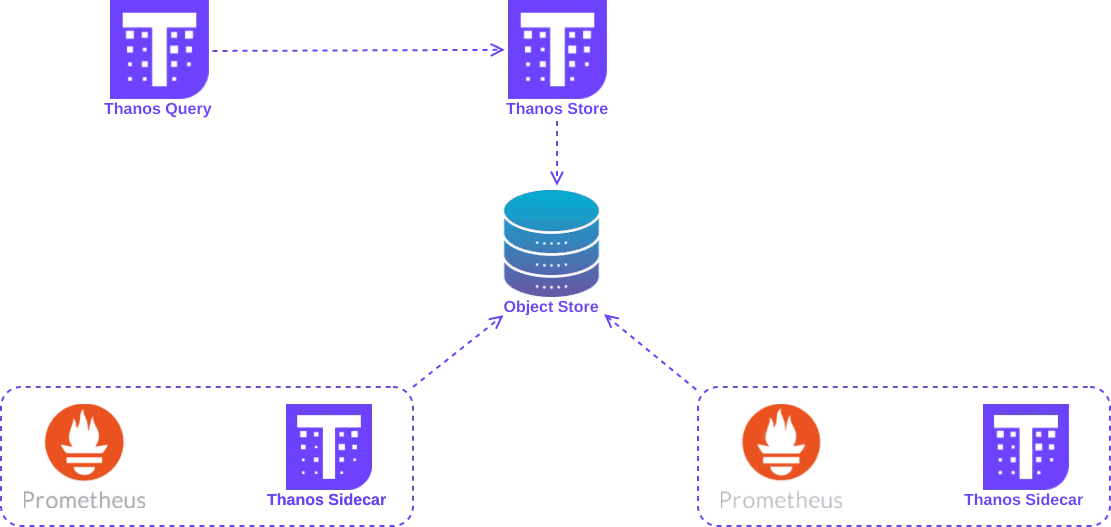
The Thanos Sidecar can do more than just retrieve metrics from Prometheus. It can also store these metrics in an Object Store. Thanos Query can then use the Store Gateway component to fetch data directly from the Object Store, eliminating the need to request metrics from the Sidecar. This allows for reduced retention in Prometheus, resulting in lower disk space usage and cost savings. Sidecar sends TSDB block data from Prometheus to the Object Store every two hours by default, which reduces Prometheus's resource consumption.
To avoid data loss within the two-hour window, Prometheus should remain stateful. However, to make Prometheus stateless, Thanos offers a component called Thanos Receiver. Using Thanos Receiver we can eliminate the sidecar model. Before delving into Receiver, let's explore the functionality of Thanos Store Gateway.
Thanos Store Gateway
Thanos Store Gateway implements the Store API, enabling Thanos Query to retrieve data from the remote Object Store. Acting as an API gateway between the Object Store and Thanos Query, the Thanos Store facilitates efficient data access. The Thanos Sidecar can directly push data to this Object Store. The Store Gateway component keeps some data from the Object Store on its local disk, ensuring proper synchronization with the Object Store. Check out the below illustration.
Thanos Store
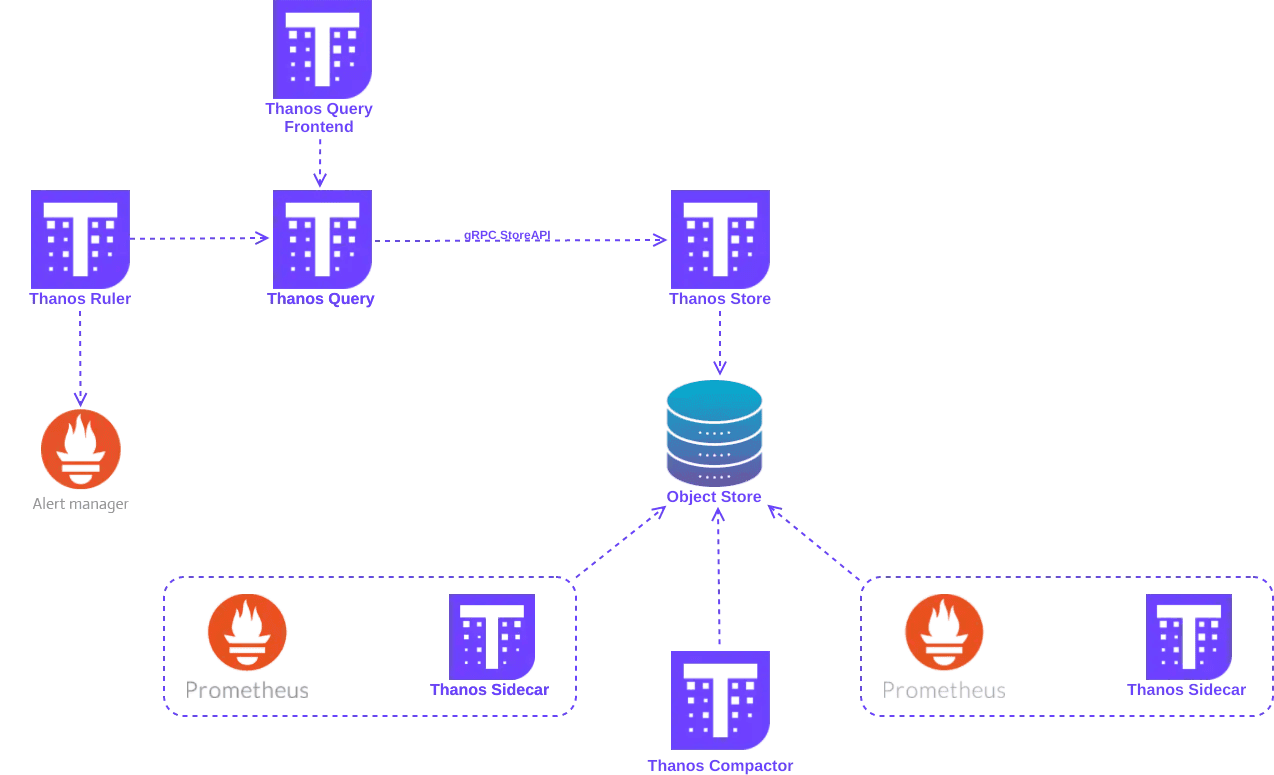
The use of an Object Store eliminates the need to store large amounts of data on disk, helping us save on costs. Whenever we require any data, we can query it using Thanos Query. The Thanos Query features a dashboard component named Thanos Query Frontend, very similar to that of Prometheus, where users can input a PromQL query. The Thanos Query then uses the gRPC Store API to retrieve the data via the Thanos Store.
Thanos Compactor
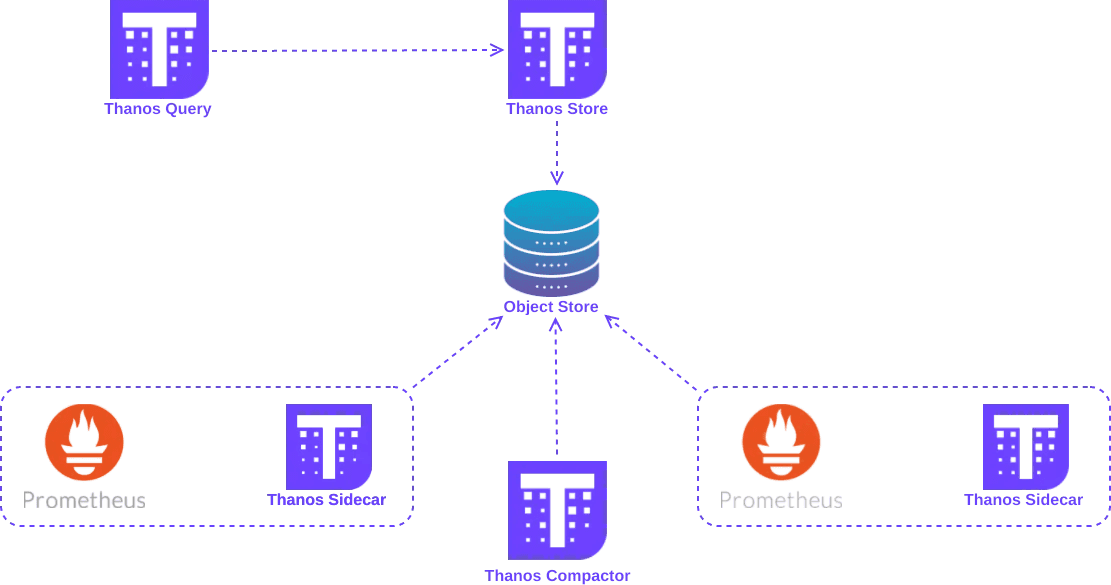
While we can store infinite amounts of data in an Object Store, long-term storage can become costly. Downsampling our data helps mitigate this issue. When we downsample a block of data, we increase the time interval of the data points, for example, from a one-minute block to a five-minute block. This not only reduces storage costs but also enhances query performance using PromQL.
Thanos Compactor
The Compactor is the sole component in Thanos with the capability to delete data from the Object Store while all other components only have write permissions. The Compactor consolidates multiple blocks of data into one, optimizing storage efficiency. It's best practice to run only one instance of the Compactor against an Object Store.
Thanos Ruler
Thanos Ruler evaluates the Prometheus recording and alerting rule against the passed query and can be used for alerting purpose. By default, the evaluated results by Thanos Ruler are written back to the disk. The Thanos Ruler can be configured to store these results in a remote Object Store.
Thanos Receiver
Using Thanos Receiver simplifies the complexities associated with the Thanos Sidecar. When using the sidecar, permissions must be granted for sidecar components to push metrics to the object store, which involves opening a new port for communication with the store. Thanos Receiver eliminates this complexity.
With Thanos Receiver, Prometheus is configured to use its remote write feature to send metrics directly to the receiver. The Thanos Receiver then pushes these metrics to the object store. The diagram below illustrates this setup. Prometheus continuously writes metrics to the Thanos Receiver, which, by default, pushes these metrics to the object store after two hours. To query metrics in real-time, the Thanos Receiver exposes a Store API for Thanos Query which can be useful for developers to see live metrics after deployment.
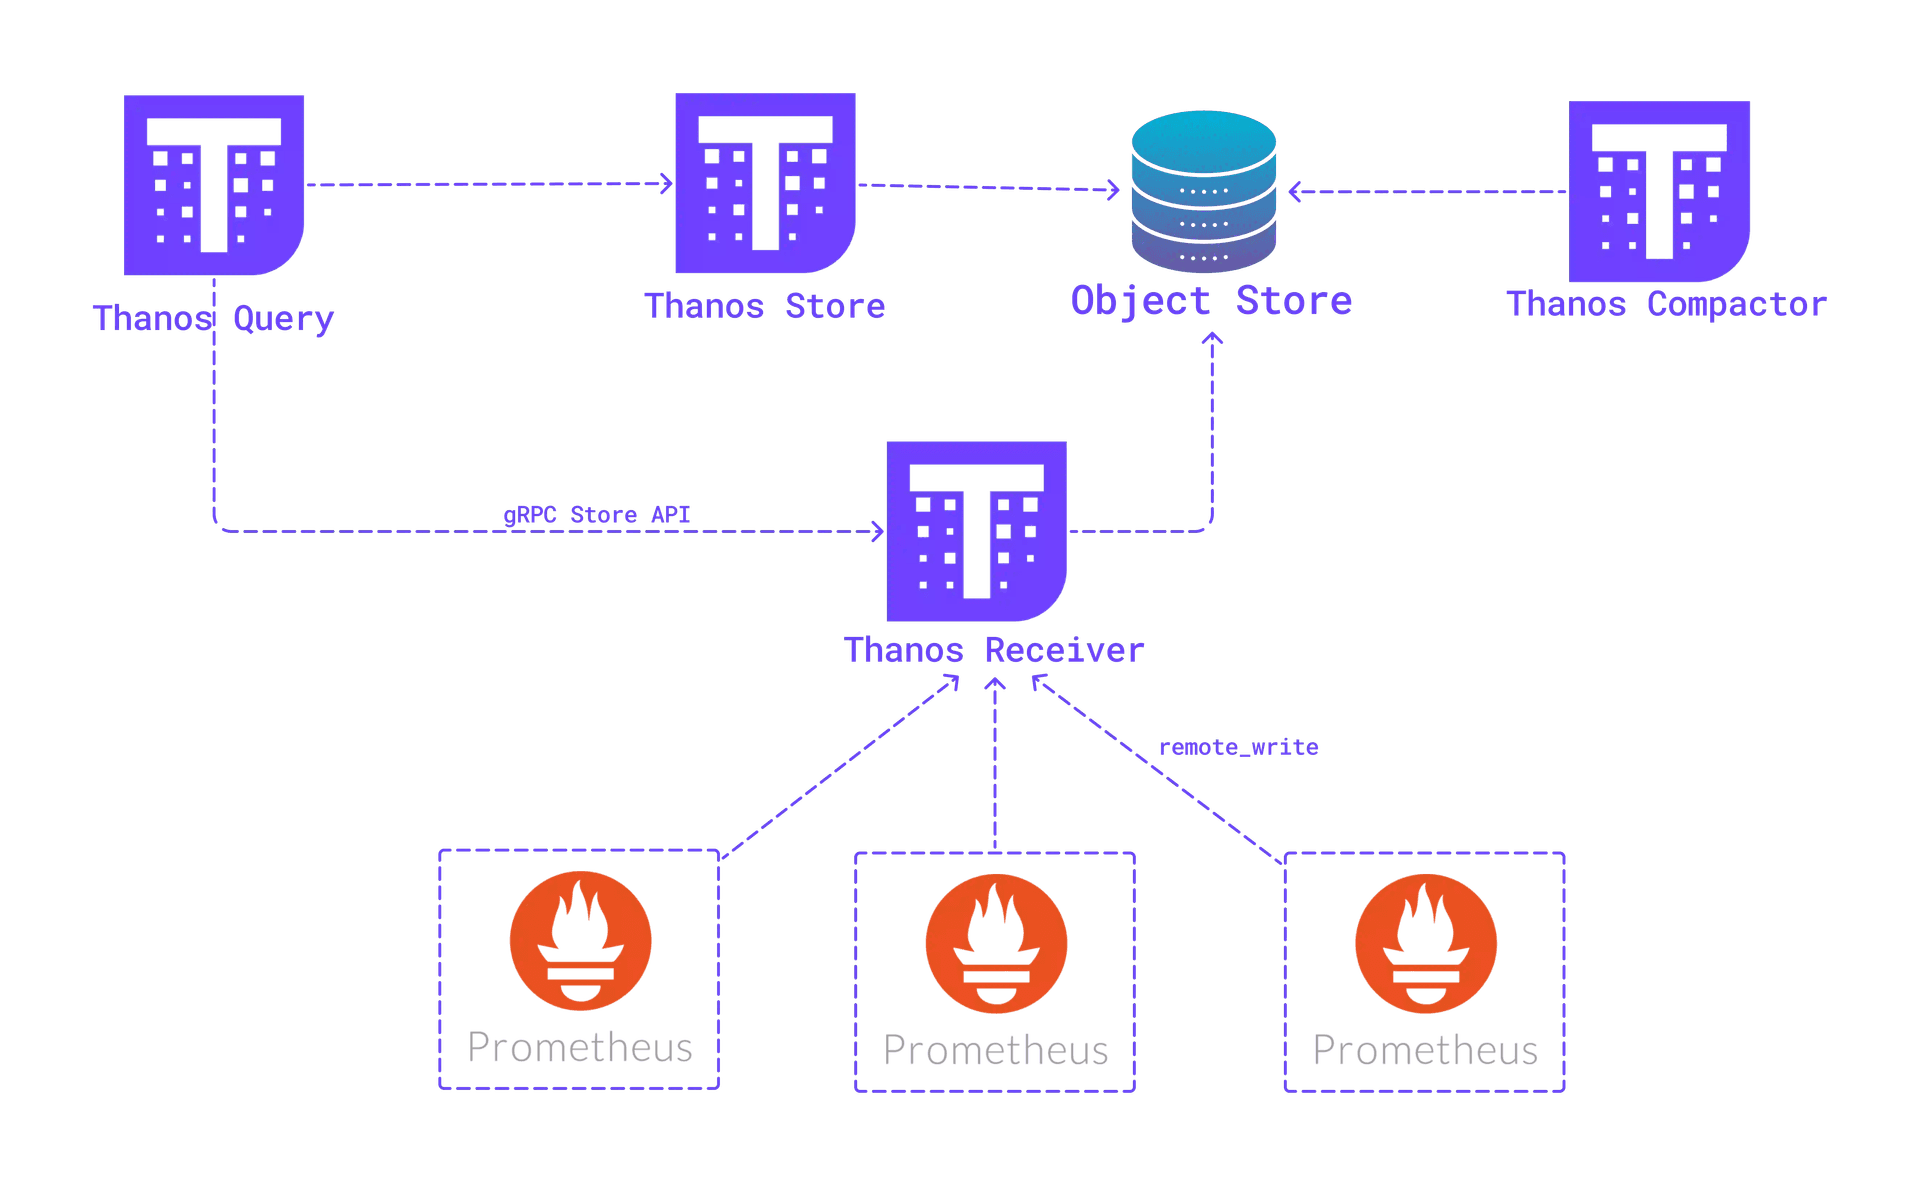
Thanos Receiver
Thanos Receiver needs to determine how to distribute incoming time-series data across different nodes. To address this, Thanos Receiver employs a hashring mechanism. When Thanos Receiver is configured on Kubernetes it takes the help of Thanos Receiver controller which automates the hashring management. This component keeps the hashring up-to-date when the Thanos receiver is scaled using HPA or other auto-scalers.
Thanos Query Frontend
The Thanos Query frontend is a dashboard provided by Thanos that is similar to the Prometheus Dashboard. It also uses PromQL as its query language. With this component, users can ask for metrics from the Thanos Query component.
Installation and Demo
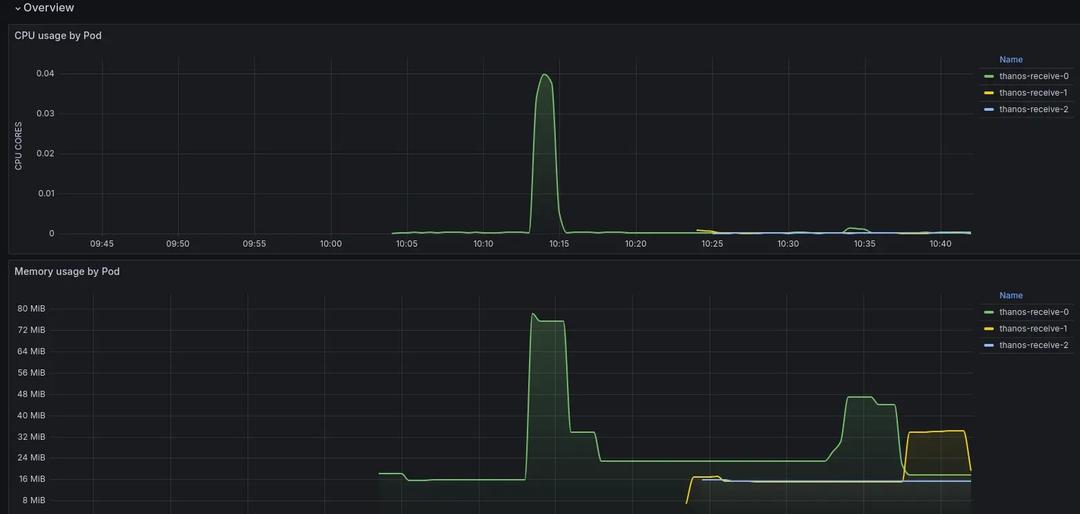
In this demo, we will test Thanos and scale Thanos receiver using k6s-metrics.
- Installing Minio for object storage
- Installing Thanos and Prometheus
- Load test using k6s-metrics
Let's start by creating a kind cluster.
kind create cluster --name my-cluster --config=<(cat <<EOF
kind: Cluster
apiVersion: kind.x-k8s.io/v1alpha4
nodes:
- role: control-plane
- role: worker
- role: worker
EOF
)
Installing Minio (Object Store)
Minio is a popular open-source object storage, an alternative to AWS S3 that we are using here in our local setup. If you have S3 or similar storage, you can use it here.
- Run the script below to install Minio in the thanos-test namespace.
#!/bin/bash

set -e
kubectl create ns thanos-test
echo "Installing Minio using Helm charts..."
helm repo add bitnami https://charts.bitnami.com/bitnami
helm install minio bitnami/minio --version 14.2.0 -n thanos-test
sleep 40
echo "Exposing Minio on 127.0.0.1:8080"
echo "Username for Minio: admin"
echo "Password for Minio: $(kubectl get secrets -n thanos-test minio  -o json | jq -r '.data."root-password"' | base64 -d)"
kubectl port-forward svc/minio 8080:9001 -n thanos-test &
echo- Access the Minio dashboard at port 8080 and create a new bucket named
“thanos”. Also, create an access key and secret. Once done, create a secret as of below and replace the access key and secret field.
apiVersion: v1
kind: Secret
metadata:
  name: minio-thanos
  namespace: thanos-test
stringData:
  objstore.yml: |
    type: S3
    config:
      bucket: "thanos"
      endpoint: "minio.thanos-test.svc.cluster.local:9000"
      insecure: true
      access_key: <ACCESS_KEY>
      Secret_key: <SECRET_KEY>
yaml
Installing Thanos and Prometheus
Please execute the following script to install Thanos and Prometheus.
#!/bin/bash

echo "Installing Thanos in $(kubectl config current-context)"
helm repo add bitnami https://charts.bitnami.com/bitnami
helm install thanos bitnami/thanos --version 15.1.0 -n thanos-test
sleep 60
echo "thanos is installed"
kubectl get all -n thanos-test
echo "Exposing thanos on 127.0.0.1:8081"
kubectl port-forward svc/thanos-query-frontend -n thanos-test 8081:9090 &
echo "Exposing grafana on 127.0.0.1:8082"
kubectl port-forward svc/grafana -n thanos-test 8082:3000 &
echo "Password for grafana: $(kubectl get secrets -n thanos-test grafana-admin -o json | jq -r '.data."GF_SECURITY_ADMIN_PASSWORD"' | base64 -d)"
echo "Username for grafana: admin"
echo "For mointoring purpose installing kube-prometheus-stack"
helm repo add prometheus-community https://prometheus-community.github.io/helm-charts
helm install kube-prometheus-stack prometheus-community/kube-prometheus-stack --version 58.2.1 -n thanos-test -f kube-prometheus-stack-values.yaml
sleep 60
echo "Prometheus installed connect with grafana at port 8082"
bash
Testing Using k6s-metrics
Use the below script to test Thanos. You can change the virtual users and other fields.
import { check, sleep } from 'k6';
import remote from 'k6/x/remotewrite';

export let options = {
  vus: 100,
  duration: '800s',
};

const client = new remote.Client({
  url: 'http://127.0.0.1:8085/api/v1/receive',
});

export default function () {
  let res = client.store([
    {
      labels: [
        { name: '__name__', value: `test_metric_${__VU}` },
        { name: 'service', value: 'bar' },
      ],
      samples: [{ value: Math.random() * 100 }],
    },
  ]);
  check(res, {
    'is status 200': (r) => r.status === 200,
  });
  sleep(1);
}
javascript
You can use Grafana to visualize the Thanos receiver consumption. More Grafana dashboards are available here.
Conclusion
Some of the benefits of using Thanos are:
- Long-term metrics storage
- Save cost by using Object Store
- Efficient query with Global View
- HA Prometheus instance
- Data deduplication
Integrating Thanos into your monitoring setup can enhance your application by providing access to historical data and overcoming the limitations of a standalone Prometheus setup. Additionally, Thanos can help reduce the costs associated with Prometheus. However, Thanos may not be the ideal solution for everyone. Determine what’s best for your infrastructure.
Published at DZone with permission of Ritesh Sonawane. See the original article here.
Opinions expressed by DZone contributors are their own.
Comments