DZone
Thanks for visiting DZone today,
Edit Profile
  • Manage Email Subscriptions
  • How to Post to DZone
  • Article Submission Guidelines
Sign Out View Profile
  • Post an Article
  • Manage My Drafts
Over 2 million developers have joined DZone.
Log In / Join
Please enter at least three characters to search
Refcards Trend Reports
Events Video Library
Refcards
Trend Reports

Events

View Events Video Library

Zones

Culture and Methodologies Agile Career Development Methodologies Team Management
Data Engineering AI/ML Big Data Data Databases IoT
Software Design and Architecture Cloud Architecture Containers Integration Microservices Performance Security
Coding Frameworks Java JavaScript Languages Tools
Testing, Deployment, and Maintenance Deployment DevOps and CI/CD Maintenance Monitoring and Observability Testing, Tools, and Frameworks
Culture and Methodologies
Agile Career Development Methodologies Team Management
Data Engineering
AI/ML Big Data Data Databases IoT
Software Design and Architecture
Cloud Architecture Containers Integration Microservices Performance Security
Coding
Frameworks Java JavaScript Languages Tools
Testing, Deployment, and Maintenance
Deployment DevOps and CI/CD Maintenance Monitoring and Observability Testing, Tools, and Frameworks

Because the DevOps movement has redefined engineering responsibilities, SREs now have to become stewards of observability strategy.

Apache Cassandra combines the benefits of major NoSQL databases to support data management needs not covered by traditional RDBMS vendors.

The software you build is only as secure as the code that powers it. Learn how malicious code creeps into your software supply chain.

Generative AI has transformed nearly every industry. How can you leverage GenAI to improve your productivity and efficiency?

Related

  • Distributed Tracing System (Spring Cloud Sleuth + OpenZipkin)
  • Java, Spring Boot, and MongoDB: Performance Analysis and Improvements
  • Improving Backend Performance Part 1/3: Lazy Loading in Vaadin Apps
  • How to Create Microservices Using Spring

Trending

  • Introduction to Retrieval Augmented Generation (RAG)
  • The Perfection Trap: Rethinking Parkinson's Law for Modern Engineering Teams
  • ITBench, Part 1: Next-Gen Benchmarking for IT Automation Evaluation
  • How Kubernetes Cluster Sizing Affects Performance and Cost Efficiency in Cloud Deployments
  1. DZone
  2. Software Design and Architecture
  3. Cloud Architecture
  4. Spring Cloud With Turbine

Spring Cloud With Turbine

Here's how to use Spring Cloud with Turbine, and a look at Netflix Hystrix, which sends real-time metrics, not movies.

By 
Biju Kunjummen user avatar
Biju Kunjummen
·
Jan. 22, 16 · Tutorial
Likes (8)
Comment
Save
Tweet
Share
40.6K Views

Join the DZone community and get the full member experience.

Join For Free

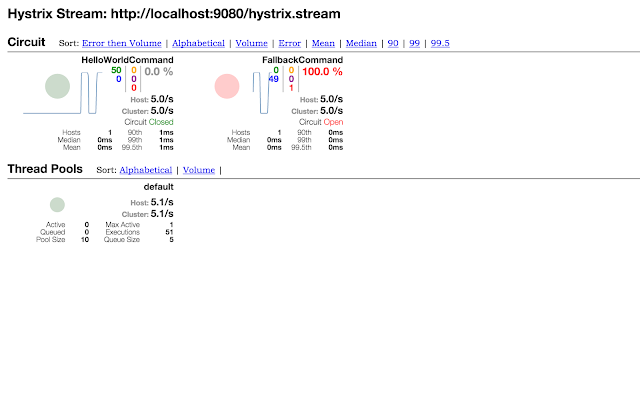
Netflix Hystrix has a neat feature called the Hystrix stream that provides real-time metrics on the state of the Hystrix commands in an application. This data tends to be raw though. A very cool interface called the Hystrix Dashboard consumes this raw data and presents a graphical information based on the underlying raw data:

Integrating Hystrix Support and Dashboard

In a Spring-Cloud project it is very trivial to expose the Hystrix stream, as it only requires a starter application for Hystrix to be added in as a dependency and the stream functionality is available to the web application. 

Step 1: Add the Spring-Cloud-Starter-hystrix:

view sourc

<dependency>
<groupId>org.springframework.cloud</groupId>
<artifactId>spring-cloud-starter-hystrix</artifactId>
</dependency>

Step 2: Enable Hystrix support for the Application, this will expose the hystrix stream at a "/hystrix.stream" uri:

@SpringBootApplication
@EnableHystrix
public class SpringCloudApp {

public static void main(String[] args) {
SpringApplication.run(SpringCloudApp.class, args);
    }
}

Now for the Hystrix Dashboard application to graphically view the Hystrix stream, the following annotation will enable that and the application should be available at "/hystrix" uri:

@SpringBootApplication
@EnableHystrixDashboard
public class AggregateApp {

  public static void main(String[] args) {
SpringApplication.run(AggregateApp.class, args);
}
}

Spring Cloud With Turbine

Hystrix stream provides information on a single application, Turbine provides a way to aggregate this information across all installations of an application in a cluster. Integrating turbine into a Spring-Cloud based application is straightforward, all it requires is information on which clusters to expose information on and how to aggregate information about the specific clusters. As before to pull in the dependencies of Turbine:

<dependency>
<groupId>org.springframework.cloud</groupId>
<artifactId>spring-cloud-starter-turbine</artifactId>
<exclusions>
<exclusion>
<groupId>javax.servlet</groupId>
<artifactId>servlet-api</artifactId>
</exclusion>
</exclusions>
</dependency>

And to enable Turbine support in a Spring Boot based application:

@SpringBootApplication
@EnableHystrixDashboard
@EnableTurbine
public class MonitorApplication {

  public static void main(String[] args) {
SpringApplication.run(MonitorApplication.class, args);
}

}

This application is playing the role of both showing the Hystrix Dashboard and exposing turbine stream. Finally the configuration for turbine:

turbine:
aggregator:
clusterConfig: SAMPLE-HYSTRIX-AGGREGATE
appConfig: SAMPLE-HYSTRIX-AGGREGATE

Given this configuration a turbine stream for SAMPLE-HYSTRIX-AGGREGATE cluster is available at "/turbine.stream?cluster=SAMPLE-HYSTRIX-AGGREGATE" uri, it would figure out the instances of the cluster using Eureka, source the Hystrix stream from each instance and aggregate it into the Turbine stream. If we were to view the Hystrix dashboard against this stream:

If you look at the counts against the host now, it indicates the two hosts for which the stream is being aggregated.

I have brushed over a lot of details here, an easier way to check the details may be to check my github project here.

Spring Cloud Spring Framework application Stream (computing) cluster Dashboard (Mac OS) Spring Boot Host (Unix) Data (computing)

Published at DZone with permission of Biju Kunjummen. See the original article here.

Opinions expressed by DZone contributors are their own.

Related

  • Distributed Tracing System (Spring Cloud Sleuth + OpenZipkin)
  • Java, Spring Boot, and MongoDB: Performance Analysis and Improvements
  • Improving Backend Performance Part 1/3: Lazy Loading in Vaadin Apps
  • How to Create Microservices Using Spring

Partner Resources

×

Comments
Oops! Something Went Wrong

The likes didn't load as expected. Please refresh the page and try again.

ABOUT US

  • About DZone
  • Support and feedback
  • Community research
  • Sitemap

ADVERTISE

  • Advertise with DZone

CONTRIBUTE ON DZONE

  • Article Submission Guidelines
  • Become a Contributor
  • Core Program
  • Visit the Writers' Zone

LEGAL

  • Terms of Service
  • Privacy Policy

CONTACT US

  • 3343 Perimeter Hill Drive
  • Suite 100
  • Nashville, TN 37211
  • support@dzone.com

Let's be friends:

Likes
There are no likes...yet! 👀
Be the first to like this post!
It looks like you're not logged in.
Sign in to see who liked this post!