

The Basics of Breakpoints You Might Not Know
We work with debuggers practically every day and yet so much remains unknown. In this article, dig deeper into the tools afforded to us by the debugger!
 CORE
·
CORE
·
Join the DZone community and get the full member experience.
Join For Free
In episodes 4 and 5 of “140 Second Ducklings”, I got deeper into the more advanced underpinnings of breakpoints. There’s still a lot more to learn to move forward, but even at this stage, it’s surprising how many things are relatively unknown in the developer community, and I’m just getting started.
Duckling the 5th:
— Shai Almog (@debugagent) March 8, 2022
Did you know you can disable a breakpoint until you hit another breakpoint?
Do you know what's a tracepoint?
You can group breakpoints together which is very helpful for thorny bugs!#CodeNewbie #140SecondDucklings pic.twitter.com/KfgrAb9qec
Types of Breakpoints
There are four basic types of breakpoints.
Line Breakpoint
When we say breakpoint, this is usually what we mean. This is the default breakpoint. I’m including here class breakpoints which effectively step into the constructor later on and are semantically line breakpoints.
Method Breakpoint
Method breakpoints stop when you enter a method and potentially when you exit it. IDEs like IntelliJ simulate these through-line breakpoints. The reason is that method breakpoints perform pretty badly on the JVM, so you shouldn’t use them for most cases.
There is an interesting use case of method breakpoints which I will discuss in the next blog post on the subject. So make sure you follow: it’s an interesting one!

Field Watchpoint
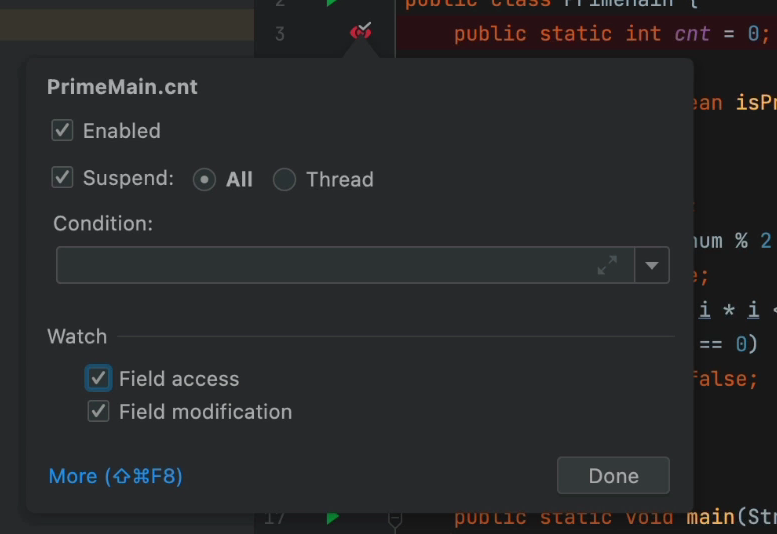
This isn’t a breakpoint since the execution never stops at the field. It stops in the line of code that accesses the field. You can optionally toggle this so it will stop only for write, only for read, or in both cases.
This is a remarkably useful feature that very few developers use. “Who changed this field” is a debugging cliché, yet developers still aren’t aware of this feature (or forget it exists).
Exception Breakpoint
The exception breakpoint is a remarkably useful feature that everyone knows about…but everyone shuns and hates. I totally understand this. The default IDE behavior of stopping on every exception is redundant and infuriating!
It makes that feature useless.
This is a remarkable feature that can work with one small toggle. The crux of the issue is false positives; code that stops on an exception thrown and caught inside the JVM. This is obviously redundant and happens a lot (e.g., in networking code).
I’ll release the video discussing the solution next week, so be sure to follow along. The next post in the series will cover that.
Conditional Breakpoints
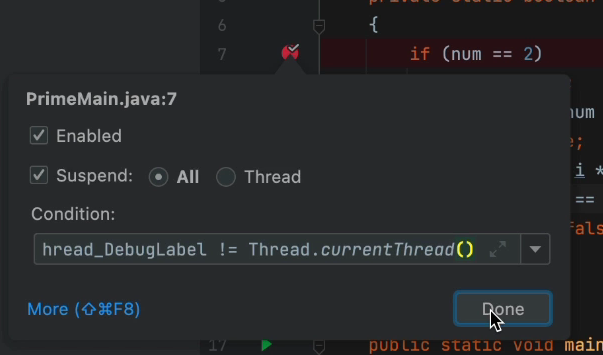
Conditions can apply to any breakpoint type mentioned above. I went back to my previous post in this series where I discussed object marking. Object marking effectively lets me define a new global variable label, so I could save Thread.currentThread() as a variable with a new name MyThread. Then I used a condition:
Thread.currentThread() == MyThread_DebugLabel
This effectively means I will stop only if this method is invoked using a different thread than the one I saw previously. Debugging threading issues?
This is an amazing tool:
Managing Breakpoints
When we’re debugging a complex application, we often spread breakpoints all over the place trying to reproduce a scenario where a specific set of breakpoints will lead us on the right “journey”.
Unfortunately, we often end up with many problems because of this policy. This leads most developers in the wrong direction of setting too few breakpoints or just going over them one by one. There are better ways.
Grouping/Naming
This is a problem I run into when I have a lot of breakpoints all over the place, especially for multiple projects (client, server, etc.). It’s very hard to keep track of everything.
You can add a description to a breakpoint to remind you why it’s there: for example if there’s an error you’re trying to reproduce, but it NEVER happens. Just place a breakpoint in the relevant line, and hope that it gets hit at some point.
But if you’re like me, you might see it in the breakpoint window and forget that it’s there, then just delete it. By editing the description, you can remind yourself why you added that breakpoint in the first place. It’s also very useful for pair debugging. To make sure we’re on the same page:
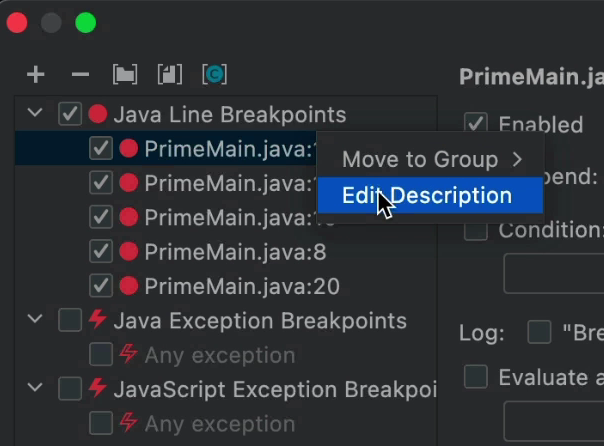
Grouping takes this to the next level. You can place several breakpoints in a group (e.g. “Debug Issue 333”), then you can disable or enable the group as a whole. This is something I use for context switching. I sometimes need to work on a different task while I’m in the midst of debugging. I don’t remember “where I was," so I can just group the applicable breakpoints and disable them until I “get back.”
Disable Until
This is a very common case. There’s an area of the code that gets “hit” a lot, so placing a breakpoint there is useless. You’d just press continue all the time.
You want to debug that area, but only after a specific condition is met. You can place a breakpoint in that other area and use “Disable Until” to disable the high-volume breakpoint.
Once the low-volume breakpoint is hit, it will enable the high volume one. You can choose whether it will be enabled for good or just once.
This is something I see people doing manually all the time: setting the low traffic breakpoint and then manually setting or enabling the high traffic breakpoint. That’s OK, but if you do it a lot, it’s error-prone.
Tracepoints
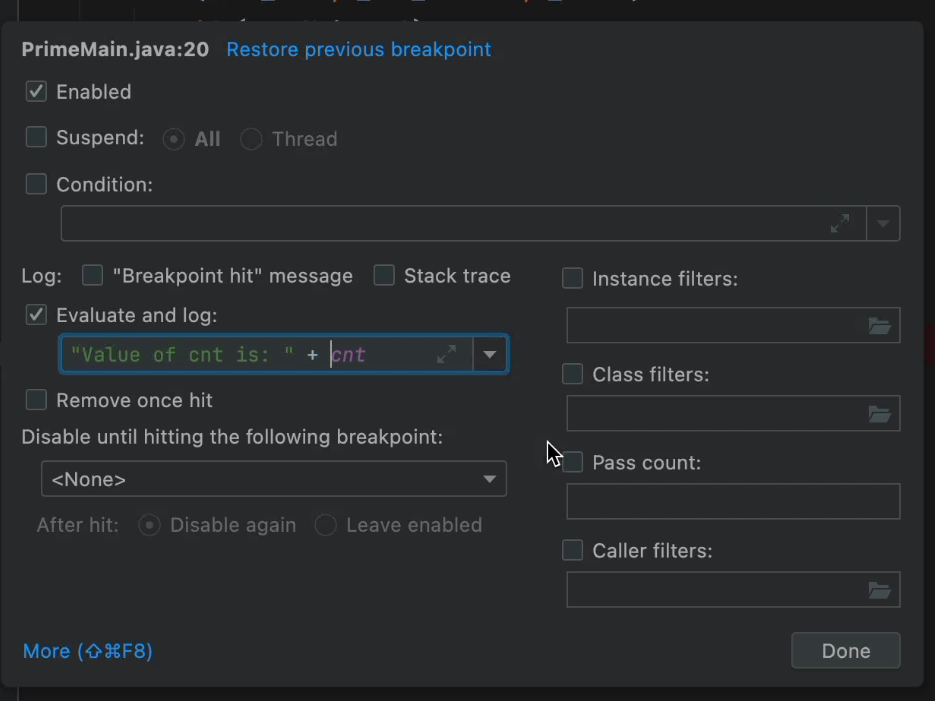
We can use a breakpoint as an ad hoc log that doesn’t suspend execution. You can just add printouts that can include expressions, etc. While this has some limitations, it’s still a pretty cool feature.
TL;DR
Many of us work with debuggers practically every day and yet so much remains unknown. We’re operating this fantastically complex tool while using 4 or 5 big features: line breakpoint, step over, step into, continue and watch.
In order to compensate, developers use tricks such as removing the breakpoint and setting it again, etc. I’ve been guilty of that sin myself.
It’s time we dig deeper into the tools afforded to us by the debugger!
Published at DZone with permission of Shai Almog. See the original article here.
Opinions expressed by DZone contributors are their own.
Comments