The Fishbone Diagram
The Fish-Bone diagram is a simple but effective method to help view problems in a new light. This can lead to better root cause analysis and innovative solutions.
Join the DZone community and get the full member experience.
Join For Free
One of the many things that is common between Lean and Agile is that they make problems visible. Most of the time when we see a problem, we look for the most obvious solution and implement that solution. Sometimes, especially with complex problems, the most obvious solution is not the best solution; sometimes you have to dig deeper to get to the actual root cause.
There are a number of techniques to analyze problems and try to get more information or a better exploration of the issue. The most common is the 5 Whys Method, wherein you ask “Why” 5 times. Another method which I would like to discuss is the Fishbone diagram, also known as the Cause and Effect diagram.
The fishbone diagram is a graphical method to view possible causes of the problem. It does not help you solve the problem, but does identify potential root causes. You can then experiment to determine the actual root cause and possible solutions.
The diagram gets its name from its shape. It, well, looks like the bones of a fish.
To draw the diagram is quite simple. At the head of the fish is the problem, also known as the undesirable effect. It is better if you phrase the problem as a question rather than a statement. “Why did <problem> happen?” rather than just “Problem.” Sometimes phrasing things as a question gets a better thought process than just a statement. Once you have the head, then you have the spine and from the spine, the ribs which represent the groups of causes. The causes then branch off the ribs.
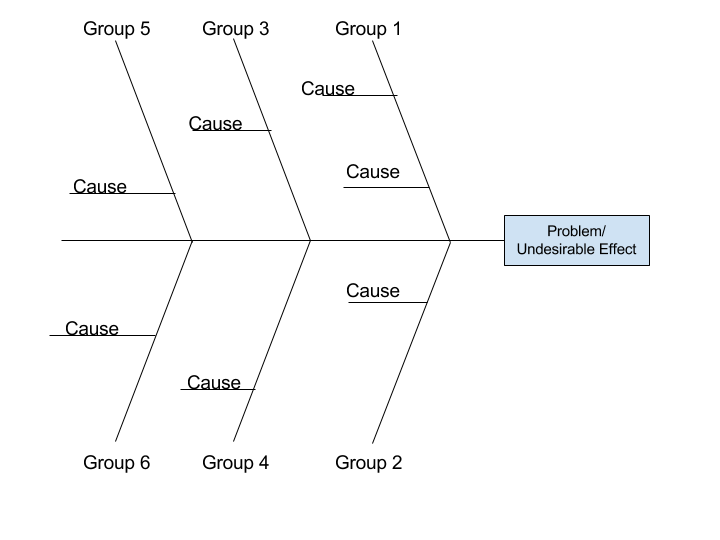
As you can see, the diagram is quite simple and quickly shows how potential causes relate to one another.
There are two popular brainstorming methods to getting the fishbone diagram.
The first is to brainstorm possible causes and write them down on “Post-It” notes on a wall. Group the post-its together by relationship to one another. Those relationships become the ribs of the diagram.
The second method is to pre-label the ribs. An example may be to use “People,” “Process,” and “Technology” (You don’t have to have an even number of ribs). This method helps focus on possible causes, but can limit thinking to only within these groups.
Below is a completely fabricated example where the problem/undesirable effect was that a calculation of 2 numbers led to the wrong value.

As you can see, there is no “solution” to the issue. We are just looking at possible reasons as to why the defect occurred.
The next step in the process is to discuss, and analyze the possible causes and then find ways to mitigate them from happening.
The Fish-Bone diagram is a simple but effective method to help view problems in a new light. This can lead to better root cause analysis and innovative solutions.
Published at DZone with permission of Holger Paffrath. See the original article here.
Opinions expressed by DZone contributors are their own.
Comments