The Importance of Graph Visualization Tools: Exploring the Paradise Papers
You can have access to all of the data in the world, but if you do not have the proper tools to analyze and learn the significance of your data then it is worthless.
Join the DZone community and get the full member experience.
Join For FreeData is quickly becoming known as the new oil. Its value is rapidly increasing, but similar to oil, data only has value if you can access it and know how to use it. You can have access to all of the data in the world, but if you do not have the proper tools to analyze and learn the significance of your data then it is worthless. This is why graph visualization tools are so important.
Arcade Analytics has incredible cutting-edge visualization tools that can help users leverage their data. Being able to see relationships in data is crucial to unlocking your data's potential. With graph visualization tools such as Arcade, these relationships become much more apparent and prevalent.
One of the best use cases to see Arcade in action is the Paradise Papers dataset on Neo4j. To learn more about the Paradise Papers, click here to read Neo4j’s blog post. Arcade integrates with Neo4j using a Cypher connector and allows users to see connections that would otherwise be missed. You can see the results for yourself by playing with data on Arcade's Demo. Click here to try it out yourself. To see a few different ways that you can explore the Paradise Papers with Arcade, check out our instructions below.
Explore the Paradise Papers
To help you see the all of the advantages Arcade can offer, check out the different ways to visualize the Paradise Papers below.
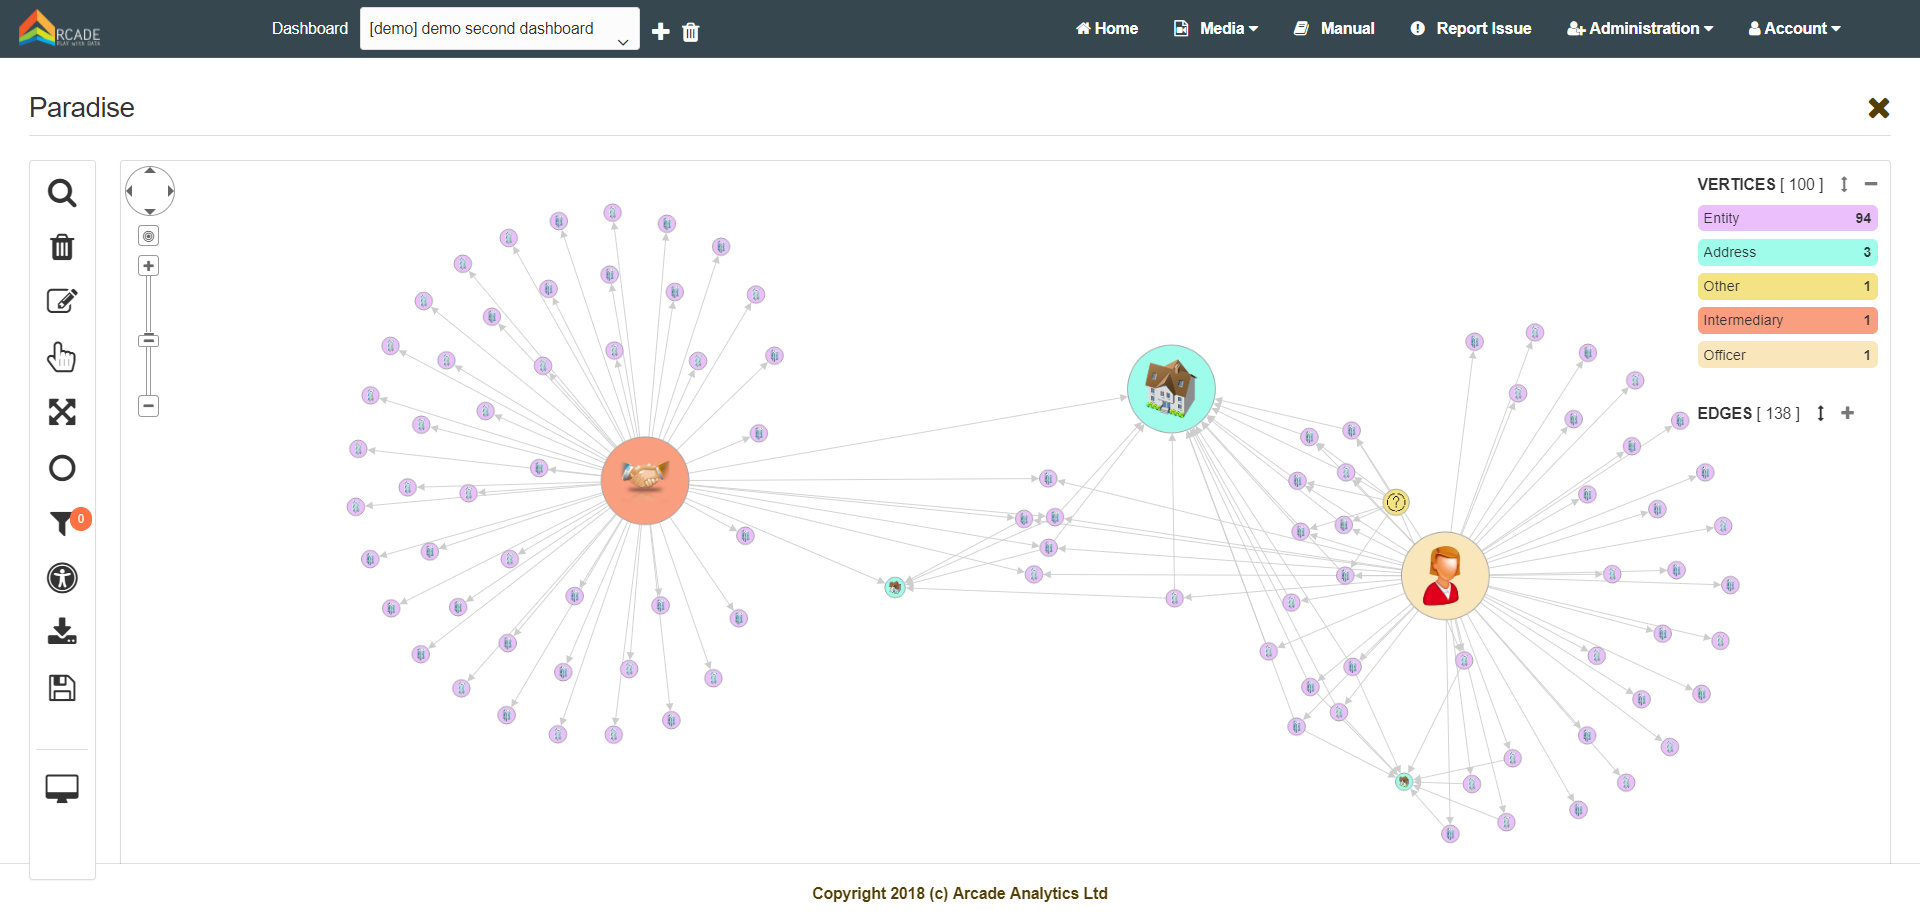
The “Paradise” widget in the Arcade demo uses this default query, recommended by Neo4j, as the starting point:
MATCH p=(o:Officer {name: “The Duchy of Lancaster”})-[*..2]-()
RETURN p
The default widget also has some node customization to give you a solid starting point.

Let’s dive into the graph!
The Paradise database is fully searchable through the text search bar. Start by searching for the term “bermuda”. A list similar to the one below should populate in your dashboard. Select a few of the options below and load them onto your screen.

Once the new nodes have appeared, select the nodes and traverse the incoming relations to expand the graph as seen below:

The selection menu allows you to search inside the loaded graph. You can select all, or parts, of the graph. You can also find the shortest path between two nodes on opposite ends of the graph.

You can now use this visualization to explore relationships within the dataset. Analyze the Paradise Papers in new and exciting ways. Personalize the nodes by changing the images, label, or layout. Use Arcade’s graph visualization tool to explore data like you never have before, and most importantly, have fun.
Published at DZone with permission of John Johnson. See the original article here.
Opinions expressed by DZone contributors are their own.
Comments