Tools for Querying Logs With SQL
Logging is vital for any software project. In this post, we'll look at three different solutions for querying logs and show you how they work.
Join the DZone community and get the full member experience.
Join For FreeLogging is vital for any software project, from development to ongoing management. Maintenance logs are crucial for determining the state of an application and monitoring and troubleshooting purposes. These days, logging is usually embedded throughout an application, from simple user access logs to database activity, error logs, and network flow logs.
In this post, we will walk through the following SQL and logging options.
| Logging Solution | Custom Query Language | SQL Enabler | Hosted | Query in Arctype |
|---|---|---|---|---|
| LogTail | n/a | ClickHouse | Better Stack | Soon |
| Promscale | PromQL | built-in | Timescale | Yes |
| Logflare | LQL | BigQuery | Supabase | Soon |
Basics of Querying Logs
The available options to query logs will differ based on the platform. While some platforms offer domain-specific query languages based or derived from other languages and patterns (like NoSQL, SQL, JSON, and Regex), others might offer the ability to utilize commonly known languages, like SQL. The table above summarizes that.
Why Query Your Logs With SQL?
SQL is the most commonly used language in the industry to interact with databases. Using it to search logs means you do not have to learn a new syntax. Functionality like SQL triggers to update a database objects are built in. For example, an update in a log table could trigger an event to clean the data and copy it to a newly formatted table.
Advantages of SQL Over Other Log-Querying Approaches
- SQL is relatively simple compared to domain-specific languages and other options like Regex.
- SQL enables advanced functionality like SQL triggers and stored procedures when querying logs.
- SQL is an efficient choice for transactional data, like logs with a static structure.
- SQL is fast when running analytical queries compared to other options.
Let's look at 3 competing querying solutions available in the market. We will be querying system logs from an Nginx installation on an ubuntu server for all the following examples.
LogTail
LogTail by Better Stack offers a SQL-compatible structure for log management, based on the open-source, column-oriented database management system ClickHouse. It allows users to collect logs across your software stack, from system logs to databases, Docker, and more.
LogTail has built-in features to create dashboards using Grafana, which is integrated as a part of the platform and supports collaboration between team members. LogTail also integrates with external data stores like AWS S3 Glacier for long-term, cost-effective archiving needs. This platform is designed with security in mind and utilizes GDPR-compliant DIN ISO/IEC 27001-certified data centers to store and manage customer data.
How to Use LogTail
LogTail is a managed service that requires users to create an account on the platform. Then they need to obtain an API Token to authorize the requests from the agents to ingest data to the platform. This is done by creating a connection source within LogTail. Users can ingest logs using a preferred agent only after completing this step.
While the recommended forwarder is Vector by Datadog, LogTail also supports other options like Fluent Bit, Logstash, Fluentd, and Syslog. Users only need to create a LogTail account and obtain an API Token to authorize the requests from the agents to ingest data to the platform.
Ingesting and Querying Logs Using LogTail
Data Ingestion
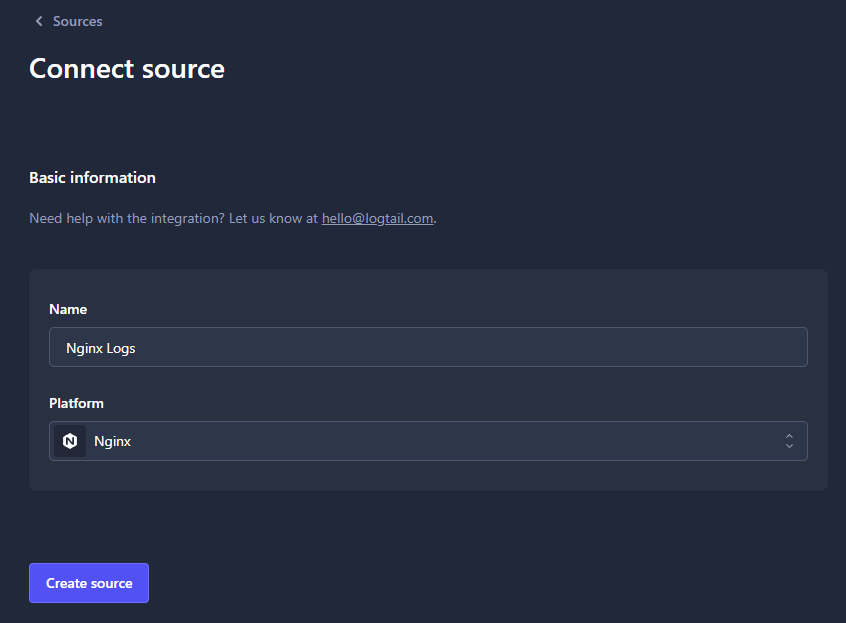
Go to sources and click on "Connect source" to provide a name and specify the platform to collect the logs. LogTail will create a data source with a source token that can connect to the source.
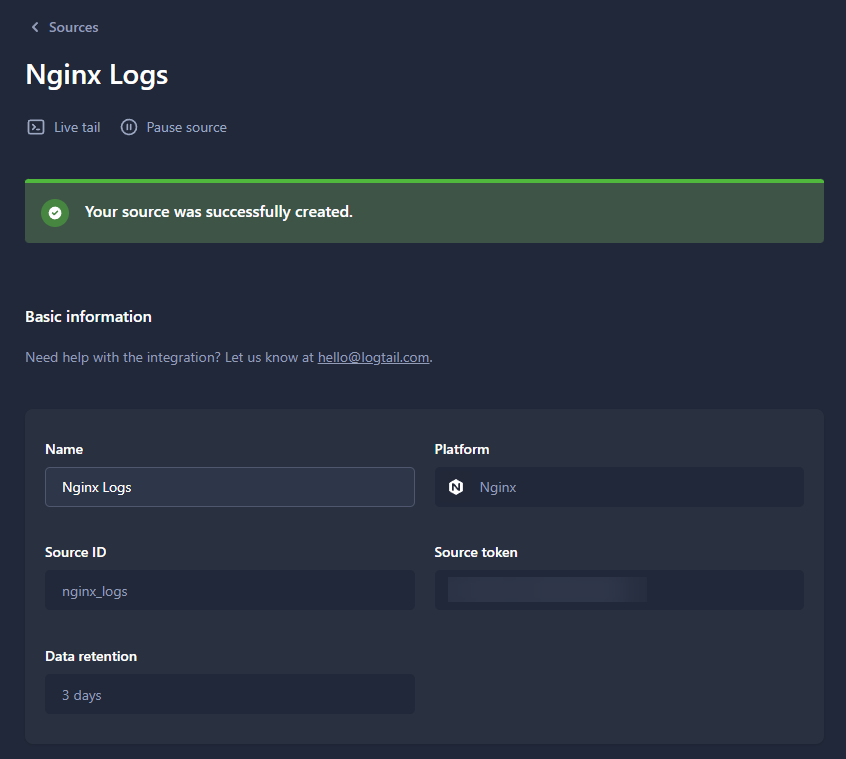
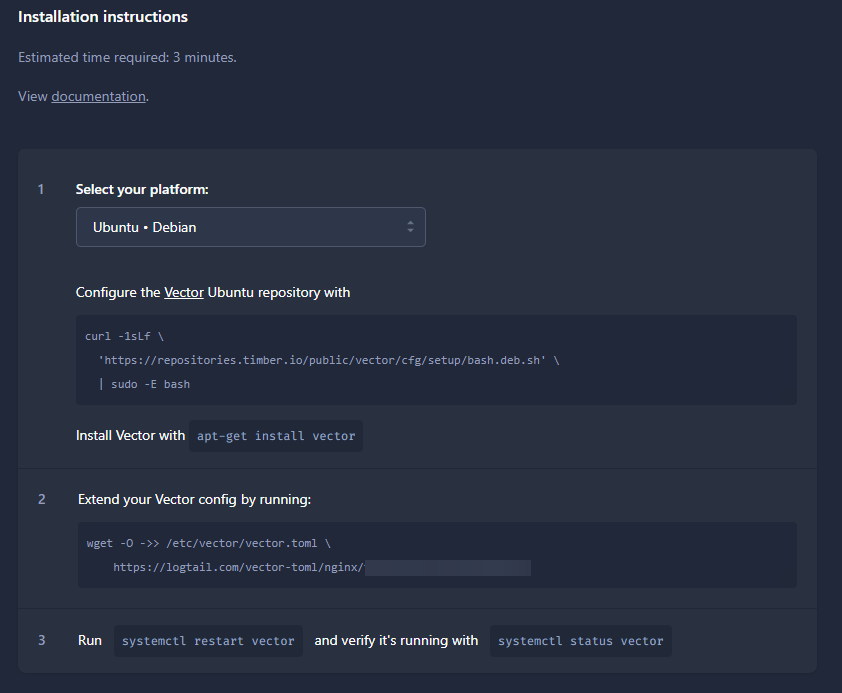
Next, install a preferred agent. The installation instructions for the recommended client vector are provided in the data source in the install instruction section. However, users are free to use any supported option.
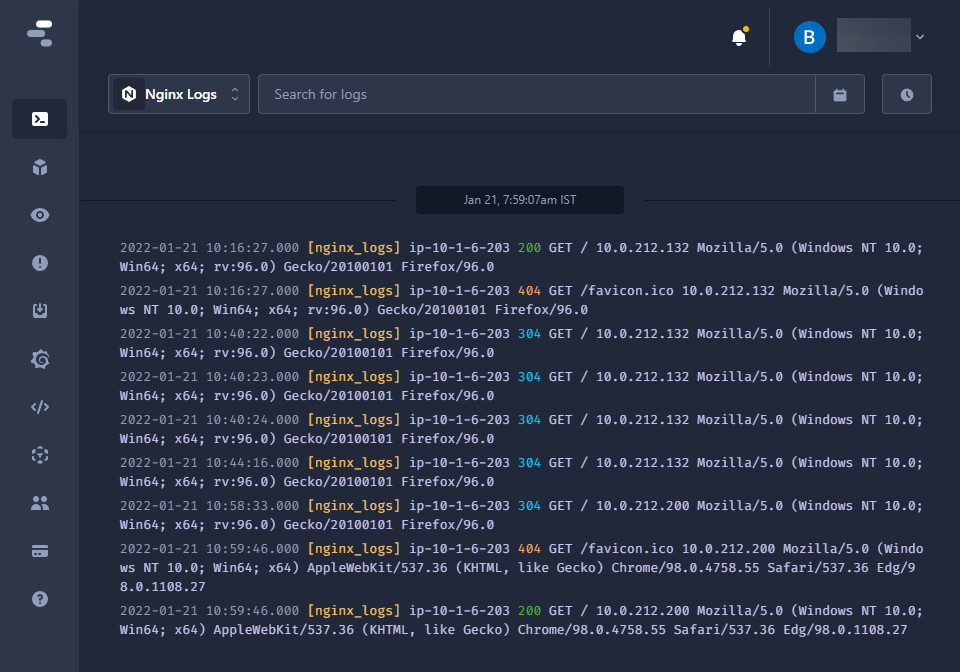
After setting up the agent configuration and restarting the service, you will be able to see the collected logs on the Live Tail section.
Querying Logs
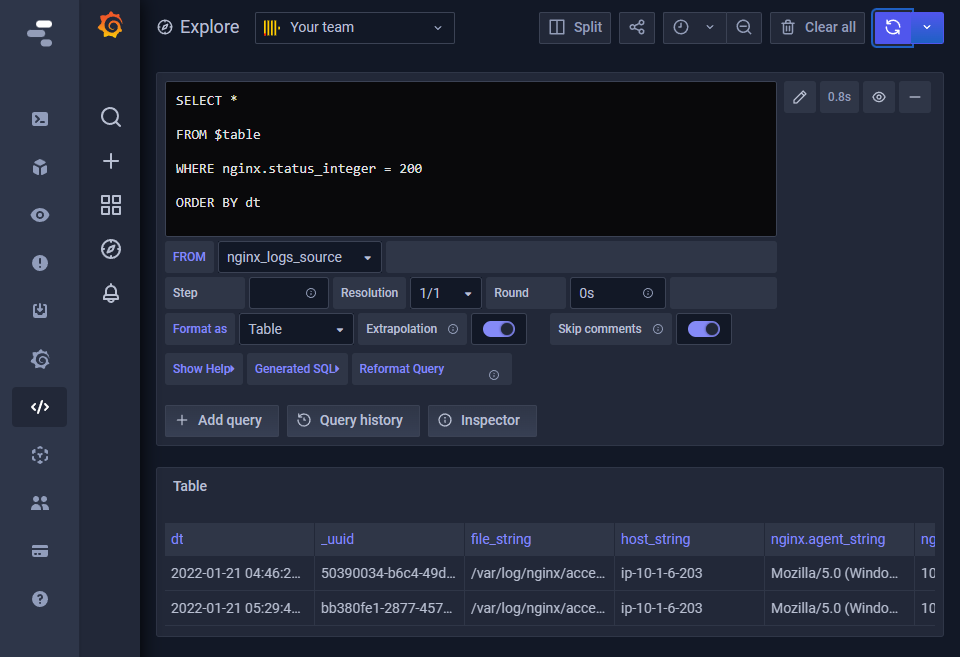
Navigate to the Explore within the SQL section. Here, users can query any collected logs using SQL syntax. In the following example, we are querying for successful responses ( nginx.status_integer = 200) from the Nginx server.
Promscale
Promscale is a connector for Prometheus, one of the leading open-source monitoring solutions. Promscale is developed by Timescale, a time series database with full compatibility to Postgres. Since logs are time series events, Timescale developed Promscale to ingest events from Prometheus and make them available in SQL. You can install Promscale in numerous ways.
How to Set Up Promscale
Before we get to the configuration of Prometheus to collect logs, here is how Promscale can be run using Docker. In this example, we are using a localhost timescale instance but we could also connect Promscale to Timescale Cloud. This is common if, for example, you are running a Kubernetes cluster with Prometheus installed inside it.
Run these commands, assuming you have already set up the Docker network. First, start a local Timescale instance.
docker run --name timescaledb -e POSTGRES_PASSWORD=getarctype -it \
    -p 5432:5432 --network promscale-timescaledb \
    timescaledev/promscale-extension:latest-ts2-pg13 \
    postgres -csynchronous_commit=off
Then start the Promscale connector.
docker run --name promscale -it -p 9201:9201 \
    --network promscale-timescaledb timescale/promscale:latest \
    -db-password=getarctype -db-port=5432 -db-name=postgres \
    -db-host=timescaledb -db-ssl-mode=allow
To connect this Promscale instance to Timescale cloud you could do the following.
docker run --rm --name promscale -it -p 9201:9201 \
    --network promscale-timescaledb timescale/promscale:latest \
    -db-user=tsdbadmin -db-password=<PASSWORD> \
    -db-port=31035 -db-name=tsdb \
    -db-host=<HOST>.tsdb.cloud.timescale.com \
    -db-ssl-mode=allow
How to Connect With Prometheus
Prometheus is managed by the Cloud Native Computing Foundation and has gained industry-wide adoption to collect and aggregate metrics. It has a large collection of client libraries for instrumenting application code to special-purpose exporters for services like HAProxy, Graphite, and more. Prometheus has its own robust query language called PromQL that can be used for querying logs and features like push gateway for short-lived jobs. On top of that, it provides an alert manager for altering based on the collected metrics.
While Prometheus can have a larger learning curve compared to other solutions, it offers the best customizability and integration options to collect any type of metrics or logs. Unlike the other two solutions, Prometheus can be self-hosted while still offering managed service options like Amazon Managed Service for Prometheus.
Prometheus primarily uses exporters and client libraries to collect data. Some software tools like Kubernetes and Traefik directly expose metrics to Prometheus, eliminating the need for an exporter.
Querying logs can be done with the help of PromQL via the Prometheus web UI, API clients, or external visualization tools like Grafana.
Ingesting and Querying Logs Using Prometheus
Ingesting Data
Assume you want to ingest logs from an Nginx installation. This can be achieved through an exporter like prometheus-nginxlog-exporter, which allows users to ingest Nginx logs to Prometheus. There are multiple ways to configure this exporter, from a direct docker install via DEB or RMP packages to running as a sidecar container in a Kubernetes environment, etc. In the following example, we have installed the prometheus-nginxlog-exporter as a DEB package and run the exporter with a custom configuration file.
listen:
  port: 4040
  address: "0.0.0.0"

consul:
  enable: false

namespaces:
  - name: nginxlogs
    format: "$remote_addr - $remote_user [$time_local] \"$request\" $status $body_bytes_sent \"$http_referer\" \"$http_>    source:
      files:
        - /var/log/nginx/access.log
    labels:
      service: "nginx"
      environment: "production"
      hostname: "nginx.example.com"
    histogram_buckets: [.005, .01, .025, .05, .1, .25, .5, 1, 2.5, 5, 10]
Note - You may need to modify the logging format of the Nginx server to match the expected format of the exporter.
og_format custom   '$remote_addr - $remote_user [$time_local] '
                      '"$request" $status $body_bytes_sent '
                      '"$http_referer" "$http_user_agent" "$http_x_forwarded_for"';
Then on the Prometheus end, we can modify the prometheus.yml to include a new job config pointing to the prometheus-nginxlog-exporter.
  - job_name: 'nginx'
    scrape_interval: 15s
    static_configs:
      - targets: ['18.184.64.170:4040']
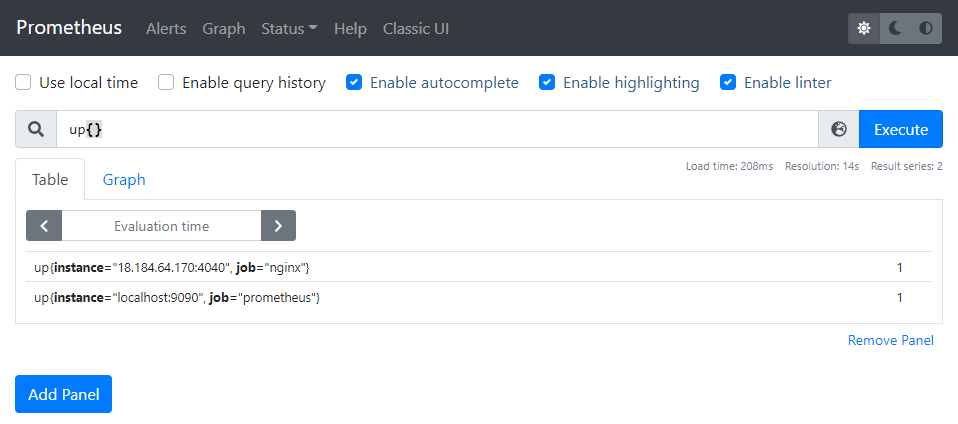
After restarting Prometheus, you will be able to see a new instance when you query using the up{} command pointing to the created service.
Querying Logs
When querying logs, you can use the Promscale configuration above with Timescale. You can also use the Prometheus web interface with PomQL commands to query the collected metrics. Let's assume we need to see the successful requests (HTTP 200) made to the server. It can be done using the following command.
nginxlogs_http_response_count_total{service="nginx",status="200"}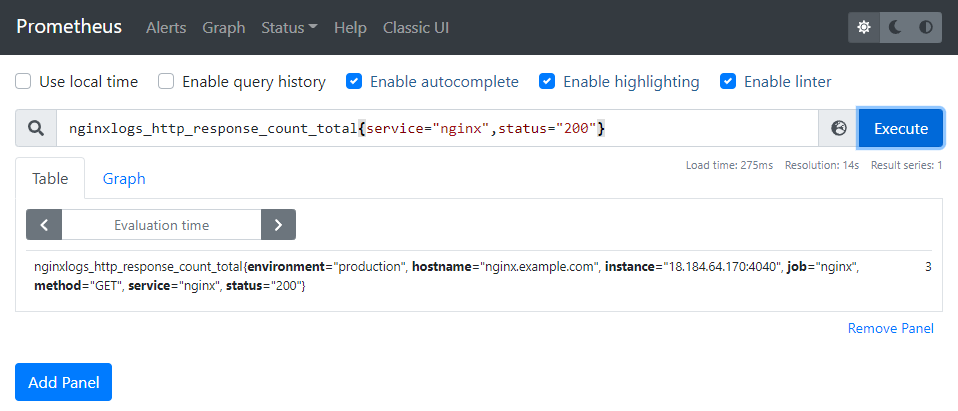
The Prometheus query language allows users to select and aggregate time-series data in real-time. This data can be shown as a graph view, in tabular format, or be exposed to external systems via the HTTP API. In the above example, we have specified the metric using the nginxlogs_http_response_count_total command, limiting query scope to the metrics coming from the nginxlogs namespace. Even though PromQL is a powerful language, users need to learn it before effectively utilizing it to query data from Prometheus. This makes SQL a better solution especially if you are already running Postgres and can use Timescale.
Logflare
Logflare, now a part of Supabase, aims to streamline the logging experience for Cloudflare-, Elixir-, and Vercel-based applications. However, it can be adapted to support any type of log. Logflare provides structured logging ability without limits or added latency. It aims to provide the best performance with minimal overhead when processing logs for supported application platforms.
Logflare allows near unlimited event history and is backed by Google BigQuery. Moreover, Logflare allows users to directly integrate with BigQuery and DataStudio for further analytics using SQL and visualizing tools. Additionally, LogFlare supports email and SMS alert functionality, log routing to different sources using Regex, and even provides the ability to add metadata to logs.
How to Use Logflare
As a managed service provider, Logflare requires users to create an account on their platform. Or if you have a Supabase account you can access the logs for your project at /settings/logs/database as shown in this Supabase YouTube video. It also provides a progressive web app that allows Android and iOS clients to access the Logflare Platform directly.
Cloudflare and Vercel Logflare offer a one-click installation facility to configure the logging agents for natively supported platforms. They also provide guides on integrating other supported platforms like Gigalixir, Heroku, Elixir, JavaScript (Pinto Transport), Github Actions/Webhooks, FluentBit, and General Webhooks.
Logs can be queried directly via the Logflare platform or through Google BigQuery. Logflare even allows users to configure their BigQuery backend to directly manage their storage and cost while only paying LogFlare for managing the log pipelines.
Ingesting and Querying Logs Using Logflare
Ingesting Data
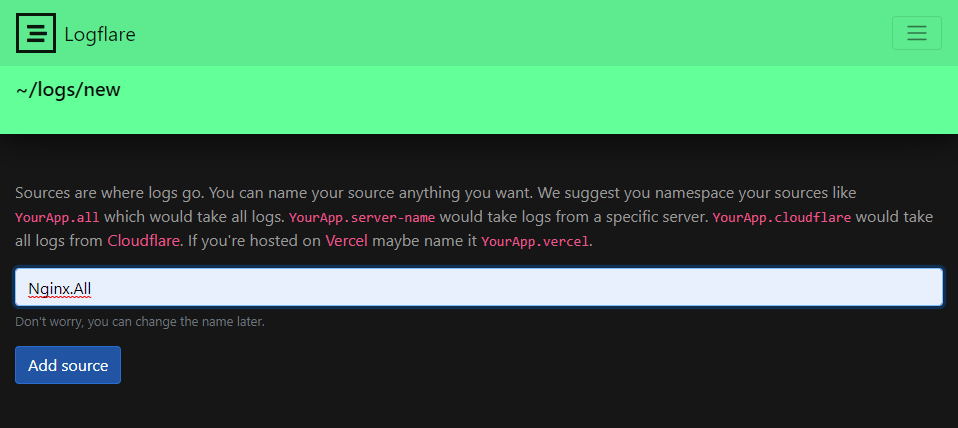
First, a user must create a Logflare account. Then they should create a new data source that will allow them to ingest data with the source key for the pipeline and provide the necessary API key to authenticate.
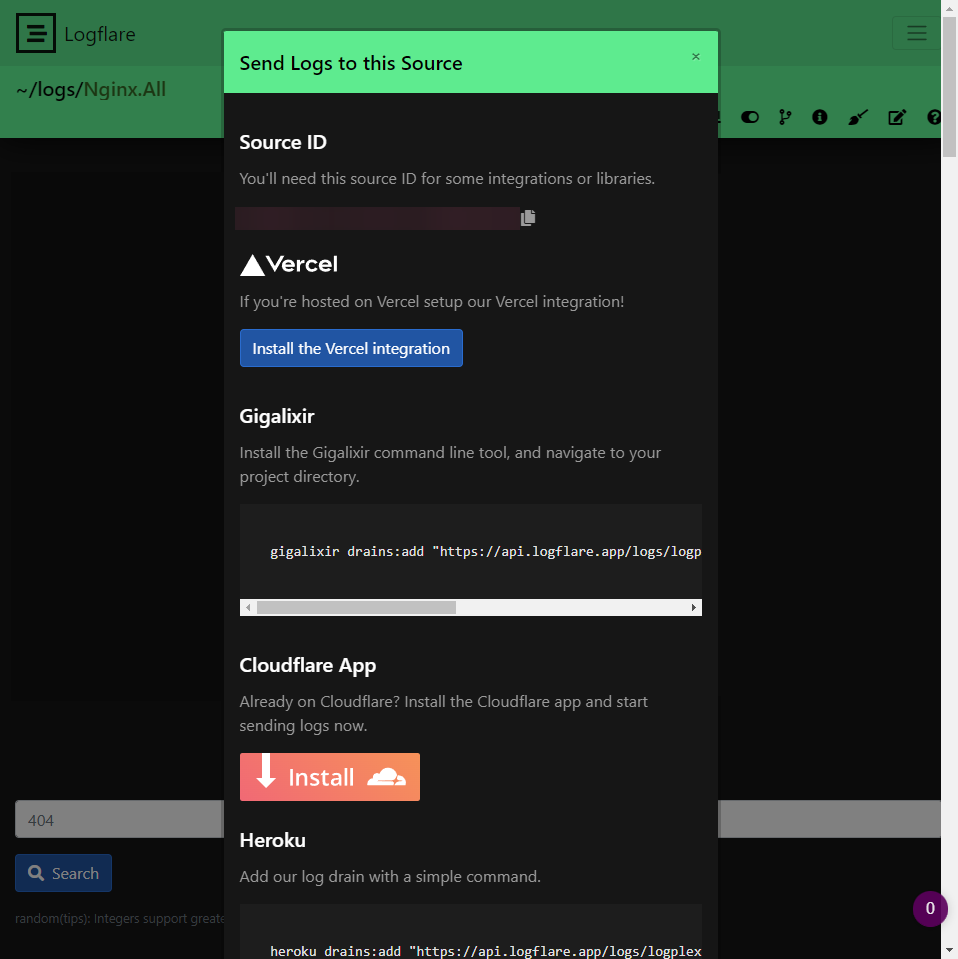
Next, we will be using Fluent Bit to ingest the Nginx data. We will use the Fluent Bit package td-agent-bit for ubuntu to achieve it and modify the configuration to reflect the input as Nginx logs while pointing the output to Logflare.
    [INPUT]
        Name        tail
        Path        /var/log/syslog

    [OUTPUT]
        Name             http
        Match            *
        tls              On
        Host             api.logflare.app
        Port             443
        URI              /logs/json?api_key=IVJaC85Mk79K&source=ffbda396-e1f2-4c0e-851a-4b99de24b398
        Format           json
        Retry_Limit      5
        json_date_format iso8601
        json_date_key    timestamp
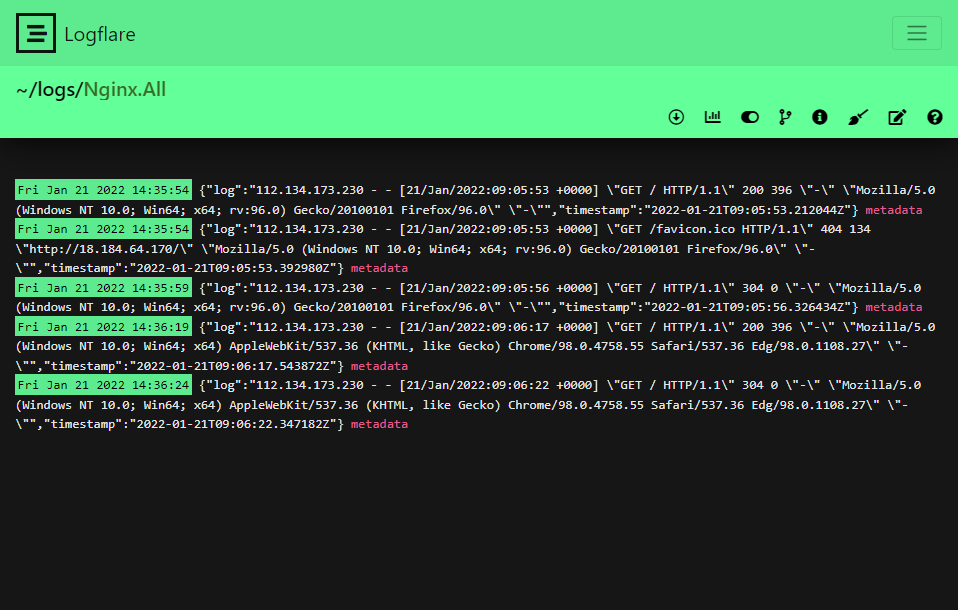
Restart td-agent-bit, and you will be able to see the Nginx access log each time a request is made to the server.
Querying Data
Logflare has its own query language called LQL. Let's look at how to query for HTTP 200 successful responses using the following command.
200 c:count(*) c:group_by(t::minute)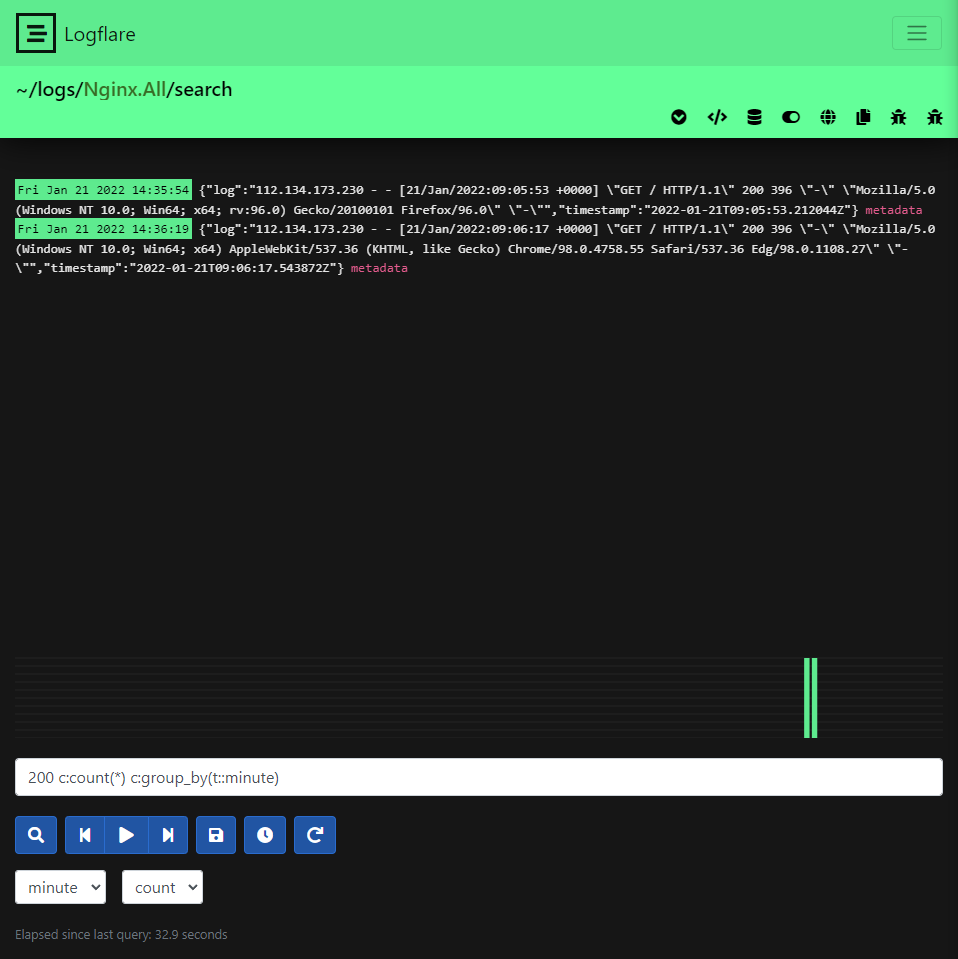
Another great feature of Logflare comes with its ability to provide a BigQuery Backend. For paid subscribers, it can either explore the data via Google Data Studio or use BigQuery to query the backend using SQL directly. You can also now search the logs using SQL inside Supabase.
Conclusion
All the above-discussed solutions for querying logs are capable of log management. LogTail can be considered the most straightforward option with its inbuilt SQL query and visualization functionality, followed by Logflare with its one-click install options for supported platforms and mobile support. Finally comes Prometheus, the most complex solution of the three. Although it is complicated, Prometheus offers a complete solution for all your monitoring needs, beyond just log management. Prometheus is made much easier to use with the addition of Promscale. Select the best tool out of these three for your log management needs depending on your requirements.
Published at DZone with permission of Shanika WIckramasinghe. See the original article here.
Opinions expressed by DZone contributors are their own.

Comments