

Comparing Top 3 Java Reporting Tools
Reporting and document generation are essential for applications in business. Here’s a compact, hands-on overview of three reputable tools for Java.
Join the DZone community and get the full member experience.
Join For FreeThere’s no shortage of reporting tools, but a good number of them are either part of heavyweight BI systems or cloud services. Many line‑of‑business applications, however, just want a discreet, built‑in reporting option that can be customized.
Having recently tested several Java‑based document generation tools and libraries, I thought a short, plain-spoken, and up-to-date review could be worth sharing.
Top 3 Side-by-Side
In the Java world, there are several battle-proven reporting tools with Jasper Reports as a clear frontrunner. Nevertheless, I also had a look at two less popular, yet very capable options. Here's a side-by-side view of their fit for common reporting requirements:
| Tool | Data Sources | integration options | output formats | report designer |
|---|---|---|---|---|
| Jasper Reports |
JDBC, JNDI, JavaBeans, Collections, XML, JSON, CSV, Big Data, NoSQL, APIs |
Java or other platforms via REST API / Report Server embeddable via iframe |
PDF, HTML, DOCX, XLSX, PPTX, ODT, ODS, CSV, XML, JSON, RTF, TXT |
Desktop designer / Web designer |
| Eclipse BIRT |
JDBC, XML, Excel, Flat Files, MongoDB, Hive, POJO, Web Services |
Java or other platforms via REST API |
PDF, HTML, DOCX, XLSX, PPTX, ODT, ODS, PostScript |
Visual designer on top of Eclipse IDE |
| Jmix Reports |
JDBC, custom data sources |
Java or other platforms via REST API |
PDF, HTML, DOCX, XLSX, HTML, ODT, CSV, TXT |
Templating strategy: target format templates or Java class templates |
While the tools are largely comparable, the designer aspect differs noticeably and can have a practical impact. I'll demonstrate using each with a quick demo. Then we’ll also have a glance at how each product integrates with enterprise applications and the broader reporting pipeline.
1. Jasper Reports
Jasper Reports is a powerful and adaptable reporting solution. To cater to businesses of all sizes, the product is split into two tiers:
| edition | components | target audience |
|---|---|---|
| Community Edition |
|
Small-to-mid teams, open-source projects |
| Commercial Edition |
|
Large enterprises, SaaS providers |
The Community Edition already has everything to build a complete end‑to‑end workflow — from visual design to programmatic execution.
Installing Jaspersoft Studio
Jaspersoft Studio is a desktop designer available for Windows, Mac, and Linux. It is essentially a one-click install that you can get from the official download page.
Designing a Report With Jaspersoft Studio
A new report can be created using a template or from an empty page. Once the creation wizard completes, the new report appears in the workspace.
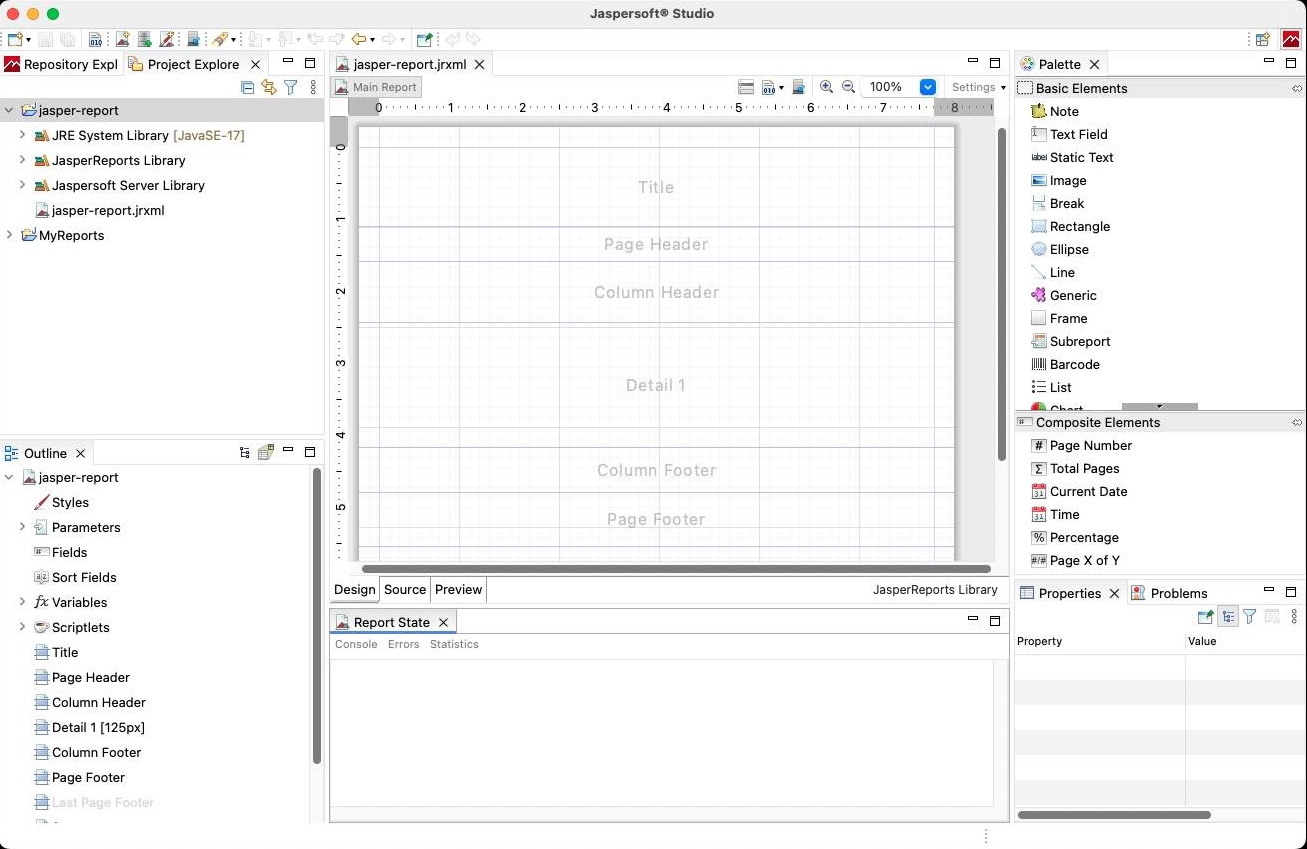
A report is divided into bands, each telling the engine where to place elements in the final document. The Title band renders once, while the Detail band repeats for every row of data.
Data Sources
Before adding anything to bands, use Repository Explorer to create a data adapter. There are plenty of options to choose from. In my case, that's a locally running PostgreSQL instance that I'll configure with Database JDBC Connection.
Throughout this article, I'm going to use the "world" schema, a sample three-table database that ships with various SQL systems and is commonly used for learning and testing.
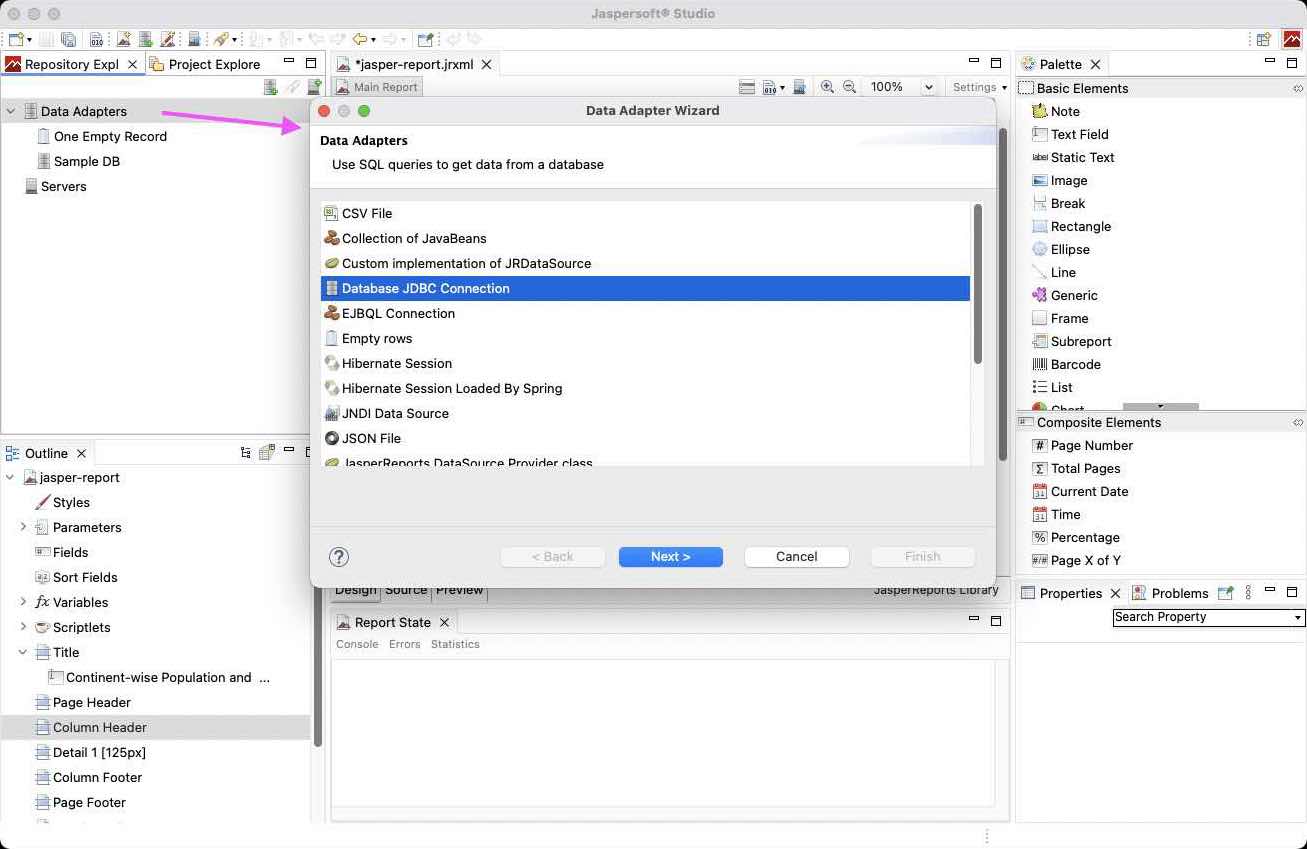
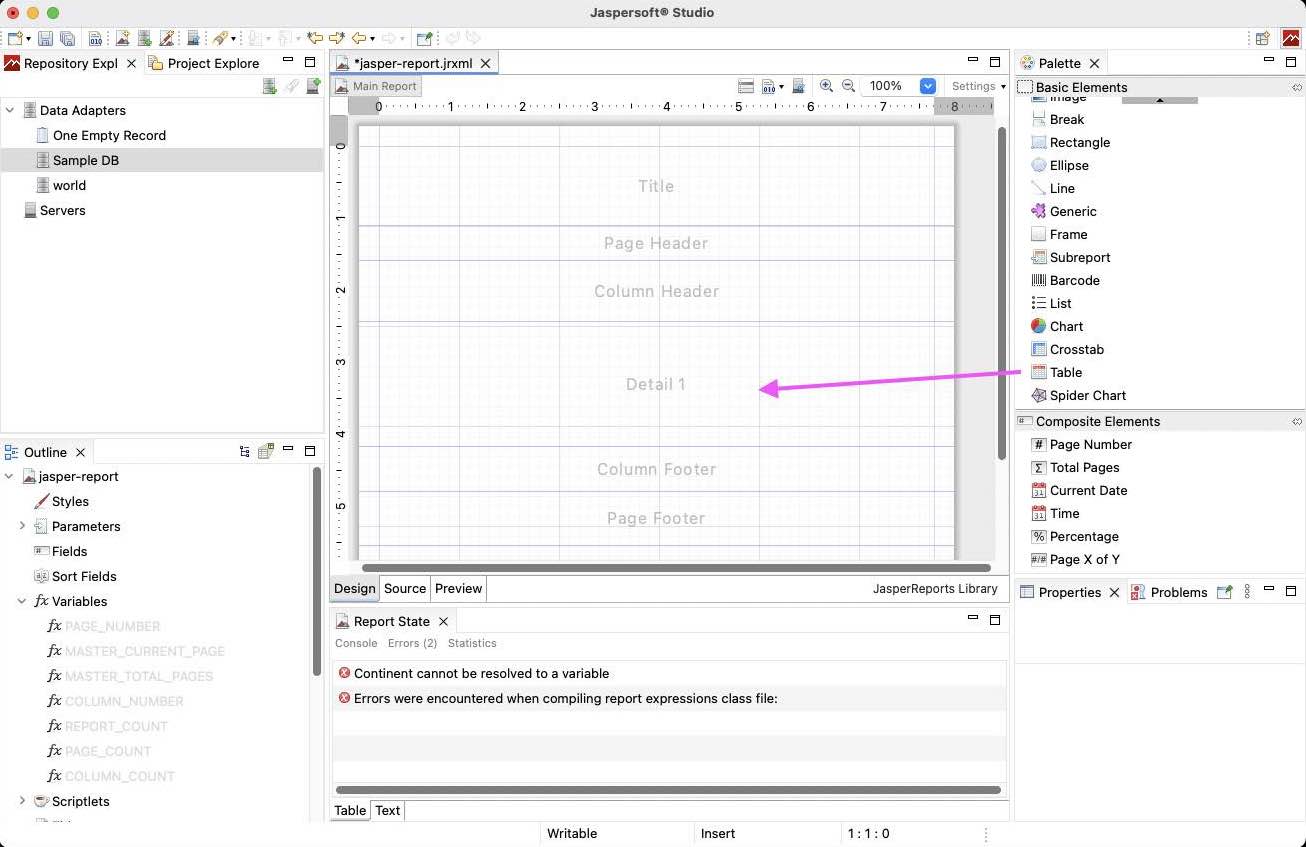
Now that the data is connected, the canvas can be populated with content. Begin by dragging the table element onto the details band.
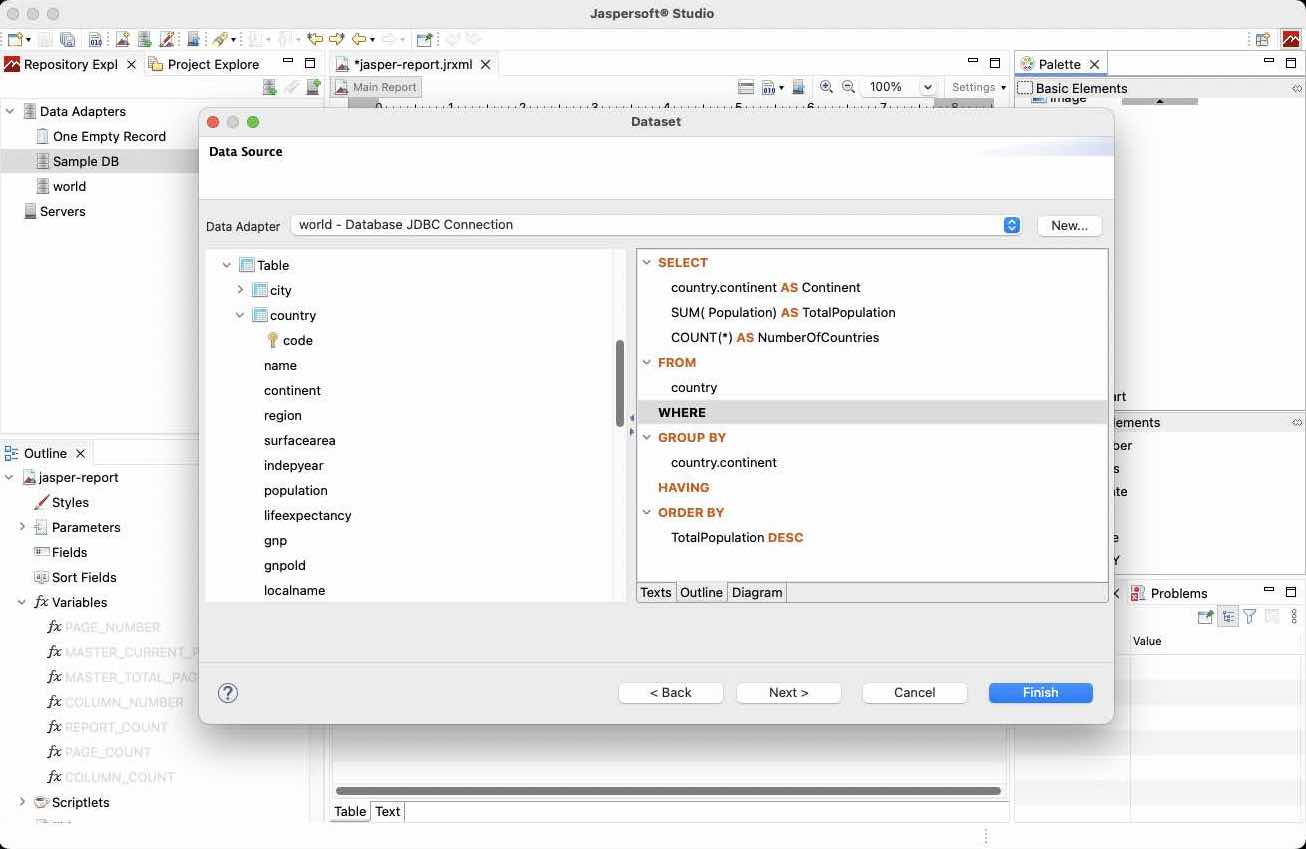
The table wizard prompts a query to retrieve the appropriate data. This can be done using a direct SQL query or by constructing it visually by selecting tables and columns from the tree on the left.
You'll see the table with parameters added to the canvas – they will appear as $F{parameter} placeholders. The side panel offers additional text and visual elements to enrich the report. A variety of charts are available for configuration through their own wizards.
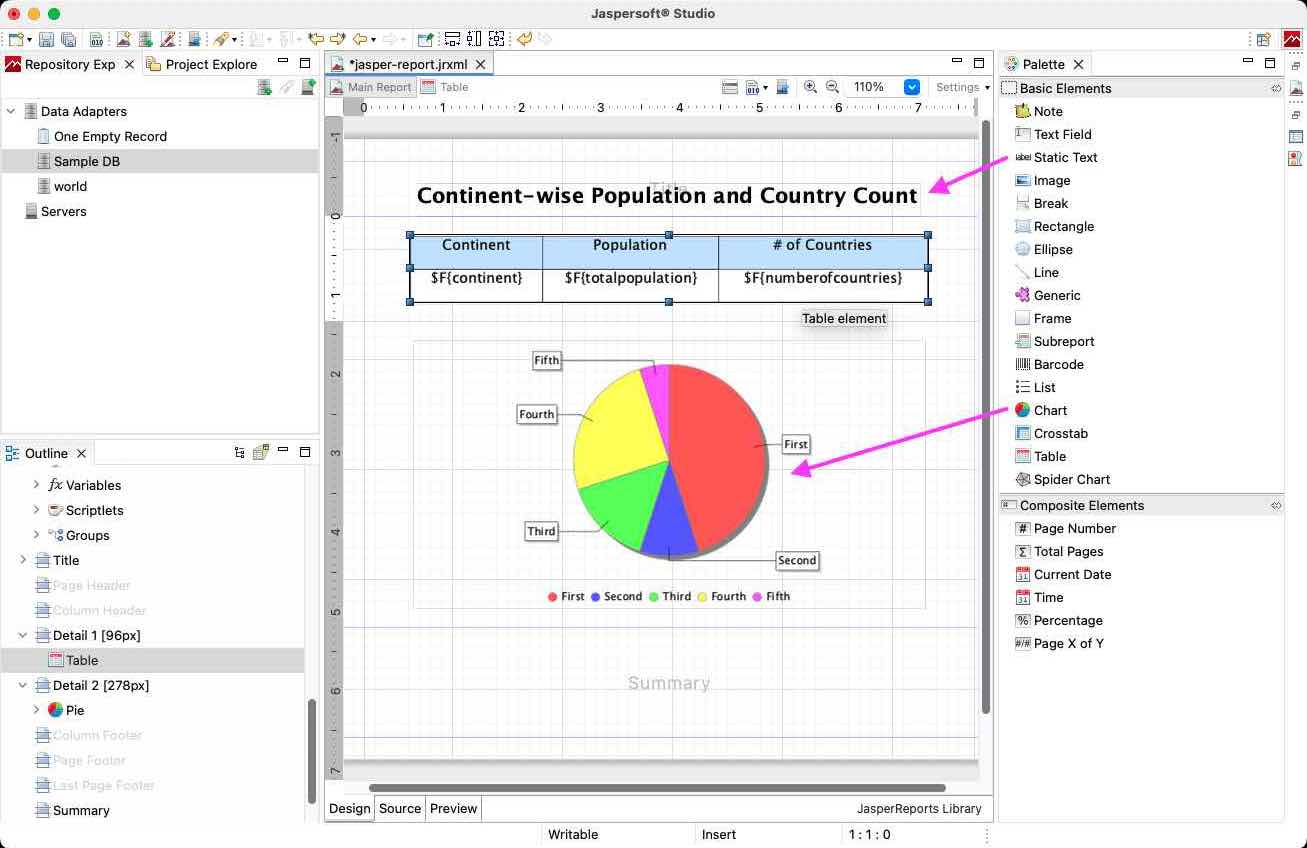
All the design choices are represented in a .jrxml file that JasperReports' engine can read at runtime. Switch to the Source tab to see that. Or, switch to the Preview tab to see the report rendered.
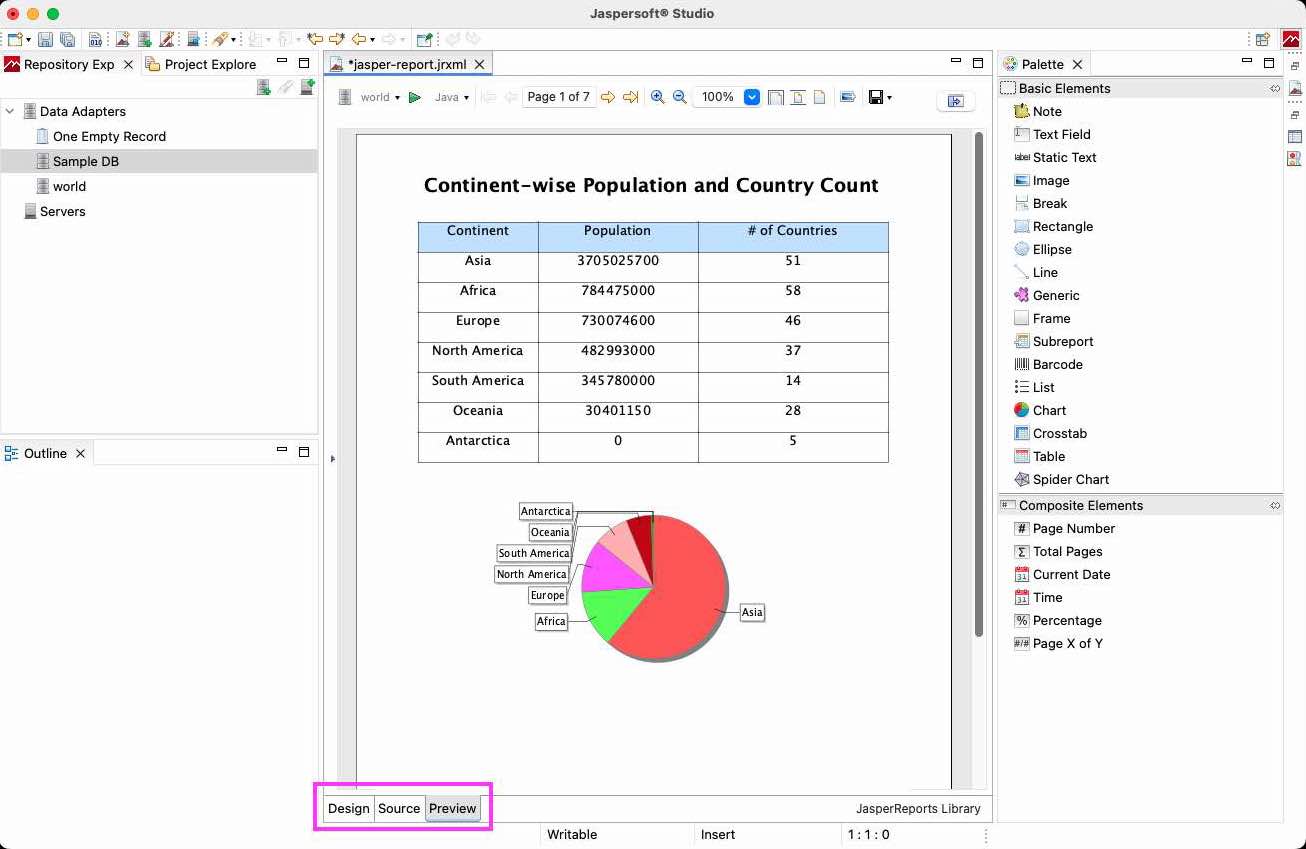
If you like what you see, export to the desired human-readable format, or compile to a .jasper file for programmatic generation using the JasperReport Java Library.
Integrating into the Application
Community license assumes using the JasperReports Java Library to integrate reports into your application. This is what the process can look like:
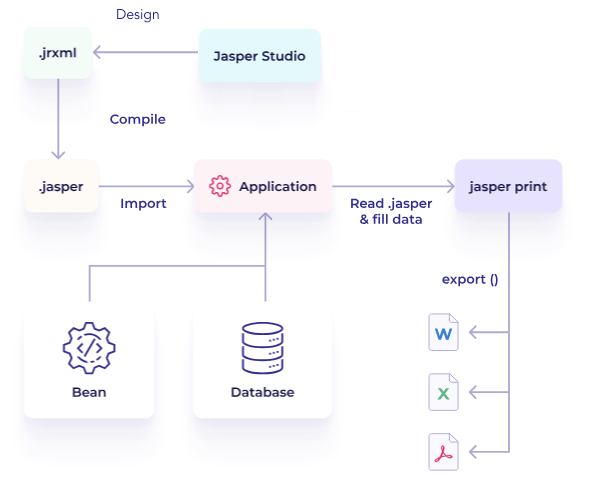
Nonetheless, you are not limited to just importing .jasper files and programmatically filling them with data. The library's breadth lets you handle everything from data source connection to report generation. Numerous samples are available to assist in building a custom reporting pipeline.
Or, if you hold a commercial license, reports can be integrated virtually anywhere in three additional ways:
- JasperReports Server – a complete reporting portal featuring ad-hoc self-service reports and a web report designer (with a feature set comparable to the desktop designer) that can be embedded via iframe.
- REST API – to enable your application call the server and let it handle the rest.
- Visualize.js – JavaScript library for seamless frontend embeddings.
2. Eclipse BIRT
The BIRT (Business Intelligence and Reporting Tools) Project is an open-source Eclipse-based reporting system that integrates with your Java application to produce professional reports. There are two main components in BIRT:
- BIRT Report Designer based on Eclipse IDE.
- A runtime component that you can add to your application server.
Installing BIRT Report Designer
You can choose one of these paths to start using BIRT:
- Eclipse users can add the BIRT Report Designer plug-in to their IDE. The plug-in adds the report editor right into the current workspace.
- Standalone approach – download the all-in-one Report Designer package. After extracting the archive, users get a portable Eclipse bundled with BIRT, ready to run with no extra setup.
Designing a Report With BIRT
Since Eclipse is a multi-purpose IDE, it is necessary to specify that the new project is a report project.
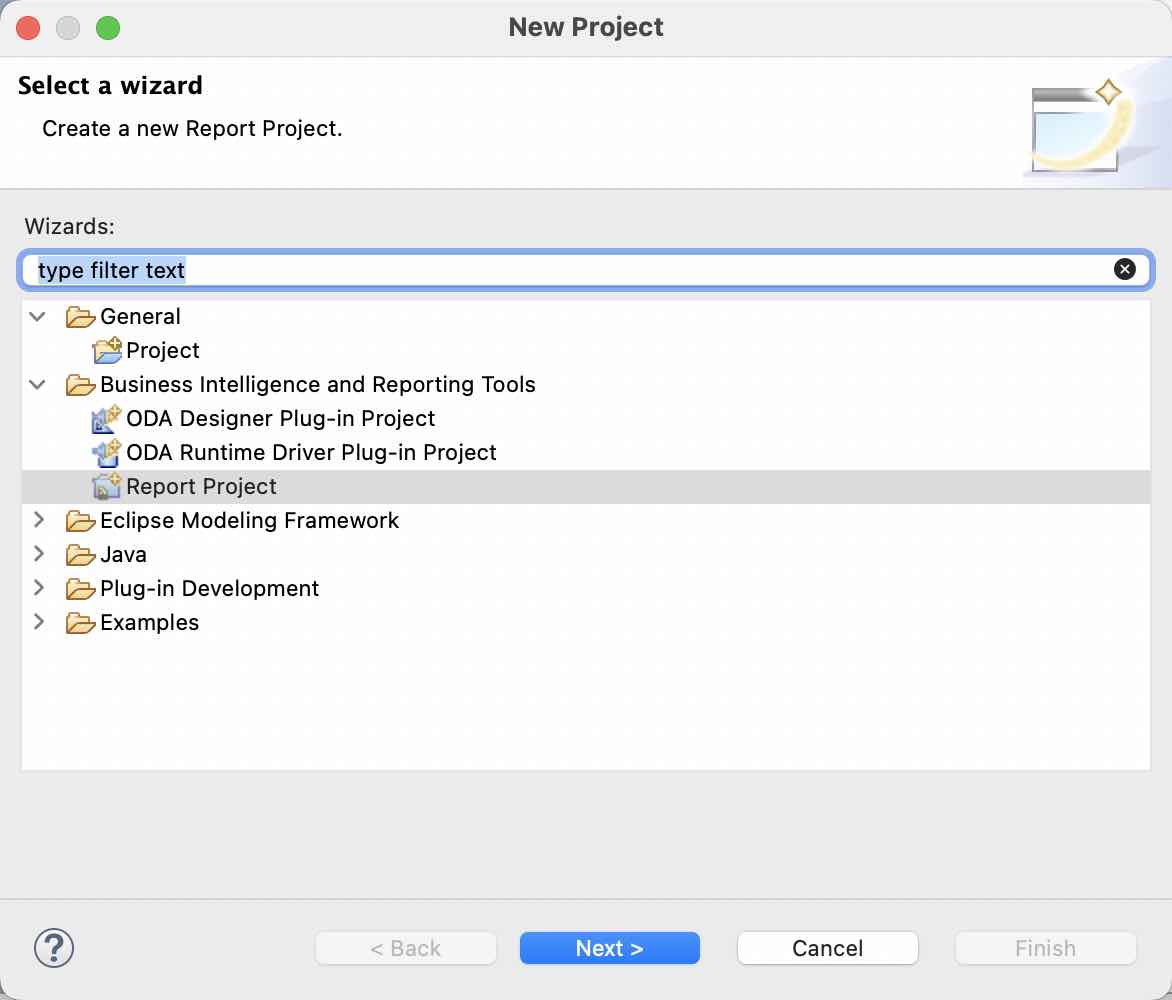
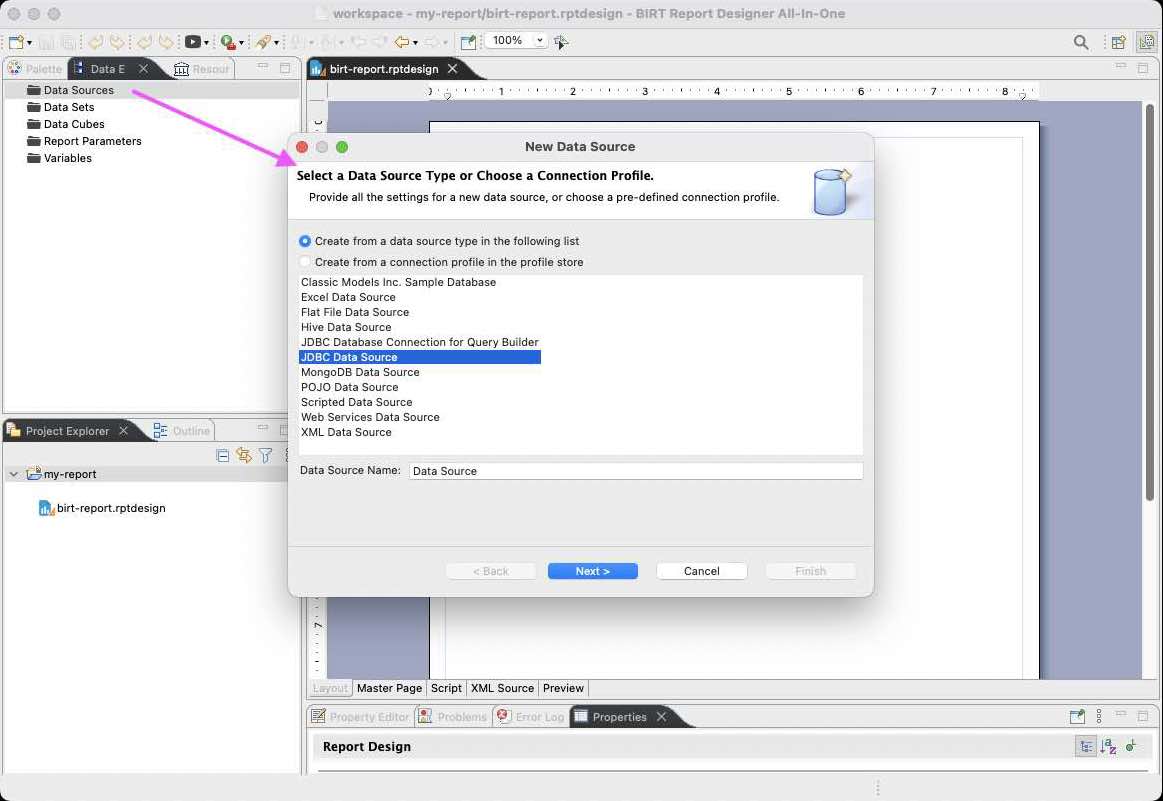
This gives you a clean workspace ready for your first report. Let's start by adding a data source. The same "world" database I used with Jasper can be set up througha JDBC Data Source.
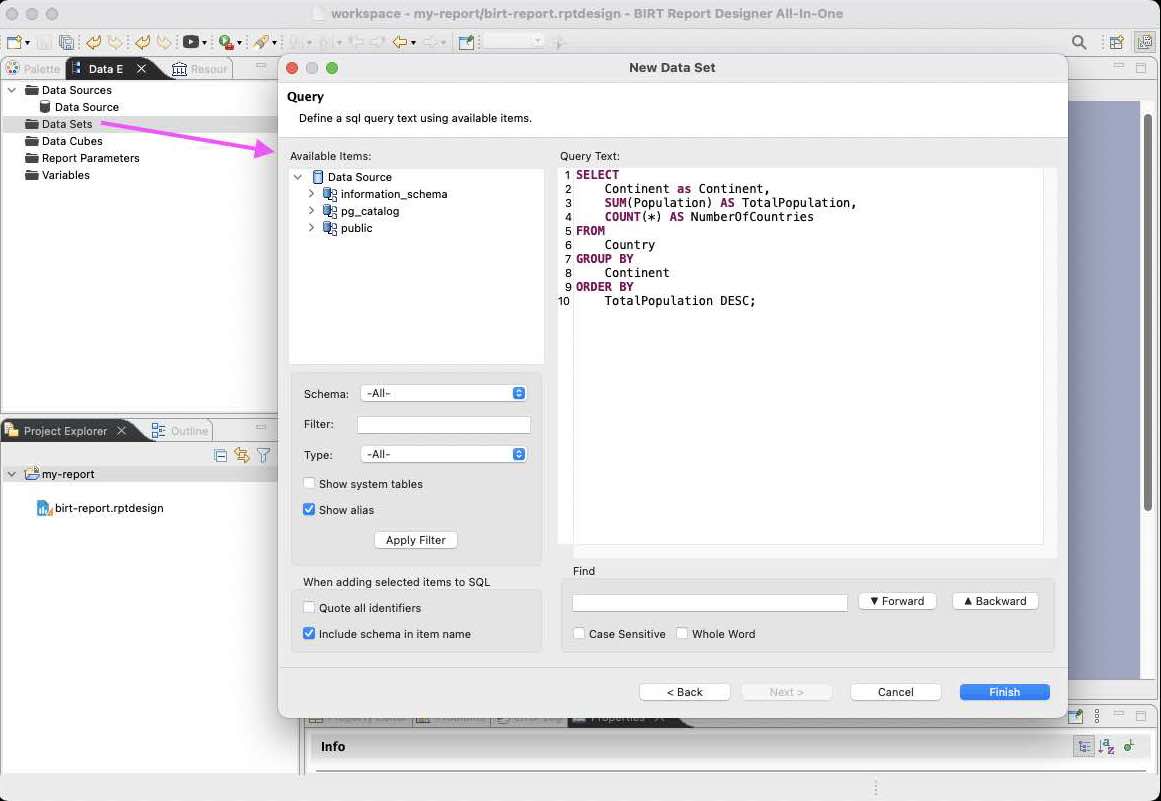
I'm also using the same query to declare a data set, so we should see matching reports.
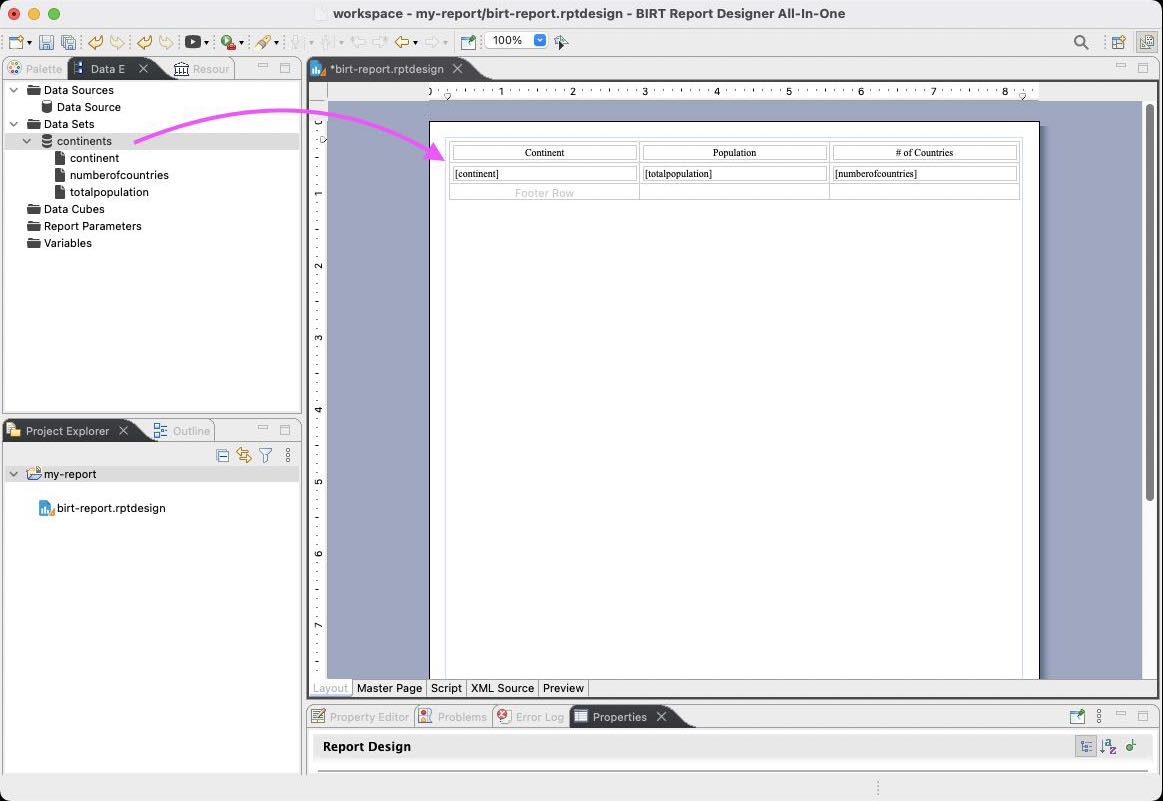
To get a minimal report with a table, just drag and drop that data set onto the canvas.
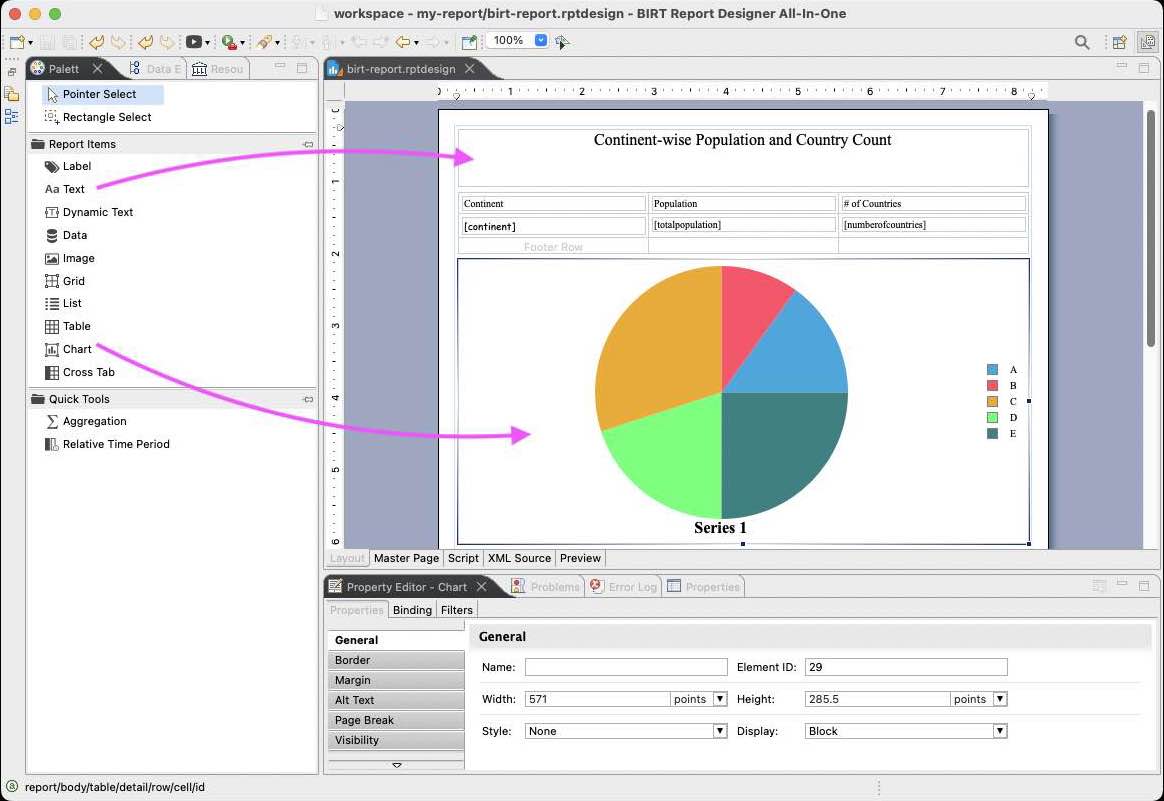
Similar to Jasper, let's add a title and a pie chart.
After the layout is finalized, switch between the editor tabs to inspect the XML source code or preview the report.
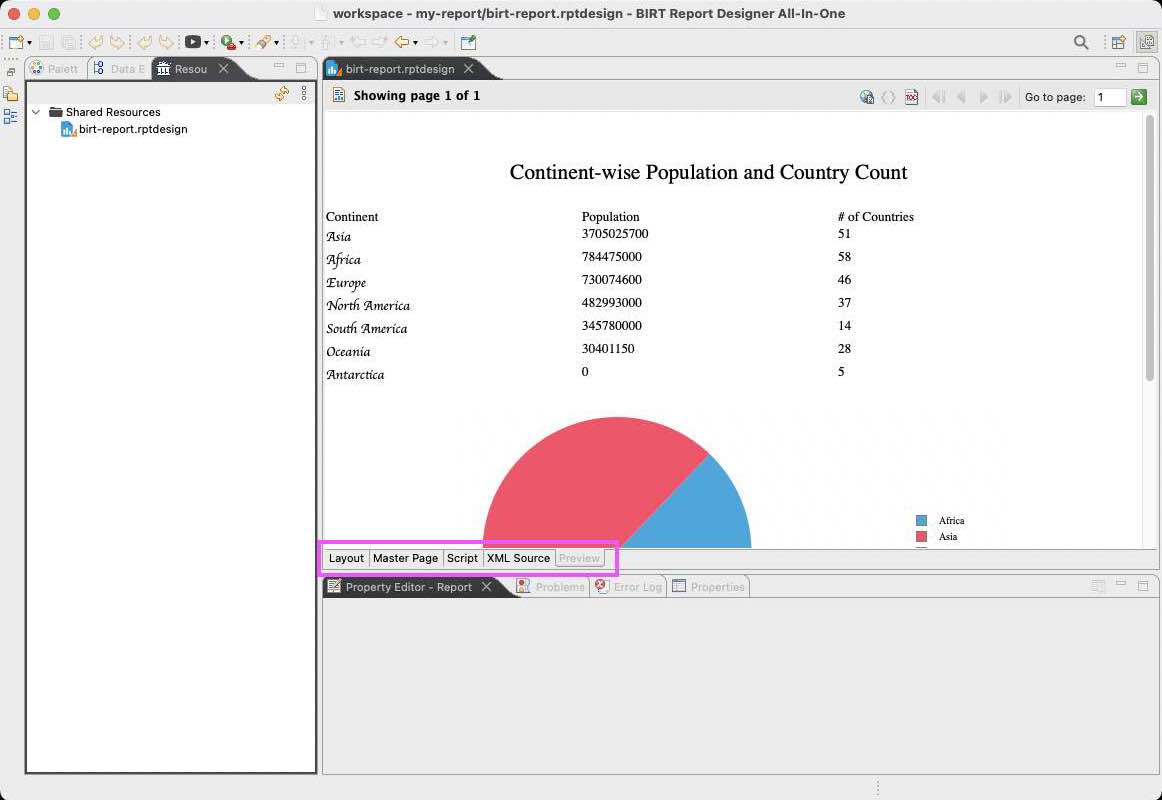
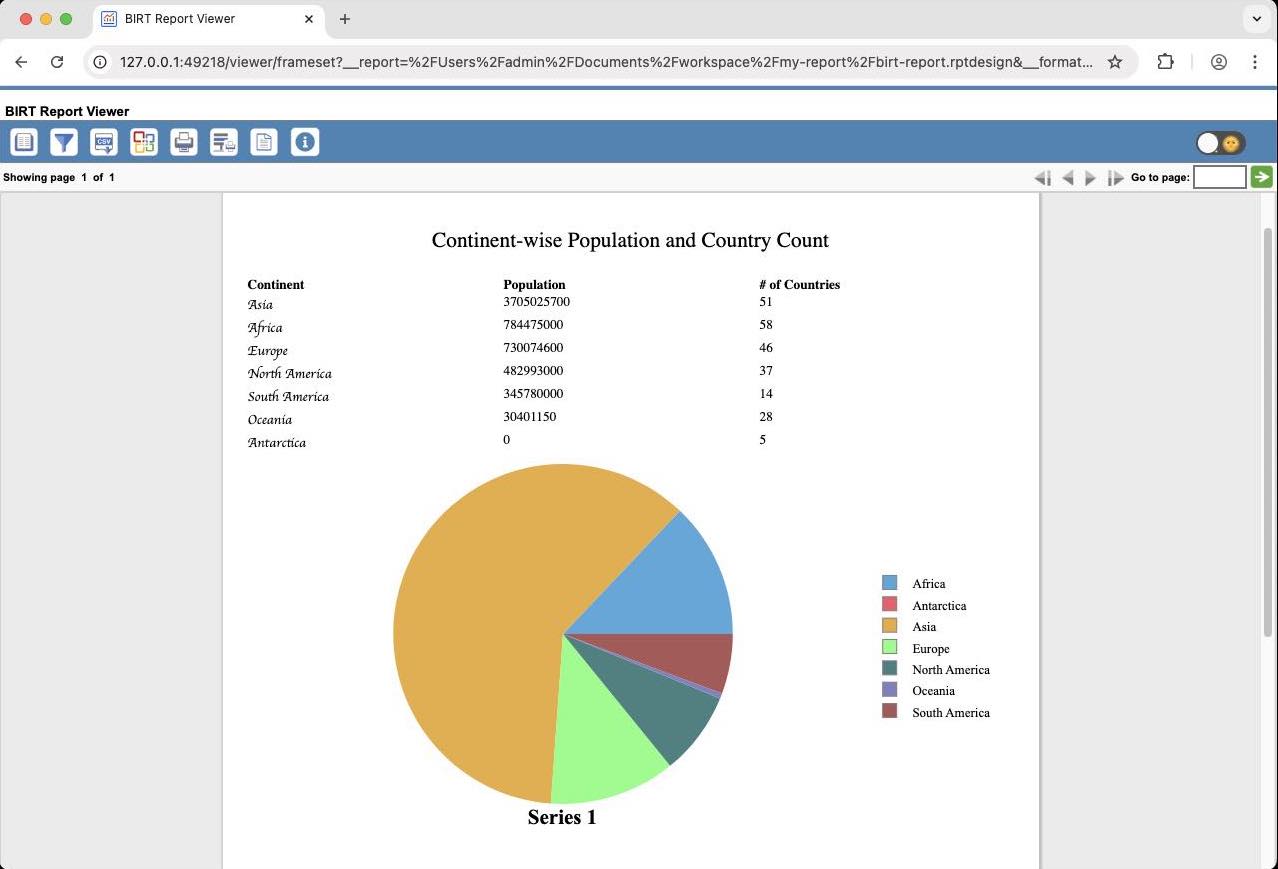
Then, if you want to open the report in your browser, click the "Play" button at the top bar. The report will then run in the BIRT Report Viewer.
From there, you can export to a variety of formats, such as DOCX, Open Document, and PDF.
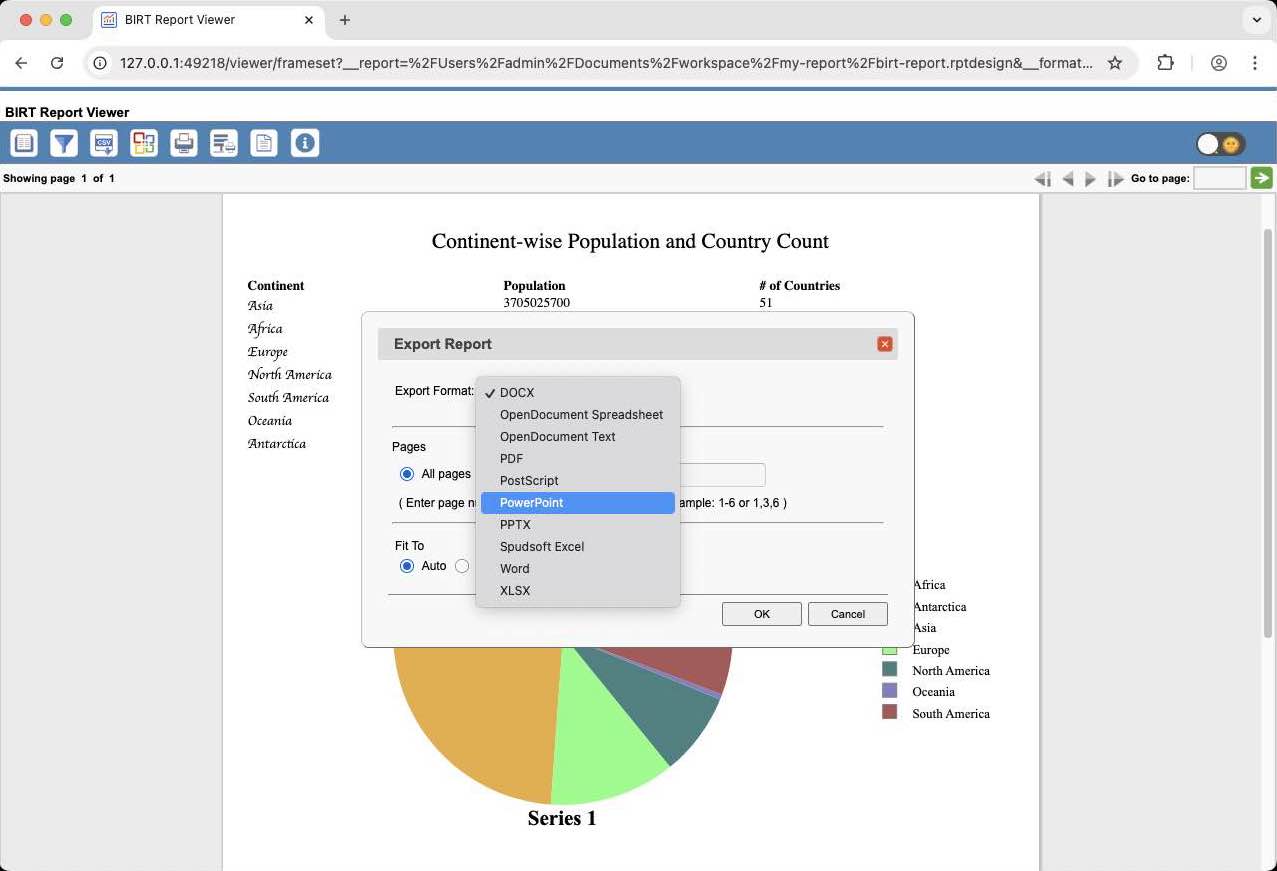
I tried several formats, with each producing sharp, publication-ready results.
Integrating into the Application
As it was shown, reports can run locally in the BIRT Report Viewer. This viewer itself is an AJAX-based Java application that can be of help if you set out to build your own reporting portal. See the GitHub repo.
The BIRT reporting engine is also deployable as a component of any Java stack, including Spring Boot applications. For a walkthrough of BIRT and Spring dependency management, see Baeldung's article. Additionally, BIRT can be installed on standard application servers like Tomcat and JBoss. A full list of options and instructions is available in the official documentation.
3. Jmix Reports
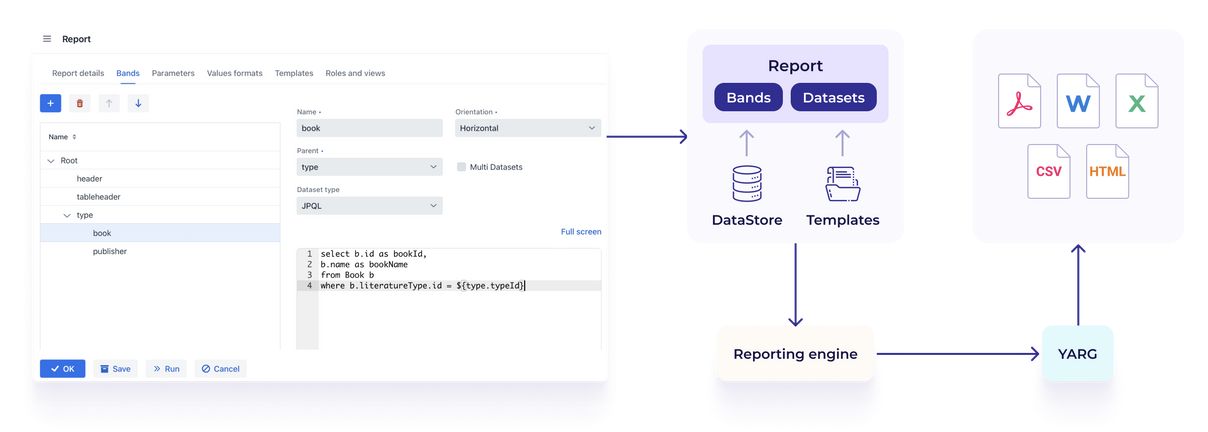
Jmix combines rapid application development with extensive reporting capabilities that it gets from a versatile reporting library known as YARG (see Yet Another Report Generator? on DZone to learn its story). Over the years, YARG was folded into the Jmix ecosystem as part of the Reports add-on, resulting in three easy-to-use components:
- Jmix Framework – an open-source foundation for building web applications with Java.
- Jmix Studio – an IntelliJ IDEA plugin that scaffolds an app and automates the creation of UI and business logic.
- Jmix Reports add-on – a plug-and-play module that adds admin UI for designing and managing reports directly within your application.
When combined, these components create a full-stack web application that includes the report designer. The application can be expanded to include a user-facing portal for viewing and downloading reports.
Installing Jmix With the Reports Add-On
The installation steps will be most familiar to Java developers using IntelliJ IDEA:
- Install the Jmix Studio plugin into your IntelliJ IDEA (the plugin and the framework are installed simultaneously. Follow the instructions for guidance.)
- Create a new Jmix project.
- Install the Reports add-on from the Jmix marketplace.
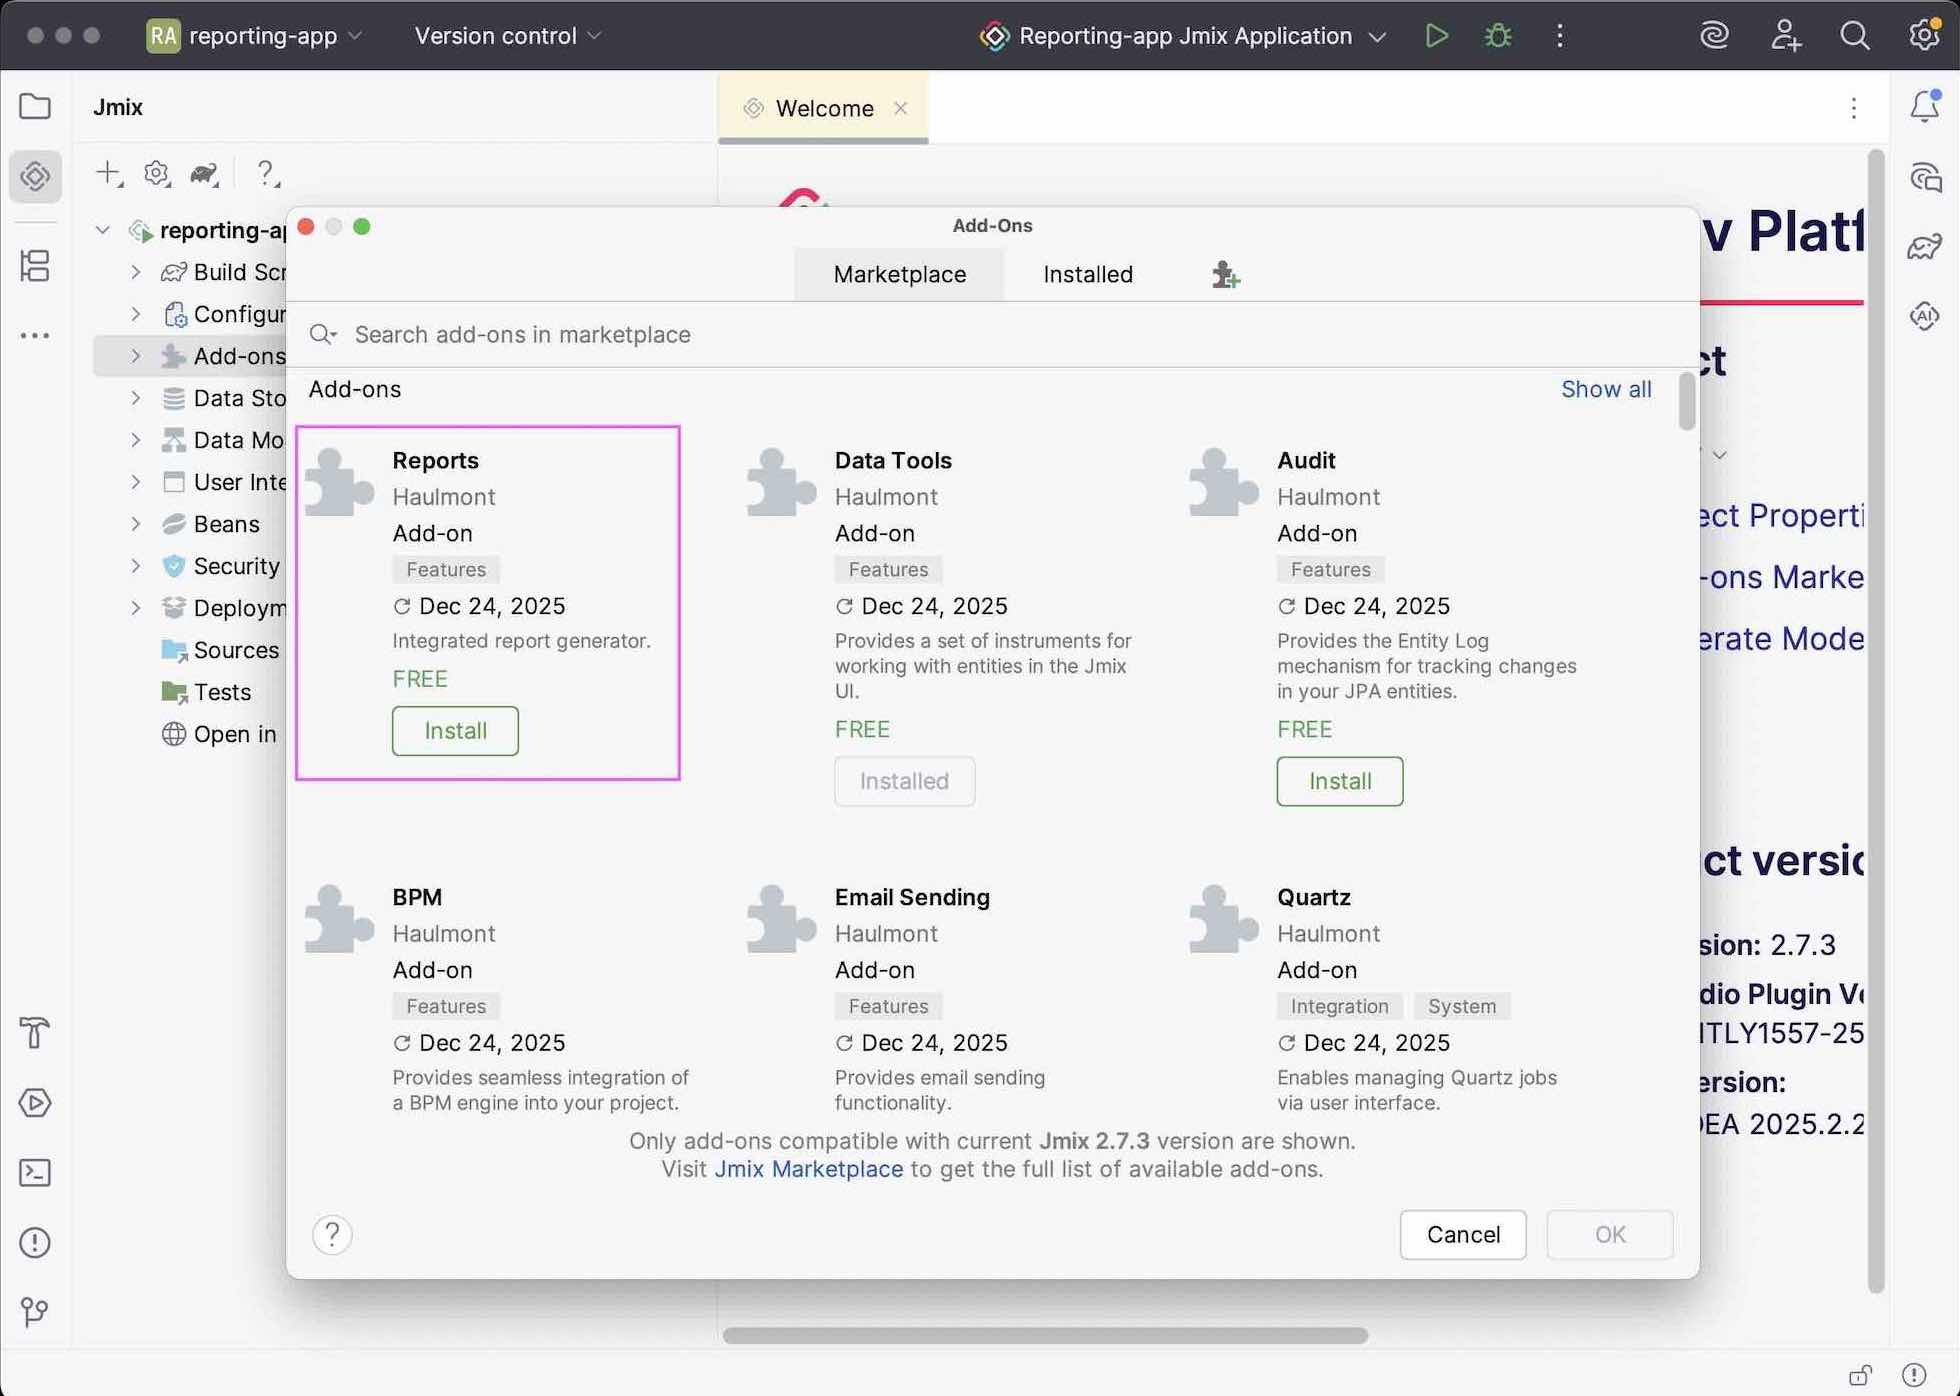
Data Source
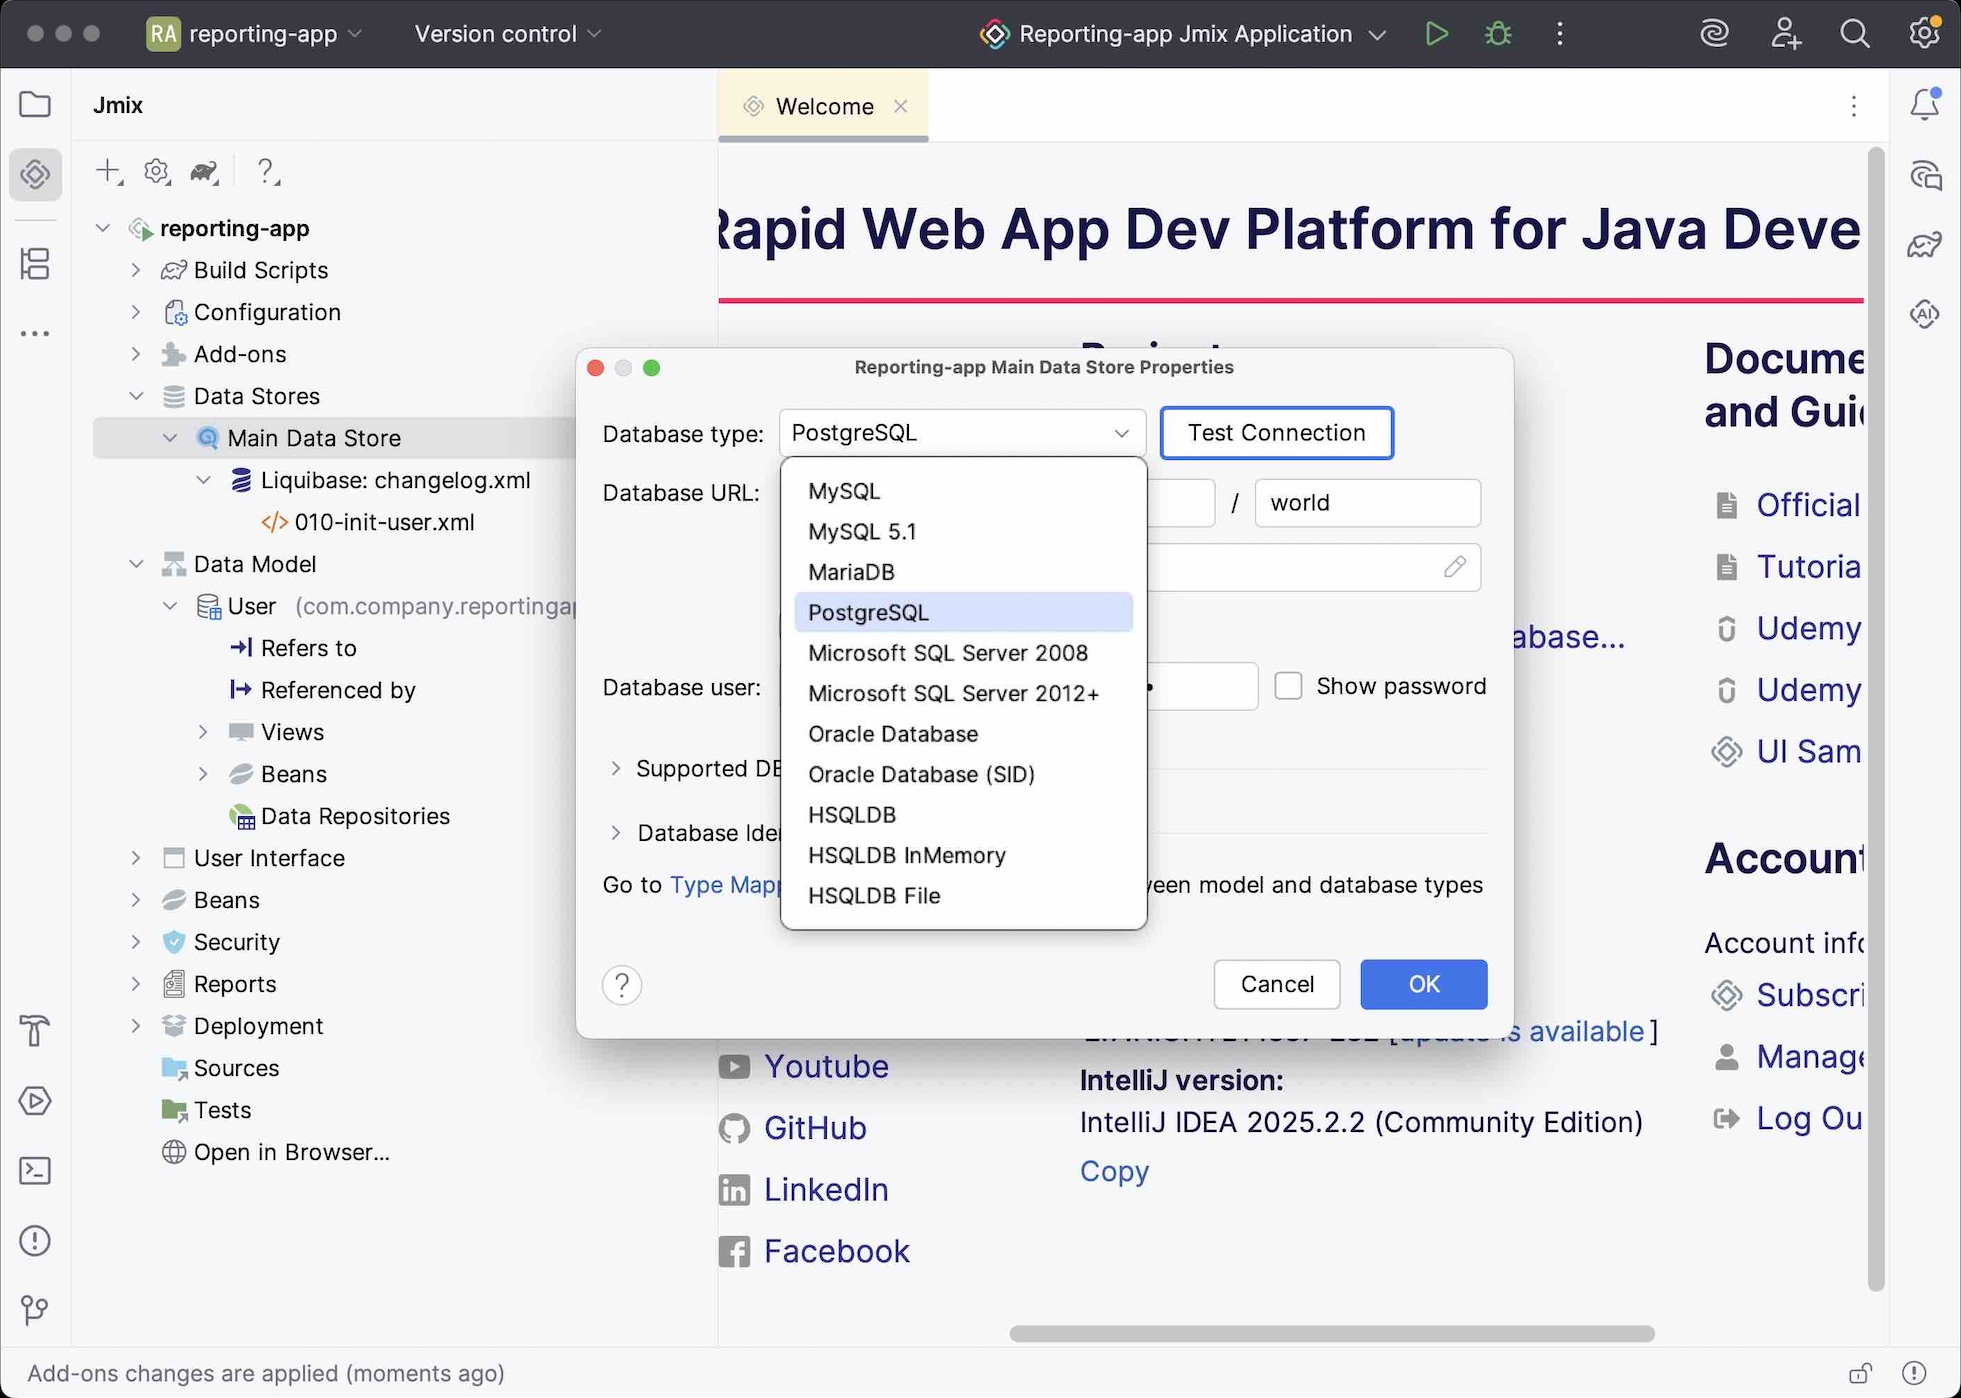
Out of the box, the Jmix application can connect to popular relational databases, including MySQL, Oracle, MariaDB, and PostgreSQL. By default, an in-file HSQLDB is used. To switch to another, right-click the Main Data Store -> Manage Data Store and enter the database URL and credentials. Once again, I'm using the local PostgreSQL instance with the sample "world" schema.
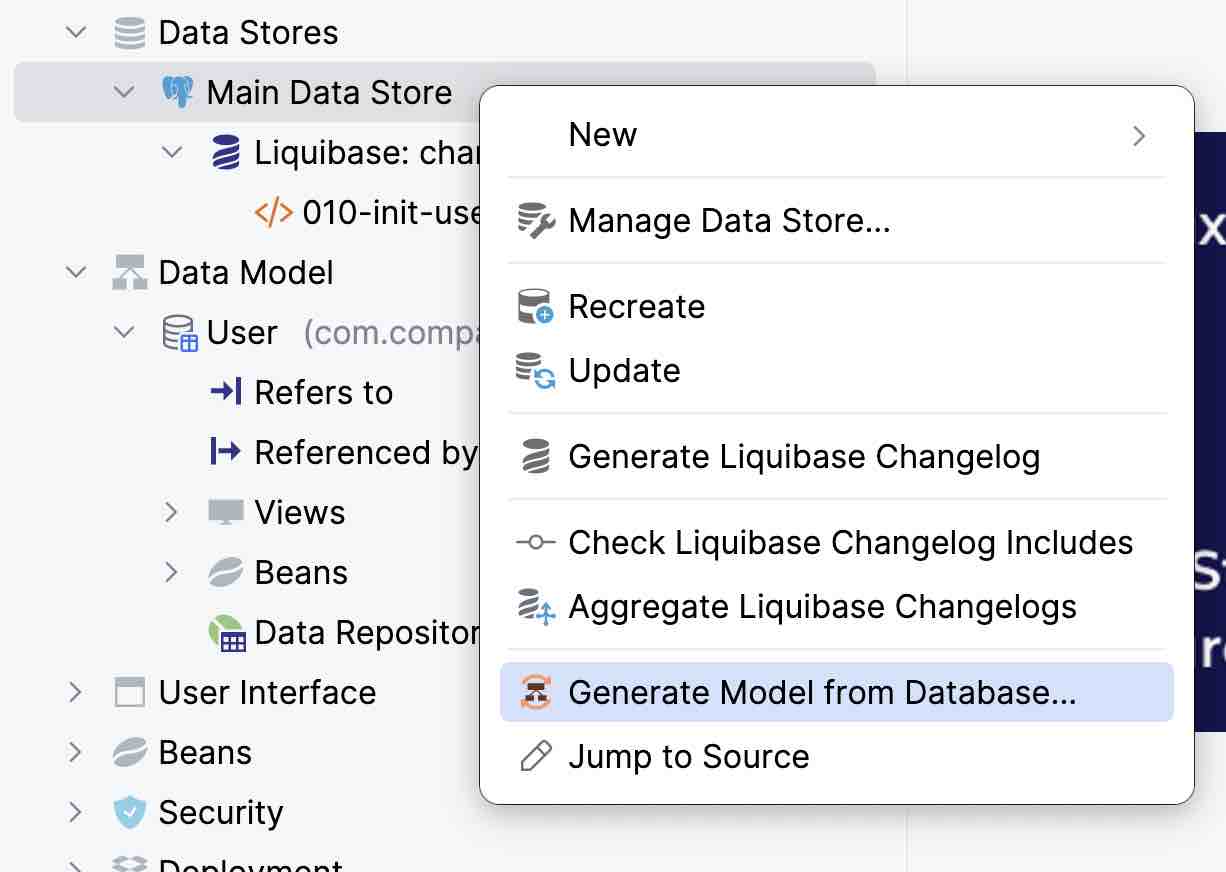
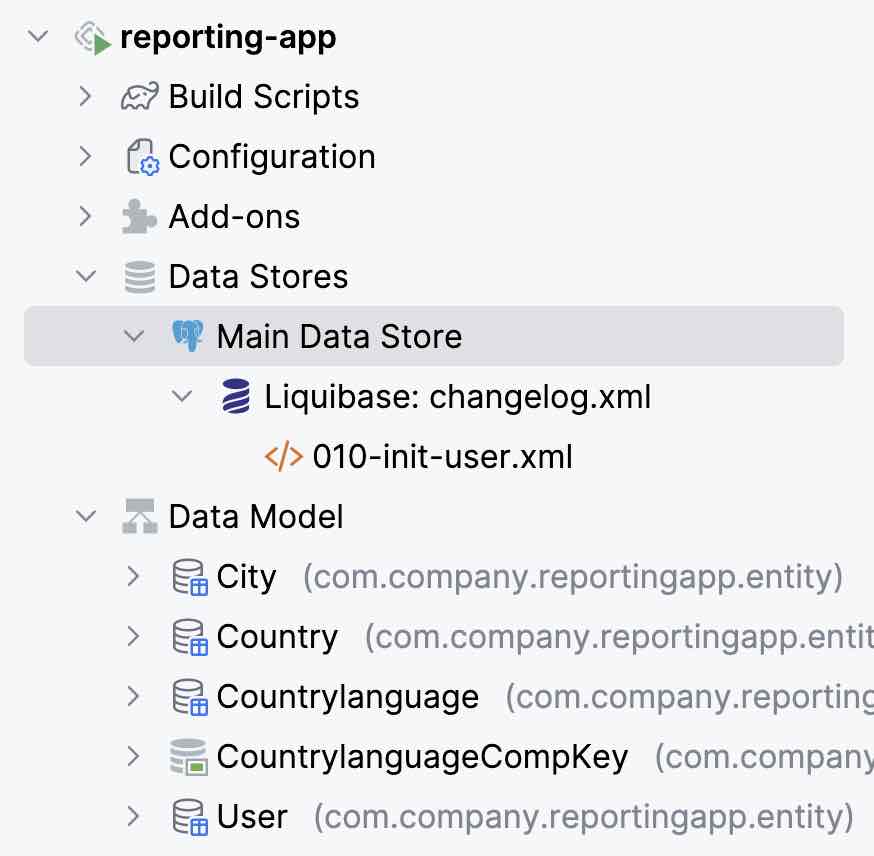
Being an application development framework, Jmix follows a common practice of creating a data model on top of the database, providing a uniform way to access data across the application. To map the table to the data model, right-click the Data Store and select Generate Model from Database.
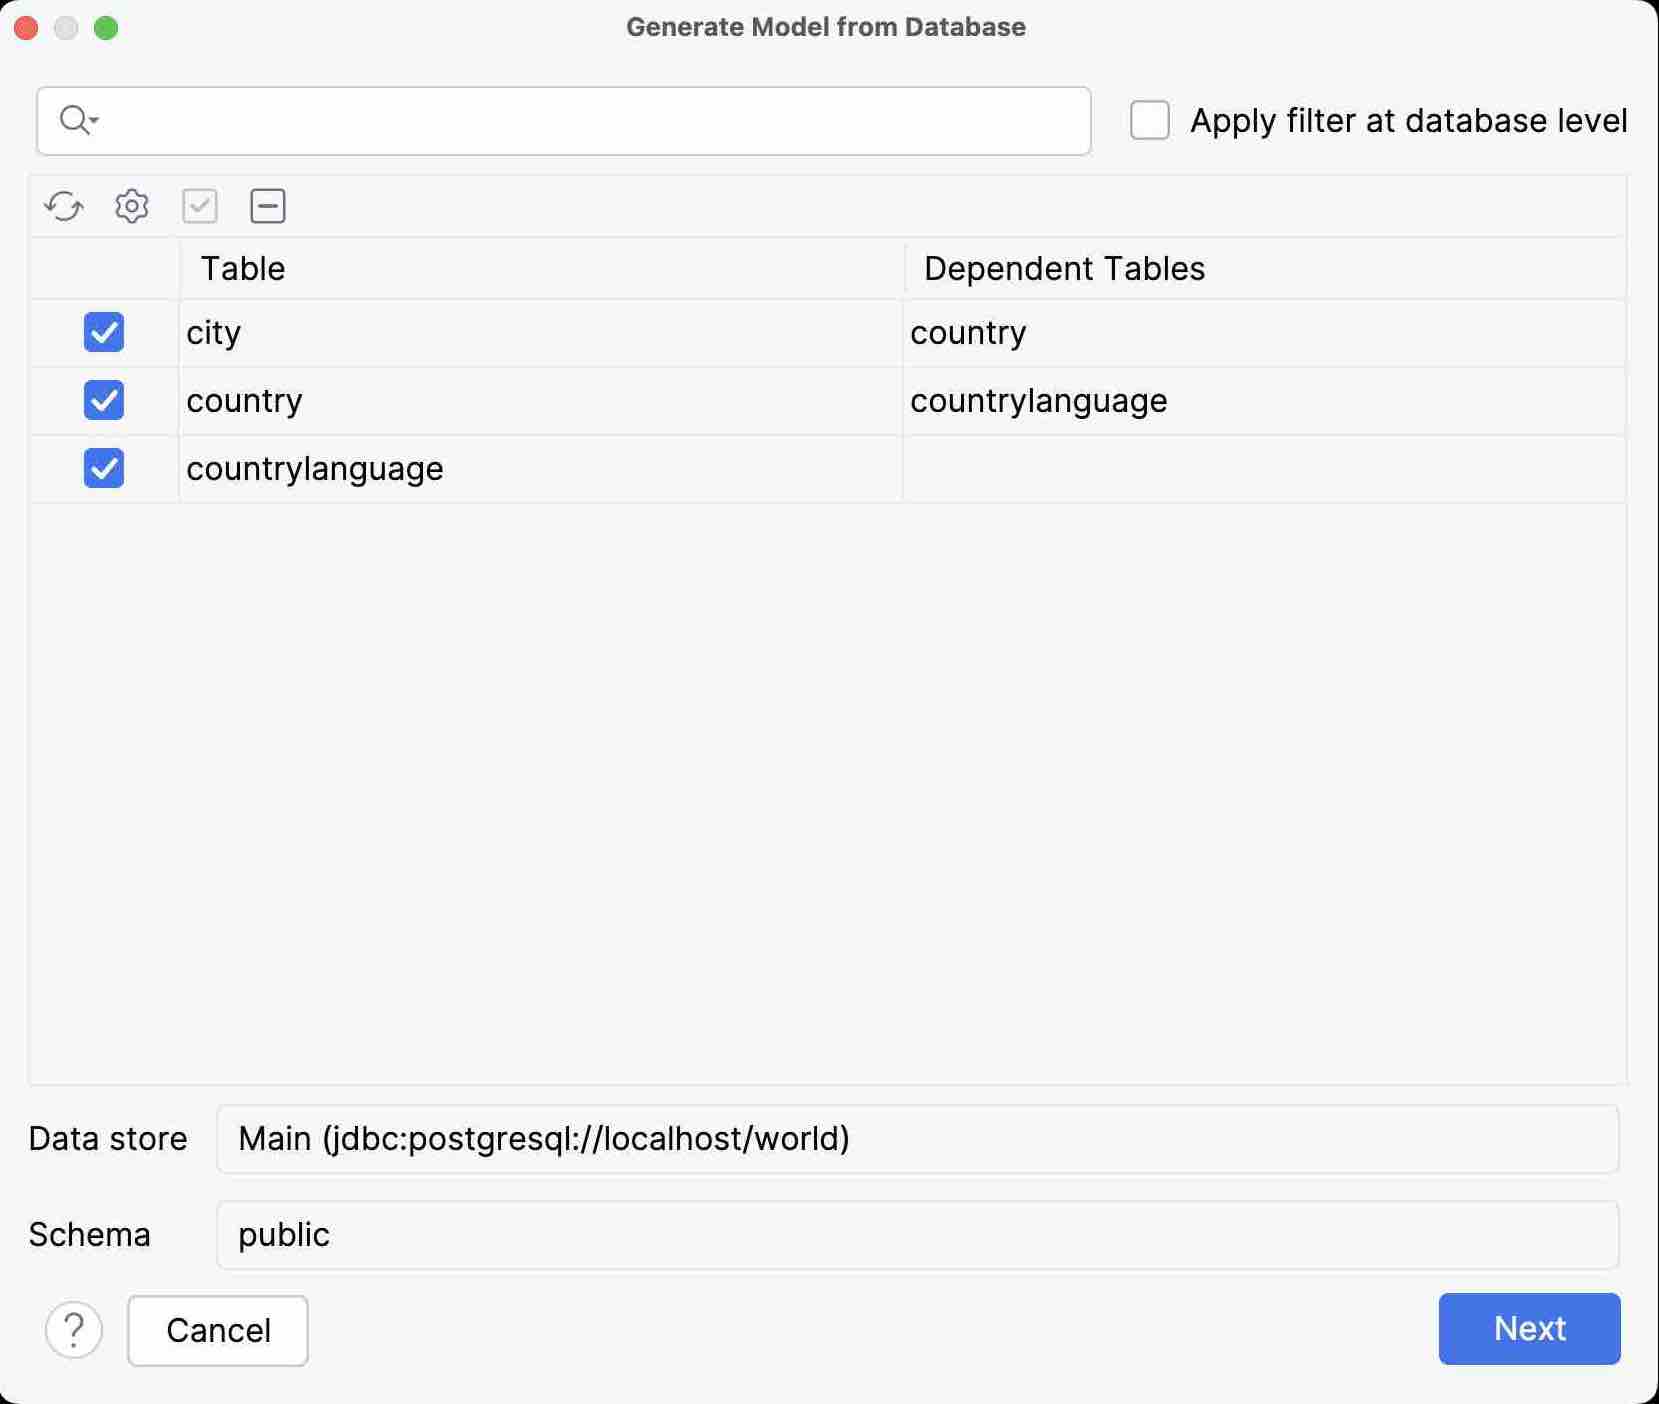
In the wizard that opens, select the tables you want to include:
After that, they will show up under the Data Model section.
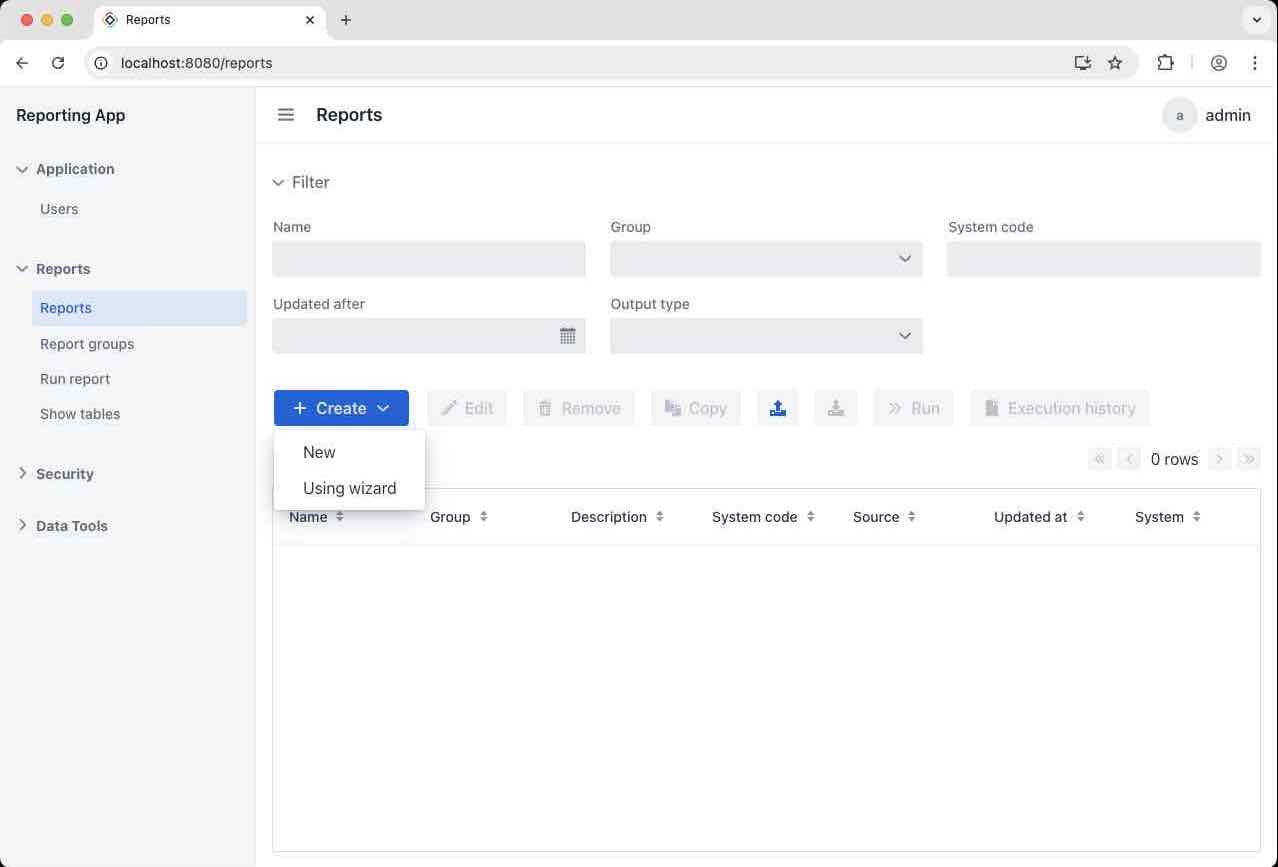
Now run the application in the browser and navigate to Reports in the main menu. On that page, click Create -> New to start creating your first report.
Designing Report
Jmix does not have a dedicated visual designer, but it still offers a true "what you see is what you get" experience. The idea is to create a report template directly in the target output format, DOCX, XLSX, or another, by adding placeholders and named regions. When the report runs, the engine will swap those markers for actual data.
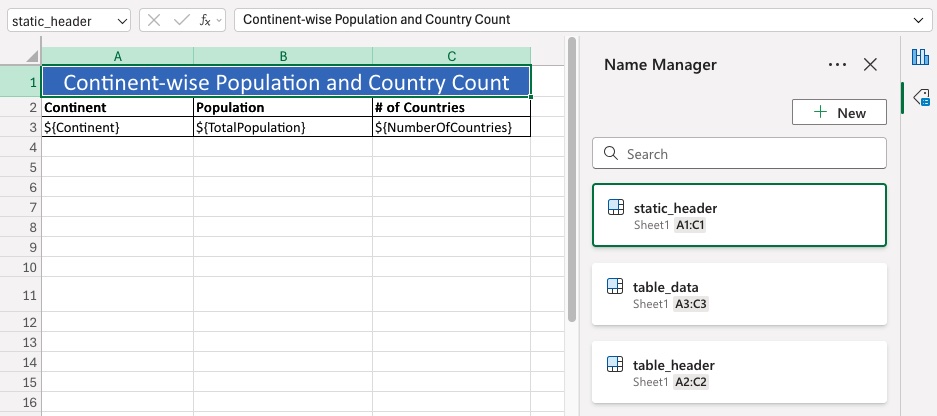
This approach offers natural benefits: there is no need to onboard a new design tool; you can just stick to a familiar office suite with its standard formatting options. In practice, you may even ask a customer to share a sample report, then mirror its structure and visual style within your template.
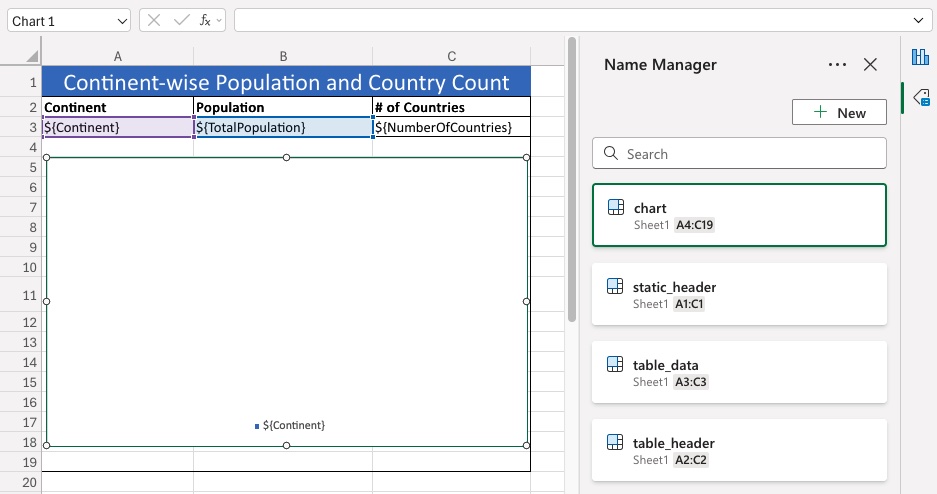
For a moment, I was uncertain how to add charts — something the previous two designers had done easily. Yet the solution was obvious: insert the charts as you normally would. Just make sure to place them within a separate named region and rely on placeholders instead of actual data.
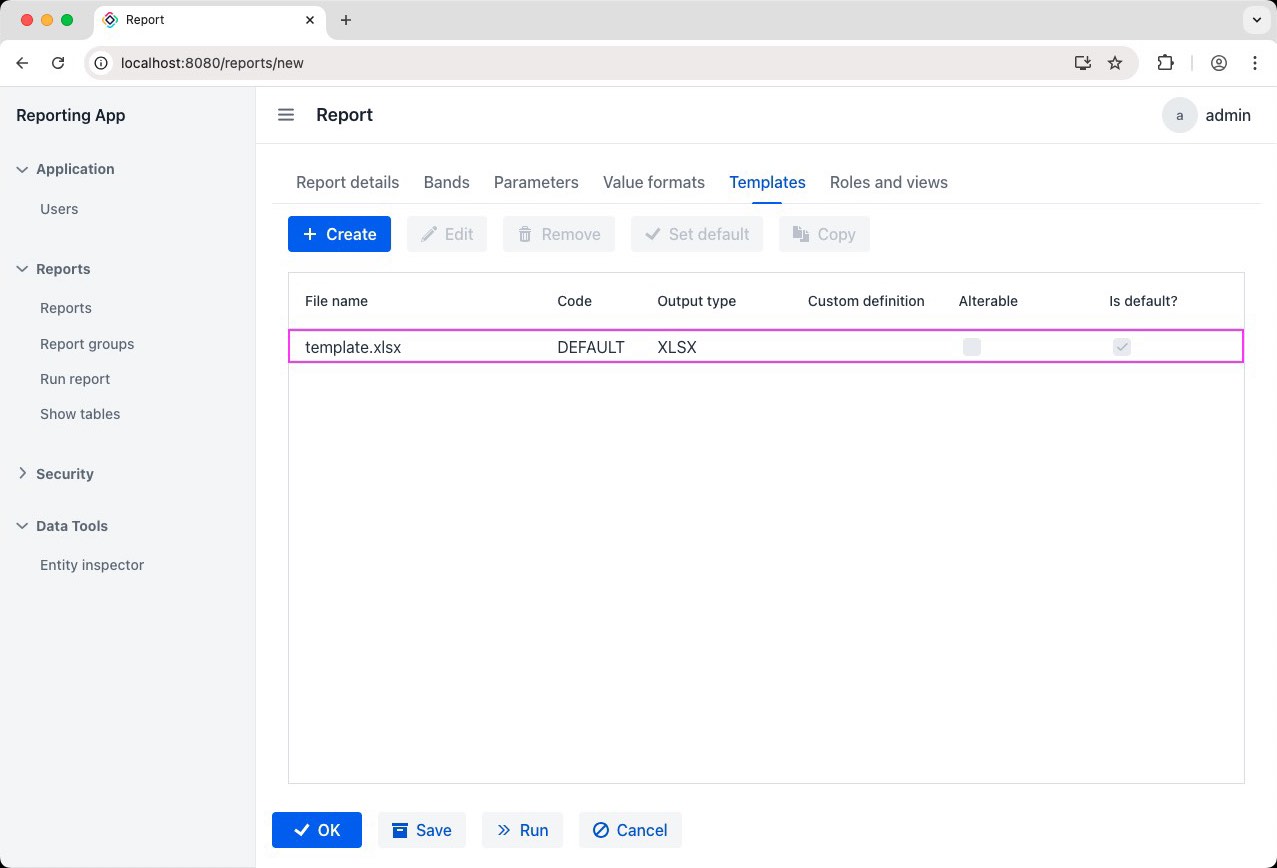
With the template ready, you can get back to the application and use it for the report you created. Just upload it to the Templates tab.
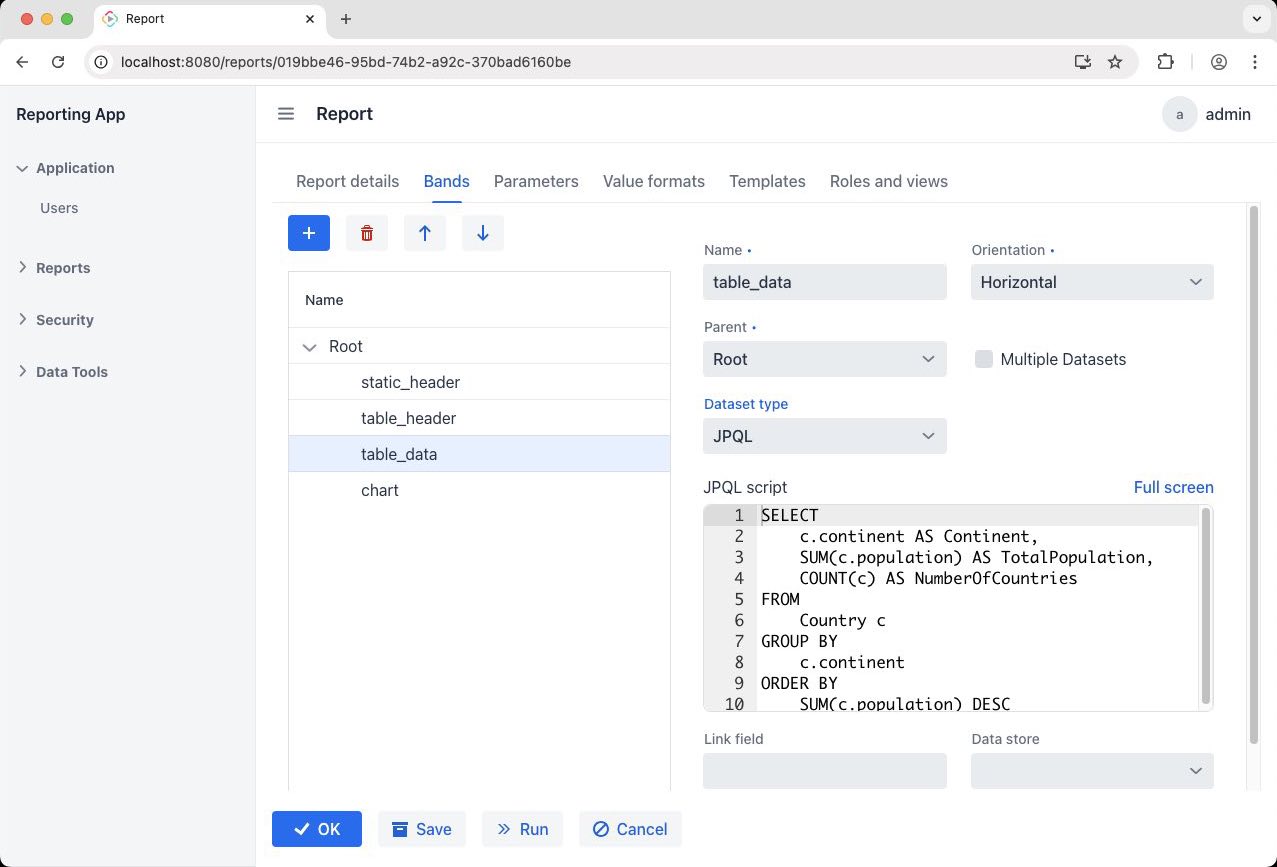
Next, create bands to gather data for each placeholder in the template. JPQL is recommended for retrieving report data consistently with the application's data model, but SQL can still be used for direct database access.
There's also the option to write Groovy scripts to handle specific logic or transformations.
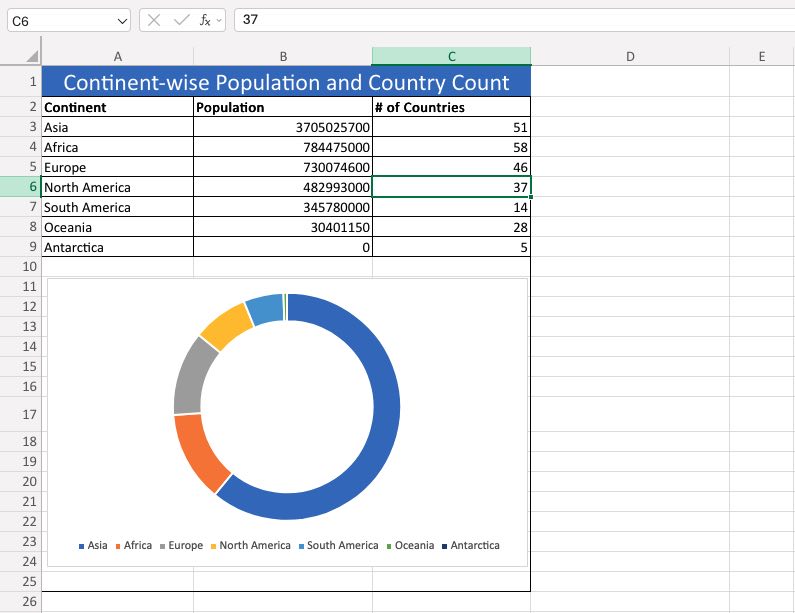
Now that bands are defined, save and run the report. The engine will generate the file for you to download.
Building Reporting Portal
A user-facing portal can be built into the very same application. Jmix Studio supplies ready-made page templates with UI components that automatically connect to the database and the framework's core subsystems. It was easy to create user accounts and limit their access to just the portal page.
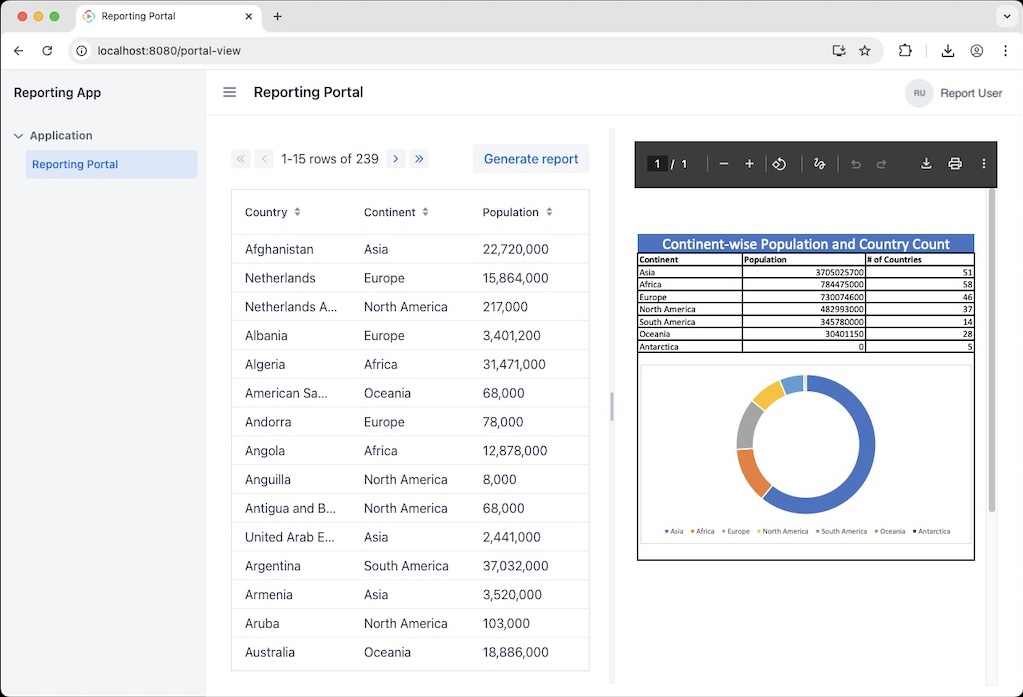
The result is a seamless experience where the reporting UI and the rest of the application share the same security, theming, and data access layer. In fact, it is a standard Spring Boot project, so it can be easily deployed anywhere — on-premises, in the cloud, or in containers.
Integrating to Application
Alternatively, Jmix can serve as a "reporting back-end". For that, enable the Available through REST API flag for the reports.
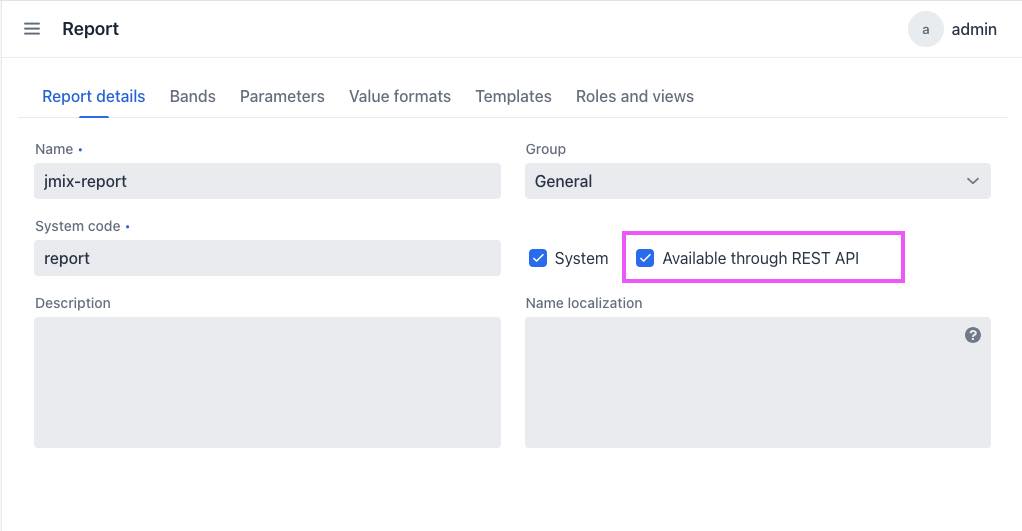
External applications and services can then request the report by hitting the endpoint. This gives front-end teams the freedom to embed the output wherever needed: mobile apps, third-party dashboards, or custom web portals.
Conclusion
With the right tools, reporting can be much easier. Which reporting suite is best for you will depend on your expectations for developer experience, integration depth, and the impact of any existing reports you might already have. To summarize, here are some key takeaways:
JasperReports – the go-to choice when you need:
- a desktop designer producing pixel-perfect reports.
- a comprehensive reporting library.
- the ability to expand into a full-scale BI ecosystem.
Eclipse BIRT – ideal for projects that:
- are built around Eclipse or use the Eclipse IDE.
- require a reporting library with high customization potential.
- need a straightforward API that covers standard reporting requirements.
Jmix Reports – best when you want:
- reporting within a full-stack web development platform based on IntelliJ IDEA.
- tight integration with the application codebase.
- unified security and data model for apps and reports.
Opinions expressed by DZone contributors are their own.
Comments