Memory Leak Due to Uncleared ThreadLocal Variables
ThreadLocal variables in Java, if not cleared, can accumulate in memory, causing an OutOfMemoryError. Learn how to clear them after use to avoid memory leaks.
Join the DZone community and get the full member experience.
Join For FreeIn Java, we commonly use static, instance (member), and local variables. Occasionally, we use ThreadLocal variables. When a variable is declared as ThreadLocal, it will only be visible to that particular thread. ThreadLocal variables are extensively used in frameworks such as Log4J and Hibernate. If these ThreadLocal variables aren’t removed after their use, they will accumulate in memory and have the potential to trigger an OutOfMemoryError.
In this post, let’s learn how to troubleshoot memory leaks that are caused by ThreadLocal variables.
ThreadLocal Memory Leak
Here is a sample program that simulates a ThreadLocal memory leak.
01: public class ThreadLocalOOMDemo {
02:
03:    private static final ThreadLocal<String> threadString = new ThreadLocal<>();
04:
05:    private static final String text = generateLargeString();
06:
07:    private static int count = 0;
08:
09:    public static void main(String[] args) throws Exception {
10:        while (true) {
11:
12:            Thread thread = new Thread(() -> {
13:                threadString.set("String-" + count + text);
14:                try {
15:                    Thread.sleep(Long.MAX_VALUE); // Keep thread alive
16:                } catch (InterruptedException e) {
17:                    Thread.currentThread().interrupt();
18:                }
19:            });
20:
21:            thread.start();
22:            count++;
23:            System.out.println("Started thread #" + count);
24:        }
25:    }
26:
27:    private static String generateLargeString() {
28:        StringBuilder sb = new StringBuilder(5 * 1024 * 1024);
29:        while (sb.length() < 5 * 1024 * 1024) {
30:            sb.append("X");
31:        }
32:        return sb.toString();
33:    }
34:}
35:
Before continuing to read, please take a moment to review the above program closely. In the above program, in line #3, ‘threadString’ is declared as a ‘ThreadLocal’ variable. In line #10, the program is infinitely (i.e., ‘while (true)’ condition) creating new threads. In line #13, to each created thread, it’s setting a large string (i.e., ‘String-1XXXXXXXXXXXXXXXXXXXXXXX…’) as a ThreadLocal variable. The program never removes the ThreadLocal variable once it’s created.
So, in a nutshell, the program is creating new threads infinitely and slapping each new thread with a large string as its ThreadLocal variable and never removing it. Thus, when the program is executed, ThreadLocal variables will continuously accumulate into memory and finally result in ‘java.lang.OutOfMemoryError: Java heap space’.
How to Diagnose ThreadLocal Memory Leak?
You want to follow the steps highlighted in this post to diagnose the OutOfMemoryError: Java Heap Space. In a nutshell, you need to do:
1. Capture Heap Dump
You need to capture a heap dump from the application, right before the JVM throws an OutOfMemoryError. In this post, eight options for capturing a heap dump are discussed. You may choose the option that best suits your needs.
My favorite option is to pass the ‘-XX:+HeapDumpOnOutOfMemoryError -XX:HeapDumpPath=<FILE_PATH_LOCATION>‘ JVM arguments to your application at the time of startup.
Example:
-XX:+HeapDumpOnOutOfMemoryError -XX:HeapDumpPath=/opt/tmp/heapdump.hprofWhen you pass the above arguments, JVM will generate a heap dump and write it to ‘/opt/tmp/heapdump.hprof’ file whenever an OutOfMemoryError is thrown.
2. Analyze Heap Dump
Once a heap dump is captured, you need to analyze the dump. In the next section, we will discuss how to do heap dump analysis.
Heap Dump Analysis: ThreadLocal Memory Leak
Heap dumps can be analyzed using various heap dump analysis tools, such as HeapHero, JHat, and JVisualVM. Here, let’s analyze the heap dump captured from this program using the HeapHero tool.
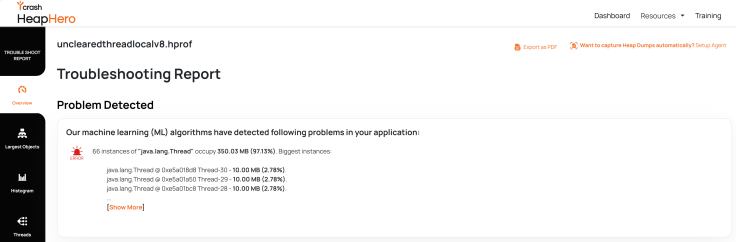
The HeapHero tool utilizes machine learning algorithms internally to detect whether any memory leak patterns are present in the heap dump. Above is the screenshot from the heap dump analysis report, flagging a warning that there are 66 instances of ‘java.lang.Thread’ objects, which together is occupying 97.13% of overall memory. It’s a strong indication that the application is suffering from memory leak and it originates from the ‘java.lang.Thread’ objects.
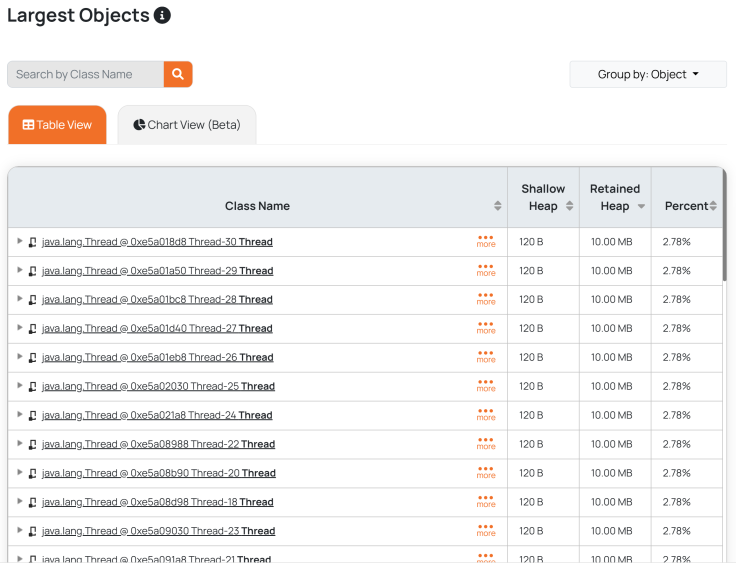
The ‘Largest Objects’ section in the HeapHero analysis report shows all the top memory-consuming objects, as shown in the above figure. Here you can clearly notice that all of these objects are of type ‘java.lang.Thread’ and each of them occupies ~10MB of memory. This clearly shows the culprit objects that are responsible for the memory leak.
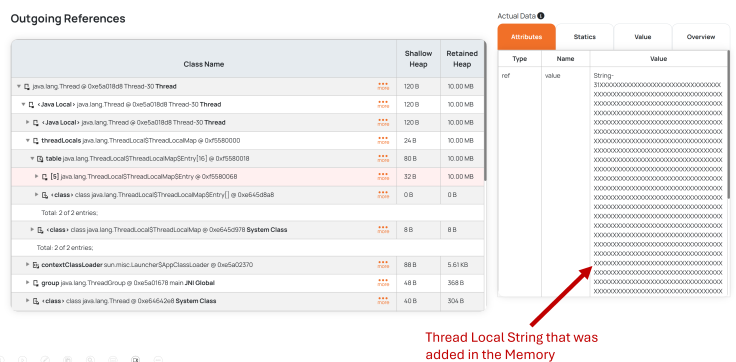
Tools also give the capability to drill down into the object to investigate its content. When you drill down into any one of the Threads reported in the ‘Largest Object’ section, you can see all its child objects.
From the above figure, you can notice the actual ThreadLocal string ‘String-1XXXXXXXXXXXXXXXXXXXXXXX…’ to be reported. Basically, this is the string that was added in line #13 of the above programs to be reported. Thus, the tool helps you to point out the memory-leaking object and its source with ease.
How to Prevent ThreadLocal Memory Leak
Once ThreadLocal variables are used, always call:
threadString.remove();This clears the ThreadLocal variable value from the current thread and avoids the potential memory leaks.
Conclusion
Uncleared ThreadLocal variables are a subtle issue; however, when left unnoticed, they can accumulate over a period of time and have the potential to bring down the entire application. By being disciplined about removing the ThreadLocal variable after its use, and by using tools like HeapHero for faster root cause analysis, you can protect your applications from hard-to-detect outages.
Opinions expressed by DZone contributors are their own.
Comments