A Deep Dive into Tracing Agentic Workflows (Part 2)
Tracing agentic systems uses hierarchical IDs to form a System DAG, exposing performance and cost issues. Observer agents automate diagnosis and system self-correction.
Join the DZone community and get the full member experience.
Join For FreePart 1 dived into what to trace in an agentic system and why. How the traditional tracing and metrics, such as latency, scale, cost, uptime, and throughput, need to be redefined. And how to define the new metrics that are at the core of an agentics system, such as response quality, accuracy, and task completion.
This part is about the mechanics: how a trace is structured, how context propagates across agent boundaries, and how to make sense of it all.
And then, how to automate it all with an observability agent.
Anatomy of a Trace
Every event in the system that's triggered when processing a member's request — from the initial user request to receiving a response back (and any subsequent tracking and orchestration) — belongs to a single trace.
The structure of a trace is hierarchical, built from three key identifiers. These three fields travel in the headers of every internal request and response -
- traceId: Generated once per request, traceId persists throughout and connects all the operations in the entire execution together.
- spanId: Generated for each "unit of work", e.g., agent invocation, LLM call, memory persistence, response chunk streaming. SpanId is what uniquely identifies an operation in the trace.
- parentSpanId: When one operation triggers another, the child span stores the parent’s spanId as its parentSpanId. ParentSpanId is what helps define the relationship between operations, which can then be used to create the execution tree.
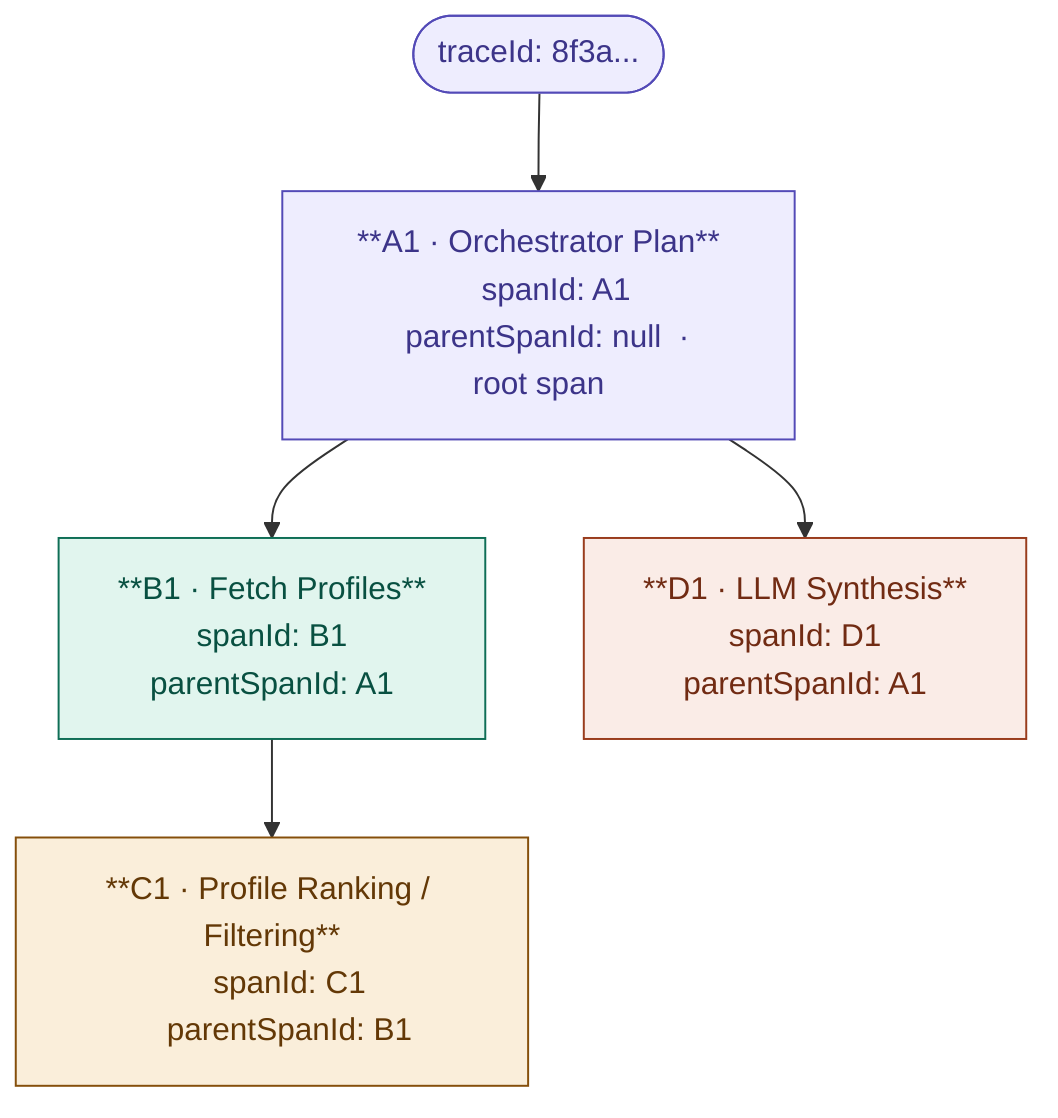
This is how these IDs get logged in a trace:
traceId: 8f3a...

[A1] Orchestrator Plan
traceId      = 8f3a...
spanId       = A1
parentSpanId = null    //root span

[B1] Fetch Profiles
traceId      = 8f3a...
spanId       = B1
parentSpanId = A1

[C1] Profile Ranking
traceId      = 8f3a...
spanId       = C1
parentSpanId = B1

[D1] LLM Synthesis
traceId      = 8f3a...
spanId       = D1
parentSpanId = A1
Every service, agent, and skill that receives a request reads these headers, generates a new spanId for its own work, and passes its spanId as the parentSpanId in any downstream calls it makes. The result is a complete, traversable execution tree where every node knows its parent.
Along with these three fields, a trace should include all important artifacts that need to be tracked for a particular span, such as timestamp, token usage, API, or model version, etc. When collated into a DAG as explained below, whatever can be collected in a span can be optimized in turn.
And that is pretty much how tracing works.
From a Single Trace to a System DAG
A single trace captures one execution.
That alone enables replay — debugging and validating system behavior on a per-request basis. For example, it can help confirm whether the intended tool was triggered, whether graceful degradations kicked in as expected, whether the system took the intended path, or where the workflow faltered to produce an inaccurate or low-quality response.
Many traces sampled together — across users, queries, surfaces, and over time — produce something much more useful: an empirical Directed Acyclic Graph (DAG) of how the system is actually running in production. This aggregated graph shows what is happening, and can be sliced by invocation frequency, timestamp, and cost.
A few critical things become visible only at this level:
Critical Paths
A critical path is a sequence of operations that consistently dominates the end-to-end latency of a system. Tracing surfaces insights such as - which spans sit on the critical path versus which run in parallel without affecting wall-clock time, which calls block downstream work, and where serialization could be replaced with concurrent fan-out.
This is where latency optimization actually pays off. Speeding up off-critical-path operations changes nothing for the user.
Resource and Cost-Intensive Workflows
In agentic systems, token consumption is the dominant cost driver, and it can be orchestrated to show up in aggregated traces. Tracing makes spending attributable by agent, by query type, by model variant, by use case, or by workflow.
Common patterns it exposes:
- An agent quietly pulls oversized context on every invocation.
- A frontier model used for trivial classification or routing where a smaller, cheaper one would suffice.
- Retry behavior or speculative calls that multiply token cost without measurably improving response quality.
- Tools whose outputs are fetched but never end up in the final prompt.
System Inefficiencies
Aggregated tracing surfaces some common pitfalls in the agentic workflows
- Dead branches – skills or agents that exist on paper but rarely fire, or only fire on one narrow query type, signaling candidates for removal or consolidation.
- Outdated paths – code paths intended to be deprecated that still receive traffic from a handful of callers, blocking cleanup.
- Unexpected fan-out – an orchestrator that, under certain prompts, triggers far more downstream calls than its design suggests, inflating both latency and cost.
- Loops and near-loops – repeated transitions between the same agents that indicate stalled reasoning rather than forward progress, often invisible until you look at transition counts across many traces.
And to reiterate, it can be measured, it can be improved. The system DAG helps highlight specific, addressable engineering gaps — backed by data rather than intuition.
Tracing Overhead
Tracing doesn’t come free. Naive instrumentation adds real latency and ships sensitive payloads through the observability stack.
A few defaults worth setting early to minimize these overheads:
- Sample judiciously in production so as not to oversample without losing critical signals. For example, depending on the traffic, one can choose to sample 100% of traces with errors and slow response time, and 5% of the rest.
- Be wary of what’s actually being logged to avoid misuse — redact PII at the span boundary rather than at query time,
- Emit spans asynchronously, as a blocking exporter on the request path defeats the purpose.
Closing the Loop: Agents Observing Agents
The structural primitives that render traces queryable for humans similarly make them consumable by machine intelligence. When spans are emitted in a consistent, structured format, an observer agent can ingest the stream to compute rolling metrics and detect drifts, such as rising p95 on a specific tool, token consumption creeping up on an untouched agent, or transition counts that signal an emerging loop.
This observer doesn't have to stop at detection and alerting. A higher-order agent can subscribe to these signals to automate corrective actions: replacing a failing node, shifting traffic to faster model variants, tightening retry limits, disabling misbehaving skills, or falling back to cached responses.
By attaching offending trace IDs to an auto-generated ticket, the trace becomes the input for the system's next decision: detect → diagnose → mitigate, automated end-to-end.
The tractability of this approach lies in the contract between layers: traceId, spanId, parentSpanId, and a payload. Observer agents require no bespoke integrations or complex plumbing; they read the same spans humans monitor in dashboards. Ultimately, the agentic system observes and corrects itself using the very substrate it produces.
Conclusion
Done well, the same trace stream that engineers query for debugging becomes the input layer for observer agents that monitor, diagnose, and remediate the system in flight, turning observability from a human dashboard into a closed loop that the system runs on itself.
Opinions expressed by DZone contributors are their own.
Comments