Tracing in Distributed Systems With Spring Cloud Sleuth
Learn how tracing with Spring Cloud Sleuth can solve the various difficulties with traceability in distributed systems like microservices.
Join the DZone community and get the full member experience.
Join For FreeIn a distributed system, potentially many services are involved in creating a response to a single request. Not only for debugging purposes, it’s essential that the path of such a request can be traced through all involved services. This article gives an overview of the traceability problem in distributed systems and provides some tips on how to implement tracing with Spring Cloud Sleuth.
Traceability in Distributed Systems
Even in a monolithic system, tracing a bug can be hard enough. To find the root cause of an error you search through the log files of the application servers around the point in time the error occurred and hope that you find a stacktrace that explains the error. Ideally, the error message contained a correlation ID that uniquely identifies the error, so that you can just search for that correlation ID in the log files. It’s another plus when the log files are aggregated in a central, searchable log server like Graylog.
In a distributed system, this tracing gets even harder since many different services running on different machines may be involved in responding to a single request. Here, a central log server and a correlation ID are not negotiable. But the correlation ID now spans different services and thus has to be shared across service boundaries.
As an example for this article, let’s have a look at a distributed system with three services (see figure below). As result of a request getCustomerWithAddresswe expect customer and address data as a response. The customer and address data each live in the responsibility of a different service so that the initial service (the “downstream” service) has to forward a request to those (“upstream”) services and aggregate their responses.
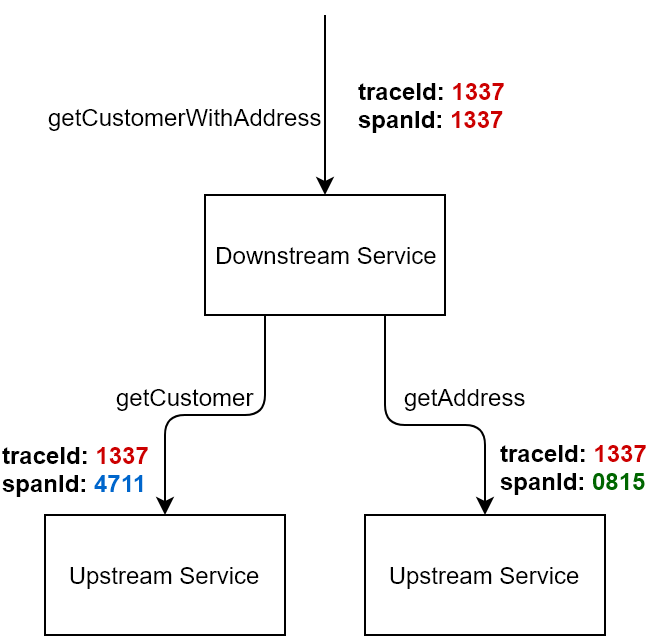
If an error occurs in one of those upstream services, the upstream service will probably log the error. Since the downstream services receives an error response, it will probably also log an error. For a straightforward error analysis, both log entries should be connected by a shared correlation ID.
This correlation ID is usually called a trace ID. A trace ID is created when a request from outside of the system is directed at a downstream service. Within the system, the trace ID is then passed on to the upstream services so they can use them in their log entries.
Implement Tracing With Spring Cloud Sleuth
Spring Cloud Sleuth is a library that supports implementing such a trace ID. Sleuth is part of the Spring Cloud project which provides solutions for cloud systems (which are distributed systems by definition). The following sections describe how to activate Sleuth in a Spring Boot application and provide a couple getting started tips.
If you would rather look at code than read words, most of the code examples in this article can be found in these Github repositories: downstream-service and upstream-service.
Activate Spring Cloud Sleuth
First of all, Spring Cloud Sleuth has to be added as a dependency in your build management tool. For Gradle:
compile('org.springframework.cloud:spring-cloud-starter-sleuth:1.2.4.RELEASE')After this, Sleuth is activated by default and creates a trace ID for each incoming request. If the header x-b3-traceid of the incoming request already contains a trace ID, the existing trace ID will be used. In outgoing requests, the trace ID is put into the header so that the next upstream service can read it.
The name of the header field consists of the prefix x, which is used for custom headers that are not part of the HTTP specification, and b3 for “BigBrotherBird,” which once was the name of the popular tracing UI Zipkin. Sleuth borrows its vocabulary from Zipkin.
Writing the Trace ID Into a Log
Now that a trace id is available, it shall be included in our log output. Sleuth supports this by writing the trace ID into the Mapped Diagnostic Context (MDC) of SLF4J. This way, it can be accessed in log pattern configurations using the name X-B3-TraceId. This is an example pattern for a Logback configuration:
%d{yyyy-MM-dd HH:mm:ss.SSS} %5p [%X{X-B3-TraceId:-}] %m%nThe log pattern above creates the log output below. The first row comes from the downstream server, the other rows from an upstream service each.
2017-09-03 15:31:29.189  INFO [903c472a08e5cda0] COLLECTING CUSTOMER AND ADDRESS WITH ID 1 FROM UPSTREAM SERVICE
2017-09-03 15:31:29.193  INFO [903c472a08e5cda0] GETTING CUSTOMER WITH ID 1
2017-09-03 15:31:29.198  INFO [903c472a08e5cda0] GETTING ADDRESS FOR CUSTOMER WITH ID 1
Output the Service Name
The log output so far does not say which service it comes from. To add this information to the logs, you can use the logging features of Spring Boot. Spring Boot supports using environment variables in its logging configuration. If you use Logback, you simply have to create a file logback-spring.xml and can then use <springProperty/> to access environment variables like spring.application.name:
<?xml version="1.0" encoding="UTF-8"?>
<configuration>
    <include resource="org/springframework/boot/logging/logback/defaults.xml"/>
    <springProperty scope="context" name="springAppName" source="spring.application.name"/>
    <property name="CONSOLE_LOG_PATTERN"
              value="%d{yyyy-MM-dd HH:mm:ss.SSS} %5p [${springAppName},%X{X-B3-TraceId:-}] %m%n"/>
    <!-- appenders omitted ... -->
</configuration>
The environment variables are loaded from the Spring Boot configuration, which usually lies in the file application.properties. Since there can be log output before the file application.properties is loaded, Spring Cloud supports another file called bootstrap.properties, which is loaded earlier. So all properties which are needed in log output should be put into this file instead.
Log output including the service name then looks like this:
2017-09-03 15:31:29.189  INFO [sleuth-downstream-service,903c472a08e5cda0] COLLECTING CUSTOMER AND ADDRESS WITH ID 1 FROM UPSTREAM SERVICE
2017-09-03 15:31:29.193  INFO [sleuth-upstream-service,903c472a08e5cda0] GETTING CUSTOMER WITH ID 1
2017-09-03 15:31:29.198  INFO [sleuth-upstream-service,903c472a08e5cda0] GETTING ADDRESS FOR CUSTOMER WITH ID 1
Output the Trace ID in Exceptions
Exception logs should include the trace ID since tracing errors is a main reason for introducing the trace ID in the first place. Sadly, exceptions that bubble up in Spring Boot cannot access the trace ID since they are not handled by Spring Boot but by the application server.
However, this problem is easily solved by creating a custom exception handler that runs within the Spring Boot context. A custom exception handler is usually a good idea in any case. A simple exception in Spring MVC looks like this:
@ControllerAdvice
public class ControllerExceptionHandler {

  private Logger logger = LoggerFactory.getLogger(ErrorHandler.class);

  @ResponseStatus(value = HttpStatus.INTERNAL_SERVER_ERROR)
  @ExceptionHandler(Exception.class)
  @ResponseBody
  public String handleInternalError(Exception e) {
    logger.error("internal server error", e);
    return "Internal Server Error";
  }

}
Pass the Trace ID to the Client
In some cases, it may be required to show the trace ID to the user so that he can provide the trace ID to a support hotline in case of an error. The support engineer can then search the log files for that trace ID to find the root cause. Since the trace ID is accessible via MDC, it can be read from the MDC at any time and may be passed on to the client in case of an error. An adapted exception handler that does just that may look like this:
@ControllerAdvice
public class ErrorHandler {

  private Logger logger = LoggerFactory.getLogger(ErrorHandler.class);

  @ResponseStatus(value = HttpStatus.INTERNAL_SERVER_ERROR)
  @ExceptionHandler(Exception.class)
  @ResponseBody
  public String handleInternalError(Exception e) {
    logger.error("internal server error", e);
    return String.format("Internal Server Error (traceId: %s)", MDC.get("X-B3-TraceId"));
  }

}
Instead of passing the trace ID as part of an error message you can, of course, create a structured JSON answer which includes the trace ID as a separate field for better processing.
Send the Trace ID to a Central Log Server
When using a log server like Graylog, it is a good idea to send the trace ID to that log server not only as part of the log message string but also as a separate, searchable and indexable field. A default format for passing log events to a log server is Graylog Extended Log Format (GELF). The following logback configuration uses the library me.moocar:logback-gelf to transform log events into the GELF format and to send them to the log server:
<configuration>
    <include resource="org/springframework/boot/logging/logback/defaults.xml"/>
    <springProperty scope="context" name="springAppName" source="spring.application.name"/>
    <appender name="GELF" class="me.moocar.logbackgelf.GelfUDPAppender">
        <remoteHost>graylog.host</remoteHost>
        <port>12201</port>
        <encoder class="ch.qos.logback.core.encoder.LayoutWrappingEncoder">
            <layout class="me.moocar.logbackgelf.GelfLayout">
                <includeFullMDC>true</includeFullMDC>
                <staticField class="me.moocar.logbackgelf.Field">
                  <key>serviceName</key>
                  <value>${springAppName}</value>
                </staticField>
            </layout>
        </encoder>
    </appender>

    <root level="debug">
        <appender-ref ref="GELF" />
    </root>
</configuration>
The parameter includeFullMDC includes all MDC fields (including our trace ID) as separate fields in the GELF data structure so that the log server can store and index them in a structured manner.
The above configuration again uses the logging features provided by Spring Bootto send the value of the environment variable spring.application.name to the log server as a separate field named serviceName.
Analyze Traces
If trace IDs in the log files are not enough, you can perform a more sophisticated trace analysis by using Zipkin. Zipkin is an application that collects tracing data and displays detailed data about it in a web UI. This data contains the duration of the single steps between services among a lot of other things.
Sleuth sends its tracing data to Zipkin by default, if the following dependency is added to your project (Gradle notation):
compile('org.springframework.cloud:spring-cloud-starter-zipkin')Additionally, the following property must be set in application.properties to contain the host name of the Zipkin server.
spring.zipkin.baseUrl: http://localhost:9411/Wrap Up
This article has shown that a trace-supporting logging configuration with Spring Boot, Logback and Sleuth is not that much work, if you know where to look. Even sending the tracing data to a central log server in a structured fashion is quite easily possible and a must-have for distributed systems.
Example Projects
Projects containing the downstream and upstream services from this articles example can be found here: downstream-service and upstream-service. Both projects contain a README that explains the steps how to test the application.
Published at DZone with permission of Tom Hombergs. See the original article here.
Opinions expressed by DZone contributors are their own.
Comments