Troubleshooting App Unresponsiveness Due to Oracle DB
A slowdown in the Oracle RAC cluster degraded an entire application’s response time. Here, let’s discuss the steps we pursued to troubleshoot this problem.
Join the DZone community and get the full member experience.
Join For FreeRecently we encountered a production in an application. This application was connecting to multiple systems of records (SOR). Oracle RAC cluster is one of the primary systems of record. This Oracle RAC cluster was slowing down due to resource constraints. This slowdown in the Oracle RAC cluster degraded the entire application’s response time. In this post, let’s discuss the steps we pursued to troubleshoot this problem.
Capturing Troubleshooting Artifacts
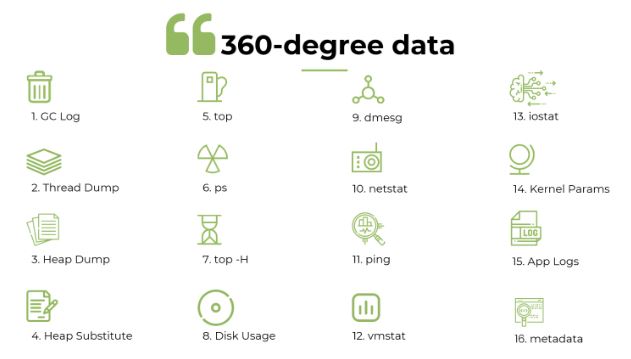
The application was running on a WebLogic server. All of a sudden, this application started to become unresponsive. We ran the yCrash open-source script against it. This script captures 16 different troubleshooting artifacts such as Garbage Collection log, thread dump, heap dump, netstat, vmstat, iostat, top, etc. from the application stack. When an application becomes unresponsive, there could be multiple reasons for it: Garbage collection pauses, threads getting blocked, network connectivity issues, CPU starvation, memory constraints, etc. Thus, it’s ideal to capture all the troubleshooting artifacts.
Analyzing Thread Dumps
Once all the artifacts were captured, we uploaded the captured artifacts to the yCrash server. yCrash server analyzed all these artifacts and generated a root cause analysis immediately.
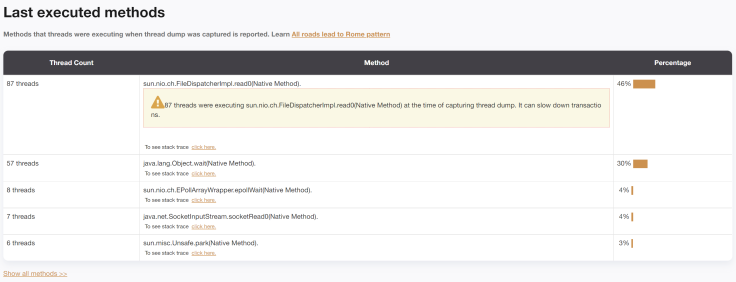
Screenshot of last executed methods from yCrash
The tool generated a warning indicating that 46% of threads in the application were executing the sun.nio.ch.FileDispatcherImpl.read0(Native Method) and it might be a concern. Thus, we investigated the stack trace of those threads. Below is the top part of those threads' stack trace:
java.lang.Thread.State: RUNNABLEat sun.nio.ch.FileDispatcherImpl.read0(Native Method)at sun.nio.ch.SocketDispatcher.read(SocketDispatcher.java:39)at sun.nio.ch.IOUtil.readIntoNativeBuffer(IOUtil.java:223)at sun.nio.ch.IOUtil.read(IOUtil.java:197)at sun.nio.ch.SocketChannelImpl.read(SocketChannelImpl.java:378)- locked <0x00007fa93f8cfac0> (a java.lang.Object)at oracle.net.nt.TimeoutSocketChannel.read(TimeoutSocketChannel.java:174)at oracle.net.ns.NSProtocolNIO.doSocketRead(NSProtocolNIO.java:555)at oracle.net.ns.NIOPacket.readHeader(NIOPacket.java:258)at oracle.net.ns.NIOPacket.readPacketFromSocketChannel(NIOPacket.java:190)at oracle.net.ns.NIOPacket.readFromSocketChannel(NIOPacket.java:132)at oracle.net.ns.NIOPacket.readFromSocketChannel(NIOPacket.java:105)at oracle.net.ns.NIONSDataChannel.readDataFromSocketChannel(NIONSDataChannel.java:91)at oracle.jdbc.driver.T4CMAREngineNIO.prepareForUnmarshall(T4CMAREngineNIO.java:764)at oracle.jdbc.driver.T4CMAREngineNIO.unmarshalUB1(T4CMAREngineNIO.java:429)at oracle.jdbc.driver.T4CTTIfun.receive(T4CTTIfun.java:407)at oracle.jdbc.driver.T4CTTIfun.doRPC(T4CTTIfun.java:268)at oracle.jdbc.driver.T4C8Oall.doOALL(T4C8Oall.java:655)at oracle.jdbc.driver.T4CCallableStatement.doOall8(T4CCallableStatement.java:265)at oracle.jdbc.driver.T4CCallableStatement.doOall8(T4CCallableStatement.java:86)at oracle.jdbc.driver.T4CCallableStatement.executeForRows(T4CCallableStatement.java:965)at oracle.jdbc.driver.OracleStatement.doExecuteWithTimeout(OracleStatement.java:1205)at oracle.jdbc.driver.OraclePreparedStatement.executeInternal(OraclePreparedStatement.java:3666)at oracle.jdbc.driver.T4CCallableStatement.executeInternal(T4CCallableStatement.java:1358)at oracle.jdbc.driver.OraclePreparedStatement.execute(OraclePreparedStatement.java:3778)- locked <0x00007fa93f8b5998> (a oracle.jdbc.driver.T4CConnection)at oracle.jdbc.driver.OracleCallableStatement.execute(OracleCallableStatement.java:4251)- locked <0x00007fa93f8b5998> (a oracle.jdbc.driver.T4CConnection)at oracle.jdbc.driver.OraclePreparedStatementWrapper.execute(OraclePreparedStatementWrapper.java:1081)at weblogic.jdbc.wrapper.PreparedStatement.execute(PreparedStatement.java:119)
From the stack trace, you can observe that all those threads were waiting for a response from the Oracle database. Basically, the stack trace is indicating that the threads are leveraging the Oracle JDBC driver to make backend database calls, and those calls are getting stuck. 46% of threads connecting to the Oracle database was too high for the amount of traffic this application processes. It clearly indicates that threads are getting stuck while making calls to the Oracle database.
Flame Graph in Thread Dump Analysis
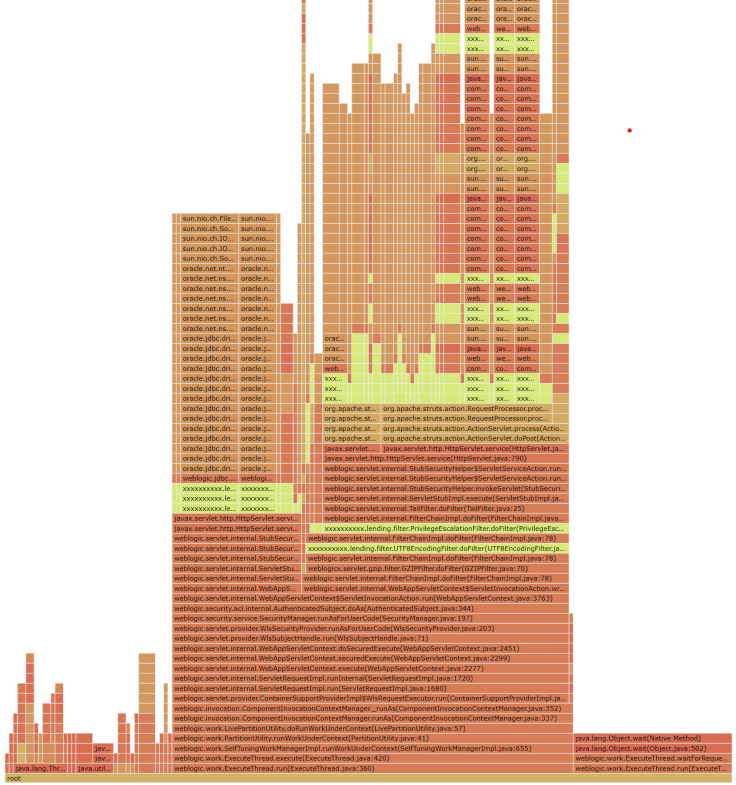
Flame graph of Threads generated by yCrash
Above is the flame graph of the thread dump generated by the yCrash tool. The flame graph shows the consolidated view of all the threads in one single view. This Oracle database slowdown issue was also visible in the Flame graph. Several tips of the Flame graph contain the same sun.nio.ch.FileDispatcherImpl.read0(Native Method) method. If you can see the towers beneath these they indicate the Oracle JDBC driver stack trace. It’s hard to explain the flame graph flow in the text. You might want to watch the video below, where I attempt to explain this flame graph visually.
Oracle Database Slowdown
After this double confirmation, it was conclusive that 46% of threads are stuck waiting for a response from the Oracle database. Thus, we escalated this issue to the Oracle database Administrator (DBA). DBA immediately confirmed that there were certain resource constraints on the Oracle database side, which caused the transactions to slow down. Once sufficient capacity was allocated to the Oracle database, the application started to respond normally.
Video
To see the visual walk-through of this post, click below:
Published at DZone with permission of Ram Lakshmanan. See the original article here.
Opinions expressed by DZone contributors are their own.
Comments