

Ingesting Public Data That Fails Silently: Patterns From a TypeScript and Cloudflare Workers Pipeline
Public statistical data rarely throws an error when it goes wrong. Five defenses from a pipeline built on wage, price index and ZIP crosswalk datasets.
Abstract
Public statistical datasets rarely fail with an error. When something goes wrong, they hand back a plausible number, an HTML page with a success status, or a series that has quietly stopped updating. This article describes the ingestion pipeline behind a residential concrete cost estimator that combines four public datasets: an annual occupational wage survey, a monthly producer price index, a 2022 industry benchmark of material prices, and a ZIP code to metro area crosswalk.
For each dataset, I document the failure mode we actually observed, the evidence for it, and the TypeScript code that turns it into an explicit state. The central claim is that every silent failure should become a typed value that travels with the number all the way to the user interface. The pipeline runs on a local CLI and a scheduled Cloudflare Worker, writes to Cloudflare D1, and serves a static site.
Introduction
The application, Concrete Cost Calculator, estimates what a home concrete job costs in a given metro area. Labor is priced from hourly wages for cement masons and concrete finishers in 393 metropolitan areas. Material is priced from a 2022 national benchmark for ready-mix concrete, moved forward in time with a producer price index and adjusted for four broad regions. A visitor's ZIP code is mapped to a metro area through a crosswalk file.
Each of these datasets is documented and free to use. Each one also failed us at least once in a way that produced no exception. The cost of such a failure is high because the output is a price: a wage parsed as zero, or a material index read six months stale, yields an estimate that looks reasonable and is wrong.
The rest of the article follows the data from source to screen. Section 2 describes the architecture and why it is split the way it is. Section 3 covers five failure modes and their defenses. Section 4 describes how provenance is carried with every value. Section 5 covers the write path. Sections 6 and 7 discuss trade-offs and limitations.
System Overview
The pipeline has three entry points, and the split between them is driven by two hard constraints: memory and network reachability.
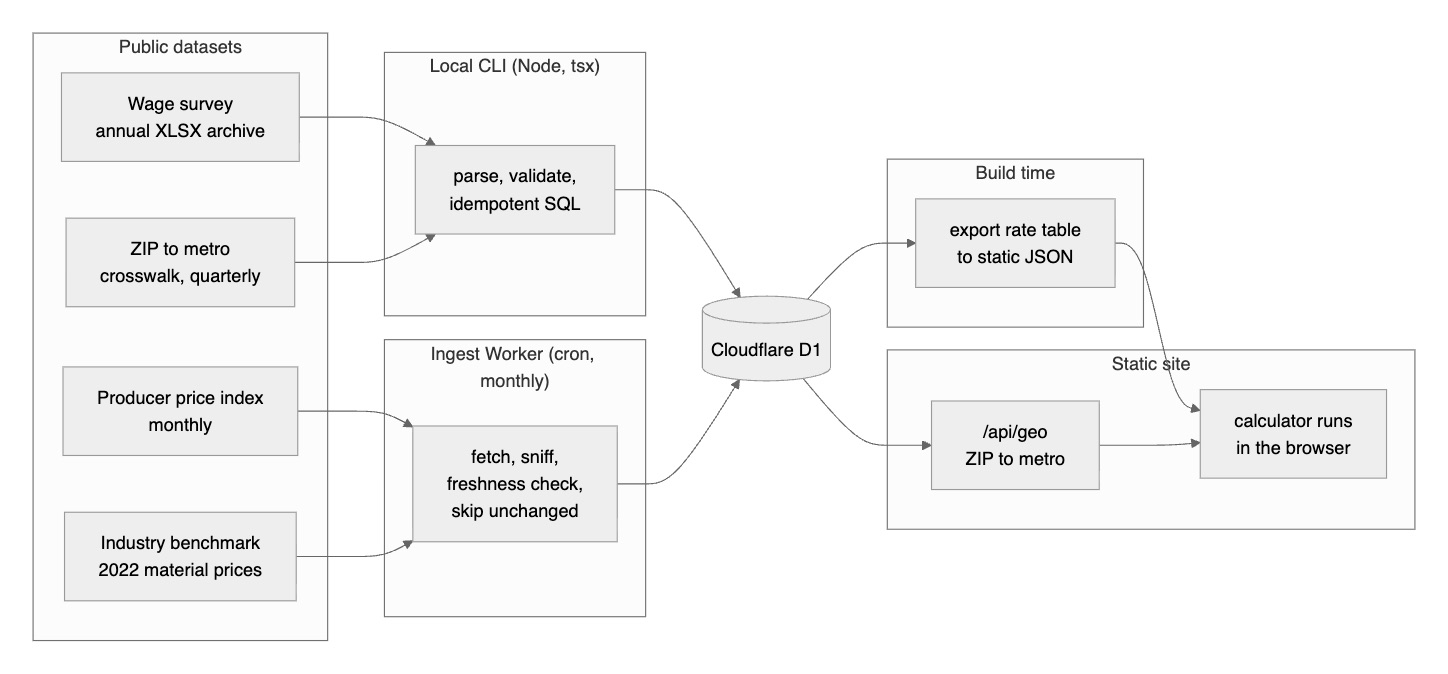
Memory. The wage survey is released once a year as an archive of spreadsheets of roughly 40 MB. Parsing the metro and nonmetro workbooks needed a heap of about 965 MB in Node. A Cloudflare Worker is limited to 128 MB of memory, so the annual parse runs in a local CLI and the result is written to D1 as SQL.
Reachability. The three remote APIs sit behind three different CDNs and behave differently depending on where the request comes from. During development, we recorded the following:
| Dataset API | From the Worker | From a browser | Reason |
|---|---|---|---|
| ZIP crosswalk | blocked (nginx 403) | works | the API returns access-control-allow-origin: * |
| Price index | works | fails | no CORS headers are sent |
| Industry benchmark | works | not tested | parameters must be packed into one codeset value |
The first two rules point in opposite directions, which is why no single fetch strategy covers all sources. The crosswalk is pulled quarterly through the CLI. The price index and the benchmark are pulled by a separate ingest Worker on a monthly cron (17 5 1 , 05:17 UTC on the first day of each month). The site itself is a different deployment with no custom Worker entry: every page is prerendered, the rate table is exported from D1 to a static JSON file at build time, and the calculator runs in the browser. The only server route maps a ZIP code to a metro area.
Failure Modes and Defenses
1. A Numeric Cell Has Three States
Claim. A spreadsheet cell from the wage survey can hold a number, a flag, or nothing, and these must stay distinct.
Evidence. The survey publishes markers inside numeric columns. An asterisk means the wage estimate is unavailable, a double asterisk means the employment estimate is unavailable, and a hash means the value is above the top code. The common idiom Number(raw) || 0 converts "*" to NaN and then to zero, so "no wage available" becomes "this metro pays $0 an hour". Nothing throws. The comment above our parser states the rule directly:
Never writeNumber(raw) || 0.Number('*')isNaN, andNaN || 0silently turns "wage not available" into "hourly wage $0". An empty cell is a third state: "there is no cell" is different from "the cell is flagged as unavailable", and both are different from "the cell is 0".
Defense. Parse into a value and a flag, and keep a third state for a truly empty cell. The parser does not assume the set of flags is fixed, since a future release may introduce a new symbol.
export interface NumericCell {
  value: number | null;
  /** Any non numeric marker such as '*', '**' or '#', kept verbatim. */
  flag: string | null;
}

export function parseNumericCell(raw: unknown): NumericCell {
  if (raw === null || raw === undefined) return { value: null, flag: null };
  if (typeof raw === 'number') {
    return Number.isFinite(raw) ? { value: raw, flag: null } : { value: null, flag: String(raw) };
  }
  const trimmed = String(raw).trim();
  if (trimmed === '') return { value: null, flag: null };
  const asNumber = Number(trimmed);
  if (Number.isFinite(asNumber)) return { value: asNumber, flag: null };
  // Anything else is a marker. Store it; never coerce it.
  return { value: null, flag: trimmed };
}
The database schema mirrors this: each wage column is nullable and has a companion flag column.
2. A Successful Response Can Be a Block Page
Claim. An HTTP status code is insufficient evidence that a response contains data.
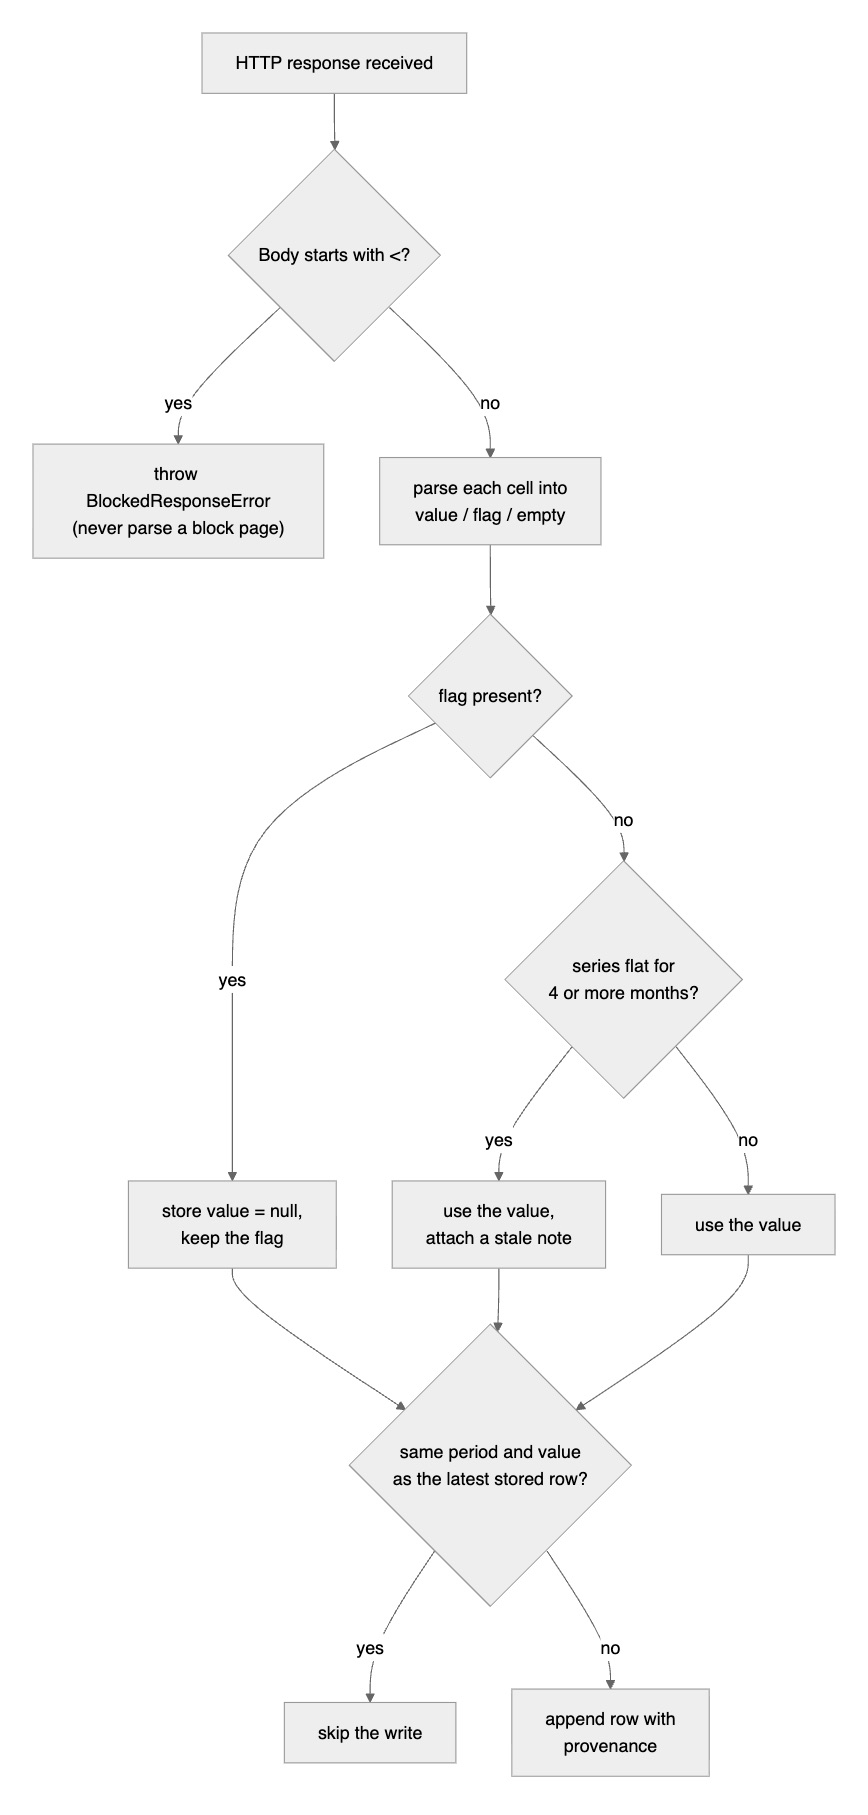
Evidence. The crosswalk API returned JSON on one day and an HTML 403 page two days later, for the same request and with no code change on our side. The main website of the price index publisher sits behind bot protection that rejects scripted clients even with a browser user agent, while its separate API host answers normally. A JSON parser fed an HTML page throws a confusing syntax error at best; a lenient CSV or table parser may return an empty result and let the run "succeed".
Defense. Sniff the start of the body before parsing, and fail with an error that names the likely cause.
export function detectBlockedResponse(bodyText: string): string | null {
  const head = bodyText.slice(0, 1500);
  if (/^\s*</.test(head)) {
    if (/access denied/i.test(head)) return 'Access Denied (Akamai style block page)';
    if (/cloudflare/i.test(head)) return 'Cloudflare block page';
    if (/403 forbidden/i.test(head)) return 'nginx 403 block page';
    return 'HTML response where JSON was expected';
  }
  return null;
}
Both parsers in the ingest Worker, for the price index and for the benchmark, call this function before touching the body and throw a BlockedResponseError when it returns a reason. The run fails, nothing is written, and the previous data stays in place.
3. Price Indexes Cannot Be Compared by Their Levels
Claim. Two price index series can only be compared through their own growth over the same window.
Evidence. In January 2019, the national producer price index for ready mixed concrete stood at 277.4, while the four regional series stood between 121.0 and 127.5. Dividing a regional level by the national level gives a factor of roughly 0.45, which would suggest concrete in the South costs less than half the national price. The gap reflects different base periods, and even with identical base periods, the level of an index encodes growth relative to its own base. Levels from different series do not describe relative prices.
Defense. Anchor material cost in a real dollar figure, then move it with growth ratios. The 2022 benchmark reports the national value of ready-mix concrete shipped and the quantity shipped. Their ratio is $110.02 per cubic yard. That anchor is moved forward with the ratio of annual average national index values. A region's factor is its own growth divided by national growth over the same window, so each series is only ever compared with itself.
export function yoyGrowth(points: readonly IndexPoint[], anchorYear: string, currentYear: string): GrowthResult {
  const anchorAverage = annualAverage(points, anchorYear);
  const currentAverage = annualAverage(points, currentYear); // partial year allowed
  const ratio = currentAverage / anchorAverage;
  return { anchorYear, currentYear, anchorAverage, currentAverage, ratio, pct: (ratio - 1) * 100 };
}

export function extrapolateMaterialPerCuYd(baseline: MaterialBaseline, nationalPoints: readonly IndexPoint[], anchorYear: string, currentYear: string) {
  const growth = yoyGrowth(nationalPoints, anchorYear, currentYear);
  return { baseline, growth, value: baseline.pricePerCuYd * growth.ratio };
}

export function computeRegionFactor(region: Region, regionPoints: readonly IndexPoint[], nationalPoints: readonly IndexPoint[], anchorYear: string, currentYear: string) {
  const regionGrowth = yoyGrowth(regionPoints, anchorYear, currentYear);
  const nationalGrowth = yoyGrowth(nationalPoints, anchorYear, currentYear);
  const freshness = assessFreshness(regionPoints);
  return { region, regionGrowth, nationalGrowth, factor: regionGrowth.ratio / nationalGrowth.ratio, freshness };
}
With the 2022 annual average as anchor and the 2026 average through August as the current value, the national figure comes to $132.33 per cubic yard. That figure is the base of the national estimate for what ready-mix concrete costs per yard, which adds a 3 percent waste allowance and the regional factor. A unit test pins it. A second test asserts that the tempting alternative, annual average to latest month, does not reproduce it. The two methods differ by less than a percentage point here, and the test exists so that nobody switches methods silently and mixes two windows inside one pricing chain.
4. A Series Can Stop Updating Without Saying So
Claim. A monthly series that repeats the same value for several months should be treated as possibly stale, and the decision about what to do with it should be explicit.
Evidence. Over 92 months of data, the national series and the Midwest and South regional series changed value in 23 of the last 24 months, and their longest run of identical values was one or two months. The Northeast series held the same value for six consecutive months, March through August 2026, and changed only 9 times in 24 months. The West series held for five months, April through August 2026.
Defense. Measure the longest flat run and compare it with a threshold placed between the two observed populations. Normal series topped out at two months; the anomalous ones started at five. A threshold of four months separates them with a margin on both sides.
export const FRESHNESS_STALE_THRESHOLD_MONTHS = 4;

export function assessFreshness(points: readonly IndexPoint[]): FreshnessReport {
  if (points.length === 0) throw new Error('assessFreshness: empty series');
  const sorted = [...points].sort((a, b) => pointYm(a).localeCompare(pointYm(b)));

  let longestFlatRunMonths = 1;
  let currentRun = 1;
  let flatRunRange: string | null = null;
  for (let i = 1; i < sorted.length; i++) {
    if (sorted[i].value === sorted[i - 1].value) {
      currentRun++;
      if (currentRun > longestFlatRunMonths) {
        longestFlatRunMonths = currentRun;
        flatRunRange = `${pointYm(sorted[i - currentRun + 1])}..${pointYm(sorted[i])}`;
      }
    } else {
      currentRun = 1;
    }
  }

  const last24 = sorted.slice(-24);
  let changesInLast24Months = 0;
  for (let i = 1; i < last24.length; i++) {
    if (last24[i].value !== last24[i - 1].value) changesInLast24Months++;
  }

  return {
    longestFlatRunMonths,
    flatRunRange,
    changesInLast24Months,
    isStale: longestFlatRunMonths >= FRESHNESS_STALE_THRESHOLD_MONTHS,
  };
}
What to do with a stale series is a policy question. Rejecting it would leave the region with no material signal at all, because the benchmark is withheld below the national level for confidentiality (state queries come back as HTTP 204 with no body). The region would fall back to the national value, which is precisely the "national average with a local label" behavior the product exists to avoid. We therefore keep the value and attach a note to its provenance so the interface can say the source series has not moved. Figure 2 summarizes the decisions taken for each data point across sources.
5. Coverage Gaps Need Explicit Fallbacks
Claim. When a dataset does not cover every entity, the fallback should be ordered, recorded on the value, and loud when exhausted.
Evidence. The wage survey reports wages for cement masons and concrete finishers in 336 of the 393 metro areas, which is 85.5 percent. The union of three related occupations covers all 393. The crosswalk has 47,629 rows for 39,472 distinct ZIP codes, because a ZIP that spans several metros is split into one row per metro, each with a share of addresses.
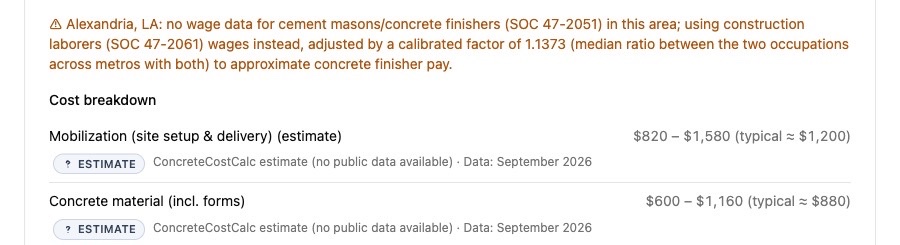
Defense. For wages, try occupation codes in a fixed order and stop the build if none has a value. The fallback reason is stored on the value. In the cost model, a substitute wage is scaled by the median ratio between the two occupations across metros that report both (1.1373 for construction laborers), and its provenance level drops from sourced to calibrated.
export const TARGET_OCC_CODES = ['47-2051', '47-2061', '47-1011'] as const;

export function resolveWage(area: string, rows: readonly MetroWageRow[]): WageResolution {
  for (const occCode of TARGET_OCC_CODES) {
    const row = rows.find((r) => r.occCode === occCode && r.hMean != null);
    if (row) return { occCode, hMean: row.hMean as number, hPct25: row.hPct25, hPct75: row.hPct75, totEmp: row.totEmp };
  }
  // Coverage changed since it was last measured. Publishing a metro with no wage is worse than failing.
  throw new Error(`resolveWage: metro ${area} has no usable mean wage in ${TARGET_OCC_CODES.join(', ')}`);
}
For ZIP codes, every row is kept, and exactly one per ZIP is marked primary: the row with the largest share. Only three ZIP codes in the current file have a tie, and they are resolved by order of appearance, which is deterministic. Keeping the secondary rows costs little and leaves room for weighted pricing later.
export function markPrimaryRows(rows: ZipMetroRow[]): ZipMetroRow[] {
  const bestByZip = new Map<string, ZipMetroRow>();
  for (const row of rows) {
    const current = bestByZip.get(row.zip);
    if (!current || (row.totRatio ?? -Infinity) > (current.totRatio ?? -Infinity)) {
      bestByZip.set(row.zip, row);
    }
  }
  const primarySet = new Set(bestByZip.values());
  return rows.map((row) => ({ ...row, isPrimary: primarySet.has(row) }));
}
The national wage is also a derived figure. The survey's metro files contain no national row, so the national benchmark is the employment weighted mean across the 393 metros, and its provenance says so explicitly. Presenting it as a figure published by the survey would be inaccurate.
Provenance Travels With the Value
Every parameter in the cost model is a Tracked value: a number plus a provenance record.
export type ParamLevel = 'sourced' | 'calibrated' | 'assumed';
export type GeoLevel = 'metro' | 'state' | 'region' | 'national';

export interface Provenance {
  level: ParamLevel;
  source: string;          // the dataset name
  ref?: string;            // occupation code or series identifier
  asOf: string;            // the period the data describes, such as '2025-05'
  geo?: GeoLevel;          // the level at which the value actually applies
  fellBackFrom?: GeoLevel; // set whenever a fallback happened
  note?: string;           // e.g. the substitute occupation or a stale series
}

export interface Tracked<T = number> {
  value: T;
  prov: Provenance;
}
The three levels have strict meanings. sourced means the value is a published figure or a mechanical function of published figures. calibrated means a multiplier or substitute chosen by us and checked against outside evidence. assumed means no public data exists and the value is our estimate. The levels exist partly for honesty and partly for compliance: the terms of use for the source data require that modified figures not be presented as if they came straight from the publisher.
Figure 3 shows the result for a metro that uses the substitute occupation. The fallback notice appears next to the price, and each line of the breakdown carries its level.
The Write Path
Two properties matter on the write side: a run that changes nothing should write nothing, and every stored row should be traceable to its origin.
The ingest Worker keeps material baselines as an append-only history. Before inserting, it loads the latest stored row for each series and keeps only rows whose period or value differ.
export function selectRowsToWrite(
  newRows: readonly MaterialBaselineRow[],
  existingLatest: ReadonlyMap<string, Pick<MaterialBaselineRow, 'period' | 'value'>>,
): MaterialBaselineRow[] {
  return newRows.filter((row) => {
    const existing = existingLatest.get(rowSeriesKey(row));
    if (!existing) return true; // first time this series is seen
    return existing.period !== row.period || existing.value !== row.value;
  });
}
This makes the monthly cron safe to run more often than the data changes. In practice, the regional series change less often than monthly, so many runs end with zero rows written, and the log line records how many were skipped.
For traceability, the original wage archive is never stored in the database. Instead each row records the source file name, the publication date and the SHA 256 digest of the archive, which is enough to identify the exact input later. The CLI writes wage rows with INSERT OR REPLACE on a unique key of metro, occupation, and year, and replaces the crosswalk table as a whole because each crosswalk file is a complete snapshot. Rerunning either import produces the same table.
One operational lesson belongs here as well. When syncing the local database to the remote one, a full export would have overwritten the remote material table, which held six rows produced by the Worker, with the local copy, which held none. Tables owned by different writers have to be pushed one at a time.
Discussion
Annotate or reject. The pipeline consistently keeps imperfect data and labels it, with one exception: it refuses to publish a metro with no usable wage at all. The reasoning is that a labeled approximation is more useful to the reader than a silent national fallback, as long as the label reaches the screen. When nothing usable exists, failing the build is the only honest option.
Where to parse. Moving the wage survey parse out of the Worker costs some automation, since a person has to download the annual file. In exchange, the Worker stays small, and the heavy parse runs where memory is cheap. The annual cadence makes the manual step acceptable.
Tests as specifications. Several of the decisions above are encoded as tests with real recorded responses: the $132.33 anchor, the rejection of the latest-month method, the staleness threshold, and the three-state cell parser. These tests document the reasoning as much as they guard against regressions.
Limitations
The wage data describes May of the reference year and is published about a year later, and it is a three-year rolling estimate. Material prices are national with four regional factors, a much coarser resolution than labor. The material anchor is from 2022 and relies on the price index for everything since. About 4 in 10 ZIP codes fall outside the 393 metro areas and receive national figures. The fixed setup cost in each estimate has no public data source and is labeled as an estimate.
Conclusion
Public statistical data is a sound foundation for local pricing, provided the pipeline treats every source as capable of failing quietly. The five defenses described here, three state cells, body sniffing, growth-based index comparison, staleness detection, and ordered fallbacks, share one design rule: each condition becomes data, and that data stays attached to the value until a person can see it. The cost model, its tests, and a sample rate file are published as the open-source cost model under the MIT license.
Opinions expressed by DZone contributors are their own.