Understanding Android Garbage Collection Logs
If your app creates a lot of objects, then the Android run time (ART) environment will trigger garbage collection (GC) frequently. Here's how to deal with it.
Join the DZone community and get the full member experience.
Join For FreeMemory utilization on the mobile app has a significant impact on customer experience. If your app creates a lot of objects, then the Android run time (ART) environment will trigger garbage collection (GC) frequently. Android garbage collection is an automatic process which removes unused objects from memory. However, frequent garbage collection consumes a lot of CPU, and it will also pause the app. Frequent pauses can jank the app (i.e. stuttering, juddering, or halting).
Thus, you need to understand how many objects your app is creating, how frequently garbage collection is triggered, how much time it takes to complete, and how much memory is reclaimed after every event. All this information is present in the runtime log messages. Whenever a GC event runs, a log line is printed in the runtime log messages. You can view those log lines through logcat.
This is how a typical ART GC log line will look:
07-01 16:00:44.690: I/art(801): Explicit concurrent mark sweep GC freed 65595(3MB) AllocSpace objects, 9(4MB) LOS objects, 34% free, 38MB/58MB, paused 1.195ms total 87.219msThis one single log line has multiple fields. Let’s review them:

| # | Field | Value | Description |
| 1 | Timestamp | 07-01 16:00:44.690 | Timestamp at which this garbage collection event ran. |
| 2 | GC Reason | Explicit | Reason why garbage collection event was triggered. ‘Explicit’ indicates that garbage collection was explicitly requested by an app, for example, by calling gc() or gc(). Please refer here for different types of GC Reasons. |
| 3 | GC Name | concurrent mark sweep | ART has various different GCs which can get run. In this case, ‘Concurrent Mark Sweep’ indicates – a whole heap collector which frees collects all spaces other than the image space. Please refer here for different types of GC Names. |
| 4 | Objects freed | 65595(3MB) | Amount of objects garbage collected from non-large objects space. Totally 65595 unique objects, whose cumulative size of 3mb is garbage collected (i.e. freed) in this event. |
| 5 | Large objects freed | 9(4MB) | Amount of objects garbage collected from Large objects space. Totally 9 unique objects, whose cumulative size of 4mb is garbage collected (i.e. freed) |
| 6 | Heap usage | 38MB/58MB | 38mb of objects is alive after this particular GC event. Total allocated heap size for this application is 58mb. |
| 7 | GC Pause Time | 1.195ms | During certain phases of GC event, the application is paused. In this GC event, pause time is 1.195ms. During pause time, application freezes. One should target for low pause time. |
| 8 | GC Total Time | 87.219ms | Amount of time this GC event took to complete. It includes the GC Pause time as well. |
Tools

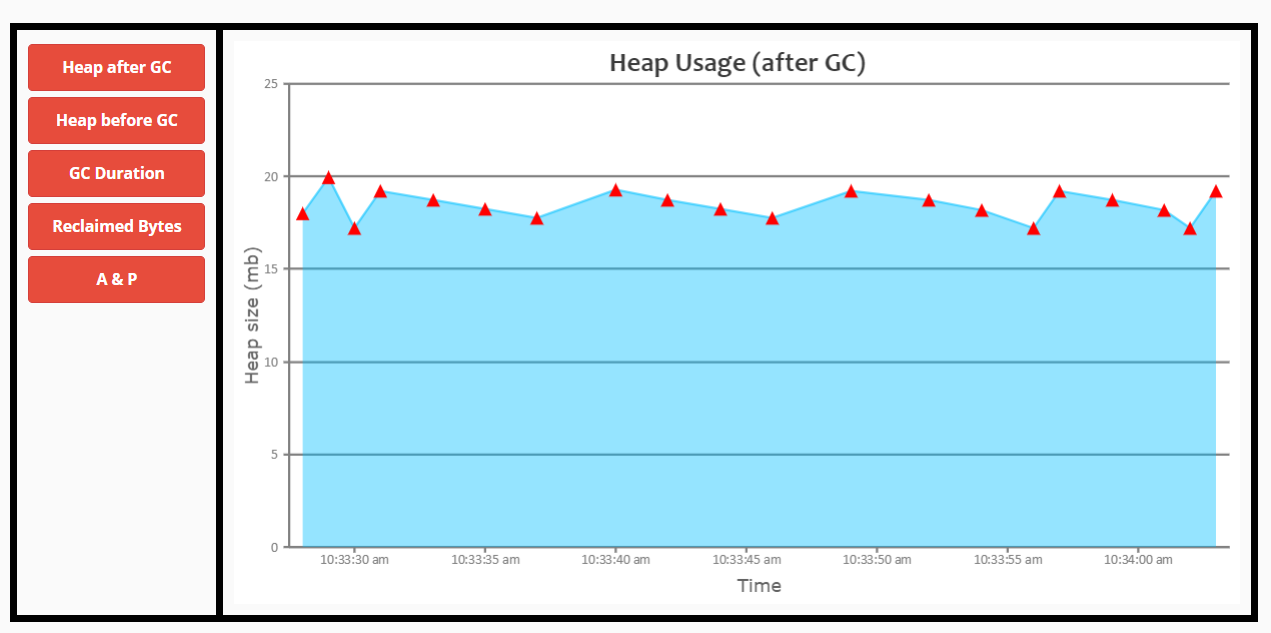
Figure 1: Android memory usage – report generated by GCeasy.io.

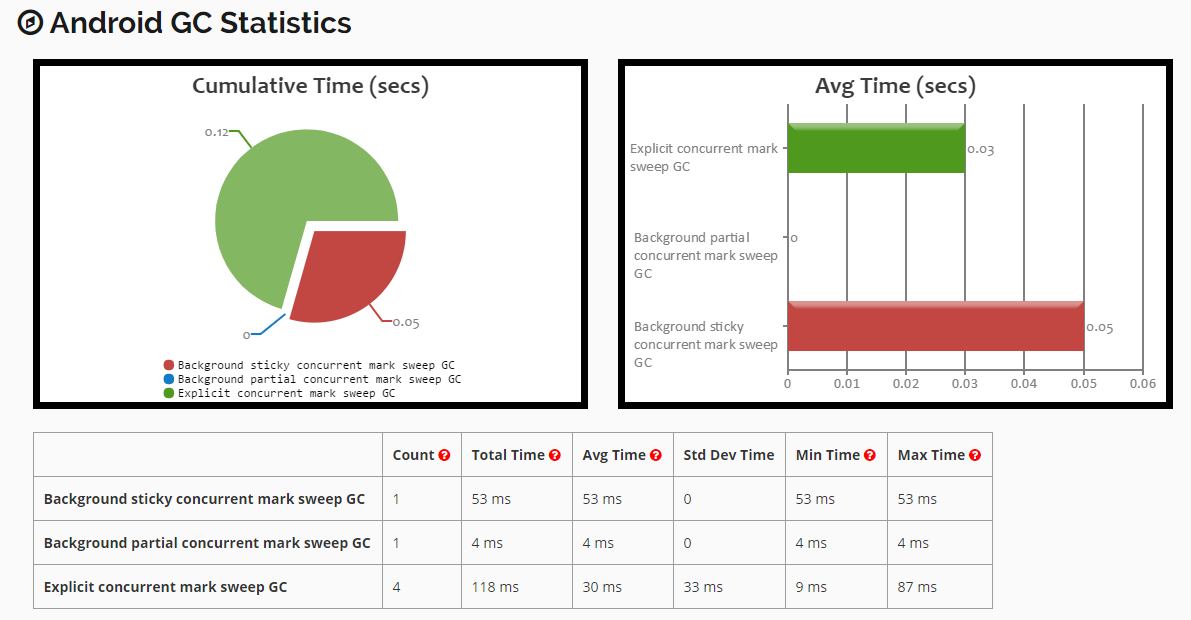
Figure 2: Android GC Statistics — report generated by GCeasy.io.
As it might get tedious to analyze every single GC log line, you can also consider using free online tools such as GCeasy.io, a universal Garbage collection log analyzer, to analyze Android GC logs. You can just upload the Android GC Logs to this tool. The tool parses GC log and generates reports instantly. The report contains interactive graphs and insightful metrics. A few excerpts from this report were given above for your reference.
Opinions expressed by DZone contributors are their own.

Comments