Understanding the Java Garbage Collection Log
To diagnose any memory problems, the Garbage Collection log file is the best place to start. Take a look at the anatomy of a GC log file in this helpful article.
Join the DZone community and get the full member experience.
Join For FreeTo diagnose any memory problems, the Garbage Collection log file is the best place to start. It provides several interesting statistics:
- When the scavenge (or Young generation) GC ran?
- When the full GC ran?
- How many scavenge GCs and Full GCs ran? Did they run repeatedly? In what interval?
- After the GC process ran, how much memory was reclaimed in Young, Old, and Permanent/Metaspace generations?
- How long did the GC run?
- How long did JVM pause when Full GC run?
- What was the total allocated memory in each generation?
- How many objects were promoted to old generation?
How to Generate GC Log File?
In order to understand the GC log, you first need to generate one. Passing the following system properties to your JVM would generate GC logs.
-XX:+PrintGCDetails -XX:+PrintGCDateStamps -Xloggc:<file-path>

where file-path: Garbage Collection log file path.
Example:
-XX:+PrintGCDetails -XX:+PrintGCDateStamps -Xloggc:/opt/app/gc.log-XX:+PrintGCDateStamps would print the absolute time stamp in the log statement (i.e. “2014-11-18T16:39:25.303-0800”).
-XX:+PrintGCDetails property would print the details of how much memory is reclaimed in each generation.
Passing the above system properties would generate a Garbage Collection log file that would look like:
2014-11-18T16:39:25.512-0800: 76.592: [Full GC [PSYoungGen: 26560K->0K(233024K)] [PSOldGen: 632024K->658428K(699072K)] 658584K->658428K(932096K) [PSPermGen: 2379K->2379K(21248K)], 3.0978612 secs] [Times: user=3.09 sys=0.00, real=3.10 secs]

2014-11-18T16:39:31.536-0800: 82.616: [Full GC [PSYoungGen: 116544K->0K(233024K)] [PSOldGen: 658428K->684832K(699072K)] 774972K->684832K(932096K) [PSPermGen: 2379K->2379K(21248K)], 3.2582136 secs] [Times: user=3.23 sys=0.03, real=3.26 secs]

2014-11-18T16:39:37.728-0800: 88.808: [Full GC [PSYoungGen: 116544K->12164K(233024K)] [PSOldGen: 684832K->699071K(699072K)] 801376K->711236K(932096K) [PSPermGen: 2379K->2379K(21248K)], 3.4230220 secs] [Times: user=3.40 sys=0.02, real=3.42 secs]
:
:
Heap
 PSYoungGen total 233024K, used 116544K [0x00000000eaab0000, 0x0000000100000000, 0x0000000100000000)
 eden space 116544K, 100% used [0x00000000eaab0000,0x00000000f1c80000,0x00000000f1c80000)
 from space 116480K, 0% used [0x00000000f1c80000,0x00000000f1c80000,0x00000000f8e40000)
 to space 116480K, 0% used [0x00000000f8e40000,0x00000000f8e40000,0x0000000100000000)
 PSOldGen total 699072K, used 699071K [0x00000000c0000000, 0x00000000eaab0000, 0x00000000eaab0000)
 object space 699072K, 99% used [0x00000000c0000000,0x00000000eaaafff0,0x00000000eaab0000)
 PSPermGen total 21248K, used 2409K [0x00000000bae00000, 0x00000000bc2c0000, 0x00000000c0000000)
 object space 21248K, 11% used [0x00000000bae00000,0x00000000bb05a740,0x00000000bc2c0000)
Anatomy of GC Log Statement
2014-11-18T16:39:37.728-0800: 88.808: [Full GC [PSYoungGen: 116544K->12164K(233024K)] [PSOldGen: 684832K->699071K(699072K)] 801376K->711236K(932096K) [PSPermGen: 2379K->2379K(21248K)], 3.4230220 secs] [Times: user=3.40 sys=0.02, real=3.42 secs]
Let’s pick apart this log statement and examine each field in it:
2014-11-18T16:39:37.728-0800 – Time stamp at which GC ran.
Full GC – Type of GC. It could be either ‘Full GC’ or ‘GC’.
[PSYoungGen: 116544K->12164K(233024K)] – After the GC ran the young generation, space came down from 116544k (i.e. 113mb) to 12164k (i.e. 12mb). Total allocated young generation space is 233024k (i.e.227mb).
[PSOldGen: 684832K->699071K(699072K)] – After the GC ran the old generation space increased from 684832k (i.e. 669mb) to 699071k (i.e. 682mb) and total allocated old generation space is 669072k (i.e. 682mb). In this case after the GC event, old generation's space increased and didn't decrease, which isn't the case always. Here size has increased because all objects in Old generation are actively referenced + objects from young generation are promoted to old generation. Thus you are seeing the increase in the old generation size.
801376K->711236K(932096K) – After the GC ran, overall memory came down from 801376k to 711236k. Total allocated memory space is 932096k (i.e. 910mb).
[PSPermGen: 2379K->2379K(21248K)] – After the GC ran, there was no drop in perm generation space.
3.4230220 secs – the GC took 3.42 seconds to complete.
[Times: user=3.40 sys=0.02, real=3.42 secs] – Real is wall clock time (time from start to finish of the call). This is all elapsed time including time slices used by other processes and time the process spends blocked (for example if it is waiting for I/O to complete).
User is the amount of CPU time spent in user-mode code (outside the kernel) within the process. This is only actual CPU time used in executing the process. Other processes, and the time the process spends blocked, do not count towards this figure.
Sys is the amount of CPU time spent in the kernel within the process. This means executing CPU time spent in system calls within the kernel, as opposed to library code, which is still running in user-space. Like user, this is only CPU time used by the process.
In your case, if the CPU time (3.4 sec) is considerably higher than the real time passed (3.42 Sec), we can conclude that the GC was run using multiple threads. To learn more about the difference between each of these Times, please check out this article.
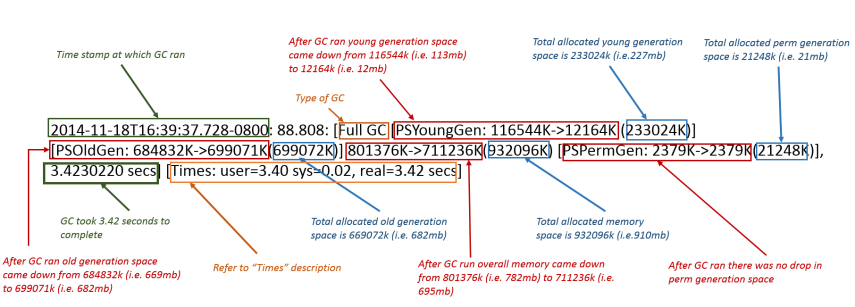
Fig: Anatomy of a Garbage Collection Log Statement
Tools to Analyze GC Logs
Depending on the JVM version and the GC algorithm that you use, the GC log format will differ. I have seen 30+ different version of GC logs. It’s tedious to analyze GC logs in a text editor. I highly recommend using http://gceasy.io/ - a universal online Garbage collection analysis tool. It's a free tool that analyzes the Garbage collection logs and provides telemetrics, potential Garbage Collection problems, and Memory problems, and it provides solutions to these problems, as well.
Opinions expressed by DZone contributors are their own.
Comments