Understanding Postgres Connection Pooling With PgBouncer
Take a quick look at understanding Postgres connection pooling with PgBouncer and explore 5 different settings related to limiting connection count.
Join the DZone community and get the full member experience.
Join For FreePgBouncer Internals
PgBouncer is a connections pooling service for Postgres. It has all kinds of internal limits and limited resources. So here’s how it looks from the client’s, say, web-application point of view:
- Client connects to PbBouncer.
- Client makes SQL request/query/transaction
- Gets a response.
- Repeat steps 2–3 as many times as needed.
Here’s the client’s connection states diagram:

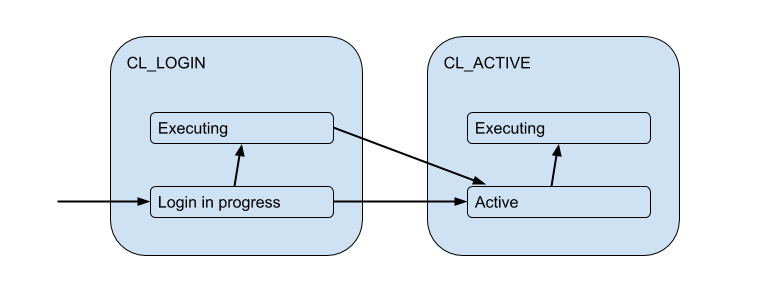
During a LOGIN phaze/state (CL_ stands for client) Pgbouncer might authorize a client based on some local info (such as auth_file, certificates, PAM or hba files), or in a remote way — with auth_query in a database. Thus a client connection while logging in might need and be executing a query. Let’s show that as Executing substate:

But CL_ACTIVEqueries also might be actually executing some queries and so linked to actual database server connections by PgBouncer, or idling, doing nothing. This linking/matching of the clients and server connections is the whole raison d’etre of PgBouncer. PgBouncer links those clients with server only for some time, depending on pool_mode — either for a session, transaction or just one request.
As transaction pooling is the most common, we’ll assume it for the rest of this post
So the client, while being in cl_active state, actually might be or might not be linked to a server connection. To account for that we split this state in two: active and active-linked/executing. So here’s a new diagram:
These server connections, that clients get linked to, are “pooled” — limited in number and reused. Because of that, it might occur that while the client sends some requests (beginning a transaction or performing a query), a corresponding server connection pool is exhausted, i.e. pgbouncer opened as many connections as were allowed it, and all of them are occupied by (linked to) some other clients. PgBouncer, in this scenario, puts the client into a queue, and this client’s connection goes to a CL_WAITING state. This might happen as well while the client is only logging in, so there’s CL_WAITING_LOGIN for that also:

On the other end, there are these server connections: from PgBouncer to the actual database. Those have respectful states: SV_LOGIN for when authorizing, SV_ACTIVE for when it’s linked with (and used or not by) the client’s connections or if it’s free — SV_IDLE.
PgBouncer has an administration interface available through a connection to a special "virtual" database named pgbouncer. There are a number of SHOWcommands in it, one of those — SHOW POOLS — will show the number of connections in each state for each pool:
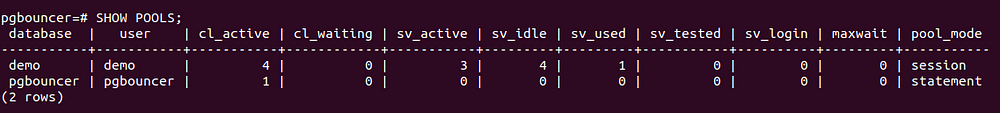
We see here 4 client’s connections opened, all of them — cl_active. And 5 server connections: 4 — sv_active an one is insv_used. Here’s a nice write up on how to monitor these states. But basically you would want to track them in any way you do monitoring, so you’ll have a historical picture.
Pool Size
It’s not a that simple, PgBouncer has 5 different settings related to limiting connection count!
- You can specify
pool_sizefor each proxied database. If not set, it defaults todefault_pool_sizesetting, which again by default has a value of20. max_db_connectionsis exactly suitable for covering this problem — it limits the total number of connections to any database, so badly behaving clients won’t be able to create too many Postgres backends.reserve_pool_size— is a limit on an additional, reserve pool, which kicks in if a regular pool is exhausted, i.e. there arepool_sizeopen server connections. As I understand it was designed to help serve a burst of clients.max_user_connections— this limits the total number of conns to any database from one user. From my point of view, it’s a very strange limit, it makes sense only in the case of multiple databases with the same users.max_client_conn— limits the total number of incoming clients connections. It differs frommax_user_connectionsbecause it includes connections from any user.
Pgbouncer’s administration interface database besides SHOW POOLS has also SHOW DATABASES command, that shows actually applied limits and all configured and currently present pools:

So dividing current_connections by pool_size will give you pool utilization, so you can trigger an alert if it goes somewhere close to 100%.
PgBouncer also provides SHOW STATS command, that provides stats (not a surprise, I know) on requests and traffic for every proxied database:
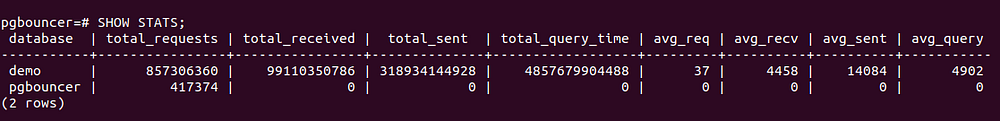
Here, for the purpose of measuring pool utilization, we are mostly interested in total_query_time — the total number of microseconds spent by pgbouncer when actively connected to PostgreSQL, executing queries. Dividing this by respectful pool size (considering pool size to be the number of seconds that all the server connections might spent in total serving queries within one wall clock second), we get another measure/estimate of pool utilization; let’s call it “query time utilization.”
Here’s my article on monitoring PgBouncer with USE ans RED monitoring methods.
Why It’s Not Enough to Watch Utilization and You Need Saturation Metric as Well
The problem is that even with cumulative stats like total_query_time, one can’t tell if there were some short periods of high utilization between two moments when we look at the stats. For example, you have some cron jobs configured to simultaneously start and make some queries to a database. If these queries are short enough, i.e. shorter than stats collection period, then measured utilization might still be low, while at these moments of crons start time, they might exhaust the pool. But looking only on Utilization metric, you won’t be able to diagnose that.
How can we track that on PgBouncer? A straightforward (and naive) approach is to count clients in SHOW POOLS output in a cl_waiting state, that we discussed. Under normal circumstances, you won’t see them, and seeing the number of waiting clients greater than 0 means pool saturation.
But as you know, you can only sample SHOW POOLS, and this leads to a possibility of missing such waitings.
Check out my other articles on Postgres and monitoring.
Published at DZone with permission of Pavel T. See the original article here.
Opinions expressed by DZone contributors are their own.
Comments