Using Grafana on Top of Elasticsearch
Grafana is worth exploring because it’s extremely easy to set up and, from a mere usability perspective, Grafana has a much nicer UI and UX.
Join the DZone community and get the full member experience.
Join For Freenow, why would i want to do that?
if i’m using elk, i already have kibana — and since version 5.x , timelion is provided out-of-the-box so i can use that for analyzing time-series data , right?
well, yes and no.
while very similar in terms of what can be done with the data itself within the two tools. the main differences between kibana and grafana lie in configuring how the data is displayed. grafana has richer display features and more options for playing around with how the data is represented in the graphs.
while it takes some time getting accustomed to building graphs in grafana — especially if you’re coming from kibana — the data displayed in grafana dashboards can be read and analyzed more easily.
here are some instructions on setting up the integration with elasticsearch and getting started with your first grafana dashboard.
installing grafana
this article assumes you have an elk stack up and running already, so the first step is to install grafana.
the instructions below are for ubuntu/debian. if you’re using a different os, refer to grafana’s excellent docs here (if you’re using docker, that’s probably the easiest way to get grafana up and running).
to do this, first add the following line to your /etc/apt/sources.list file (don’t worry about the version name, keep it as jessie even if you’re using a more recent version:
deb https://packagecloud.io/grafana/stable/debian/ jessie mainnext, add the package cloud key so you can install a signed package:
curl https://packagecloud.io/gpg.key | sudo apt-key add -update your repos and install grafana with:
sudo apt-get update && sudo apt-get install grafanalast but not least, start grafana:
sudo service grafana-server startopen your browser at http://:3000 and use admin / admin as the credentials to access grafana:
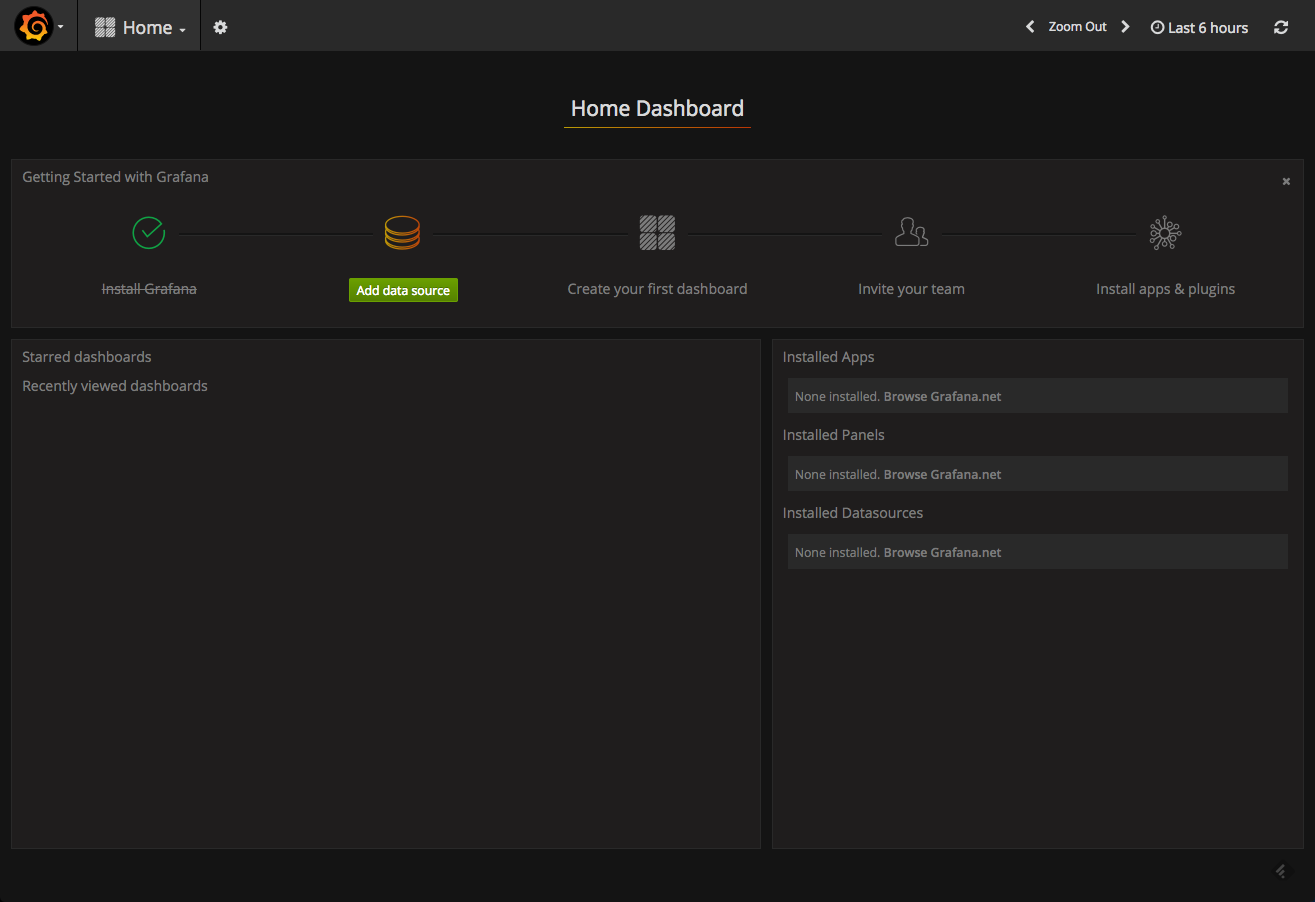
connecting to elasticsearch
once installed, your next step is to set up the integration with a data source — in our case, elasticsearch.
click on the add data source button displayed in your grafana home dashboard, and configure the connection with elasticsearch.
a few pointers.
you will be required to enter the name of the elasticsearch index with which you want to integrate. use this curl on the host on which elasticsearch is installed to get a list of all elasticsearch indices:
curl -xget 'localhost:9200/_cat/indices?v&pretty'an example output:
health status index                 uuid                   pri rep docs.count docs.deleted store.size pri.store.size
yellow open   metricbeat-2017.01.23 vpzuouthqtsxsmo9bescgw   5   1      12309            0      3.4mb          3.4mb
yellow open   .kibana               niq0nucrt1ejxw4-mwhxwg   1   1          2            0     68.2kb         68.2kb
in the http settings section, you will be required to select the type of access to use. just to clarify, in the direct access, the url that you provide is accessed directly from the browser, whereas, in the proxy access, the grafana backend acts as a proxy and routes requests from the browser to elasticsearch.
here are the settings that i used to connect with an elasticsearch installed on an aws ec2 instance:
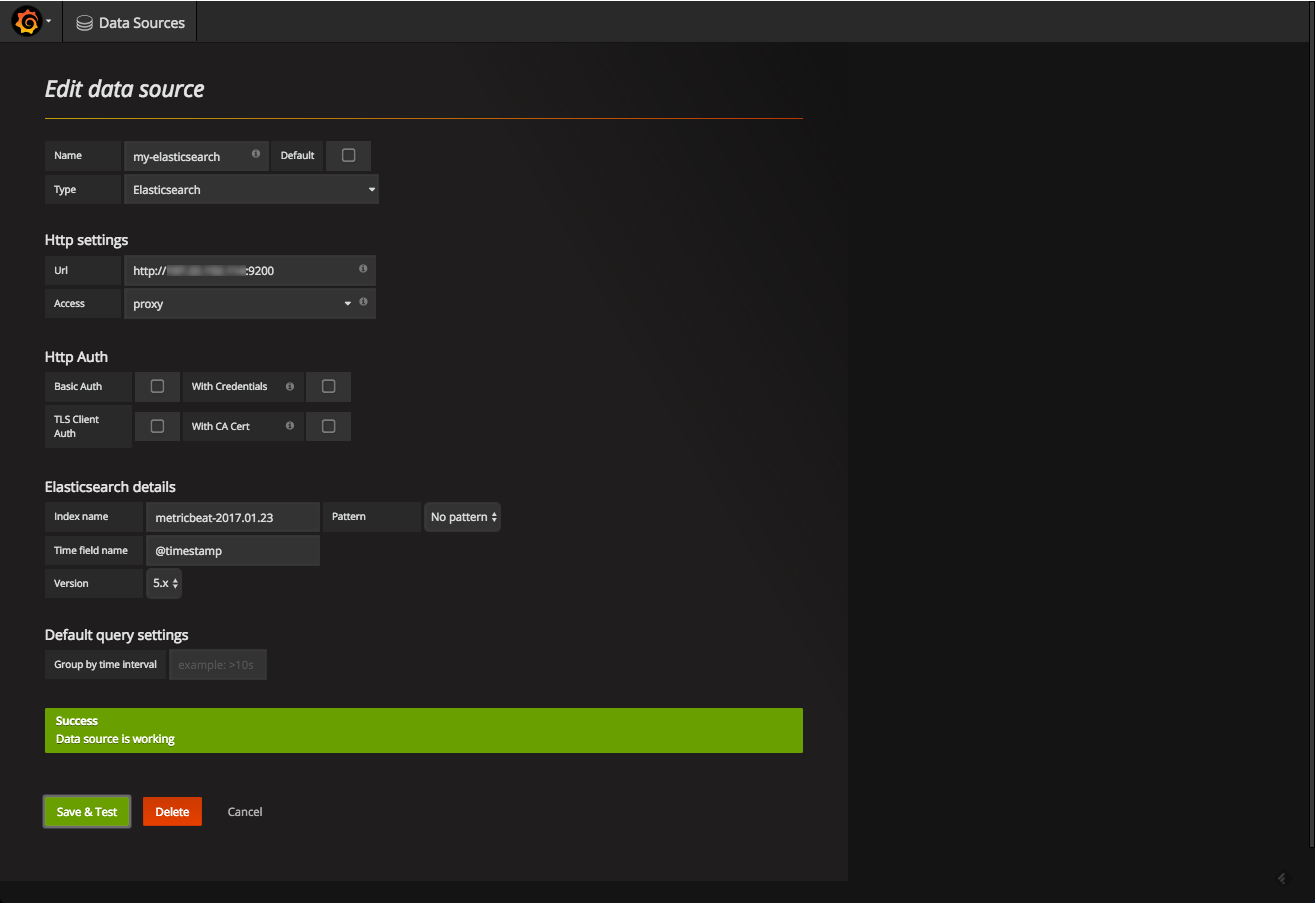
click save & test . a green success message means that elasticsearch was connected successfully.
creating a grafana dashboard
for this tutorial, i defined two data sources for two different elasticsearch indices — one for apache logs shipped using filebeat and the other for server performance metrics to elasticsearch using metricbeat .
we’ll start by creating a new dashboard. this is done by clicking on the grafana icon in the top-left corner and selecting dashboards > new .
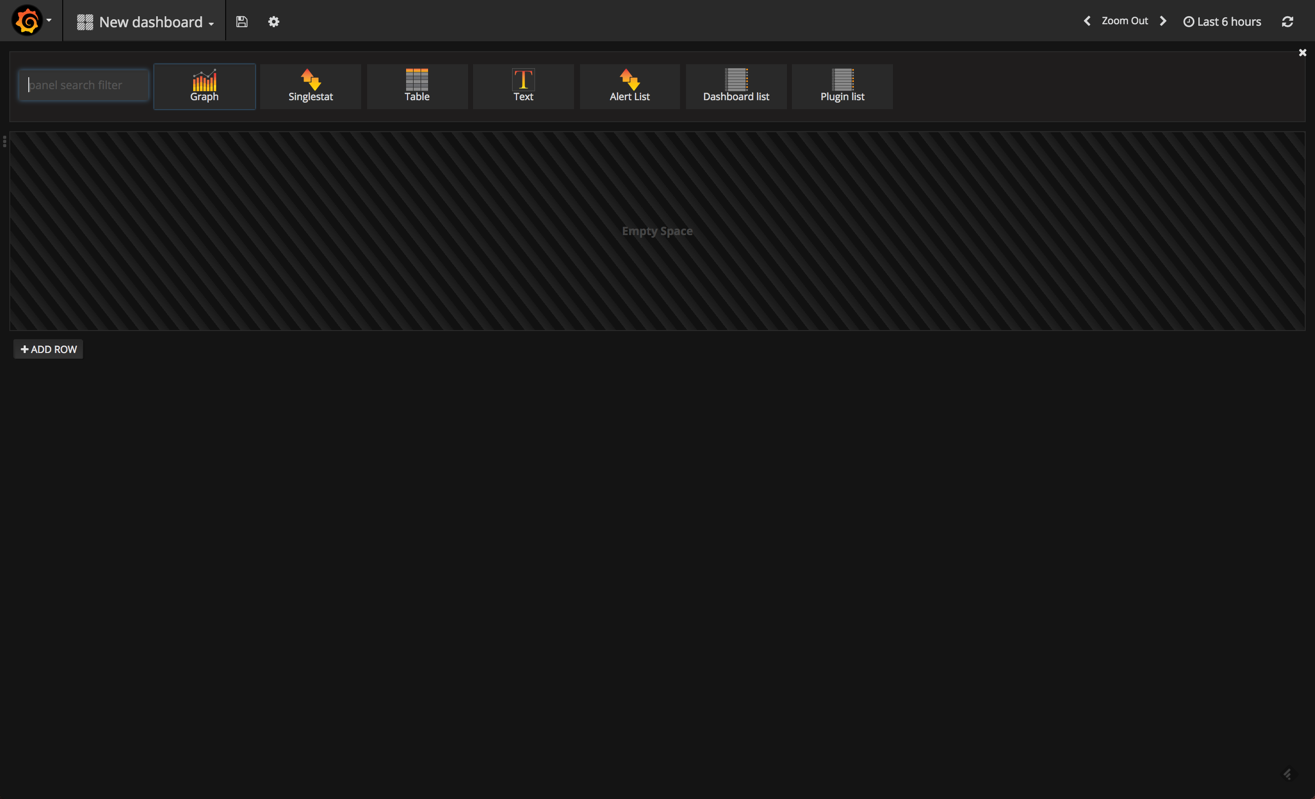
in grafana 4.1, you have the selection of different visualizations — or “panels,” as they are called in grafana — to choose from at the top of the dashboard.
we’re going to select the graph panel, which is the most frequently-used panel type. by default, a nice panel is displayed showing some sort of data over time. don’t get too excited — this is not your elasticsearch data but some fake data source grafana that is using to help us get started.
to edit the graph, you need to click the panel title and then edit .
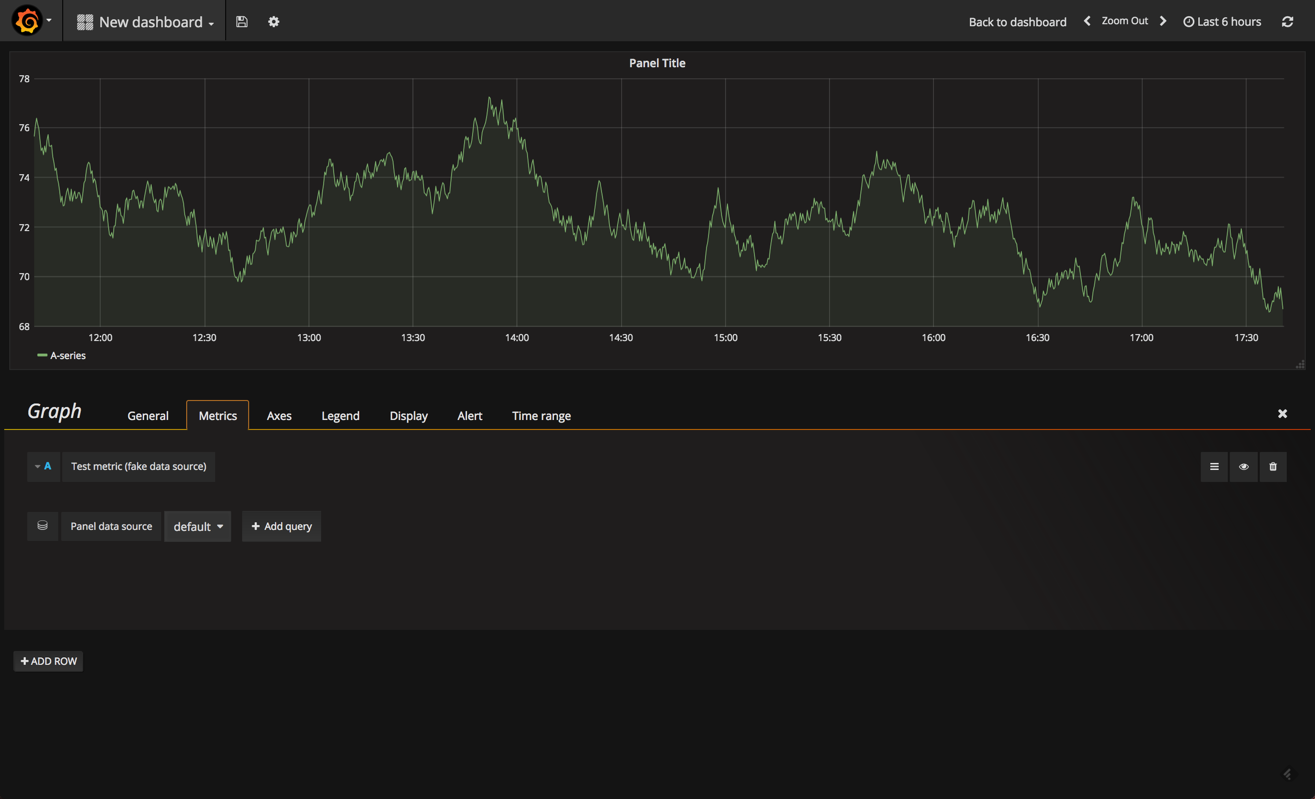
our graph is opened in edit mode, with the metrics tab open. this tab is the most important one because it defines what data to display. of course, and like in kibana, the options on display here will vary based on the data source and data type.
start by removing the fake data source and adding your elasticsearch data source.
then click + add query .
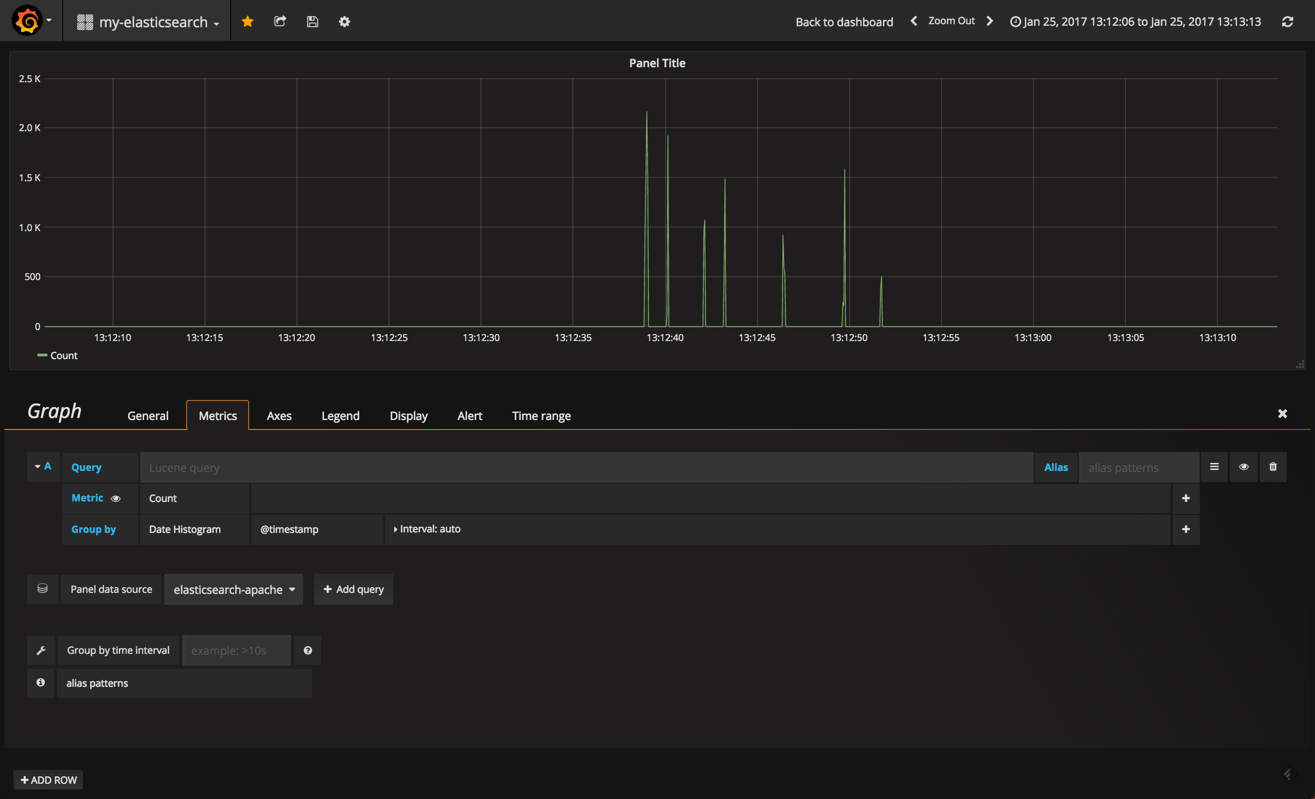
the options for defining what and how the data is to be cut is similar to kibana — in the query field, define your lucene query and then select an aggregation type for both the y (metric) and x (group by) axes.
in the other tabs, the richness in display options comes to the fore.
in the general tab, you define the title and description for the panel. you can also add dynamic links to the panel that can link to other dashboards or urls.
in the axes tab you can play around with the units and scales for the x and y axes and add custom labels for each axis.
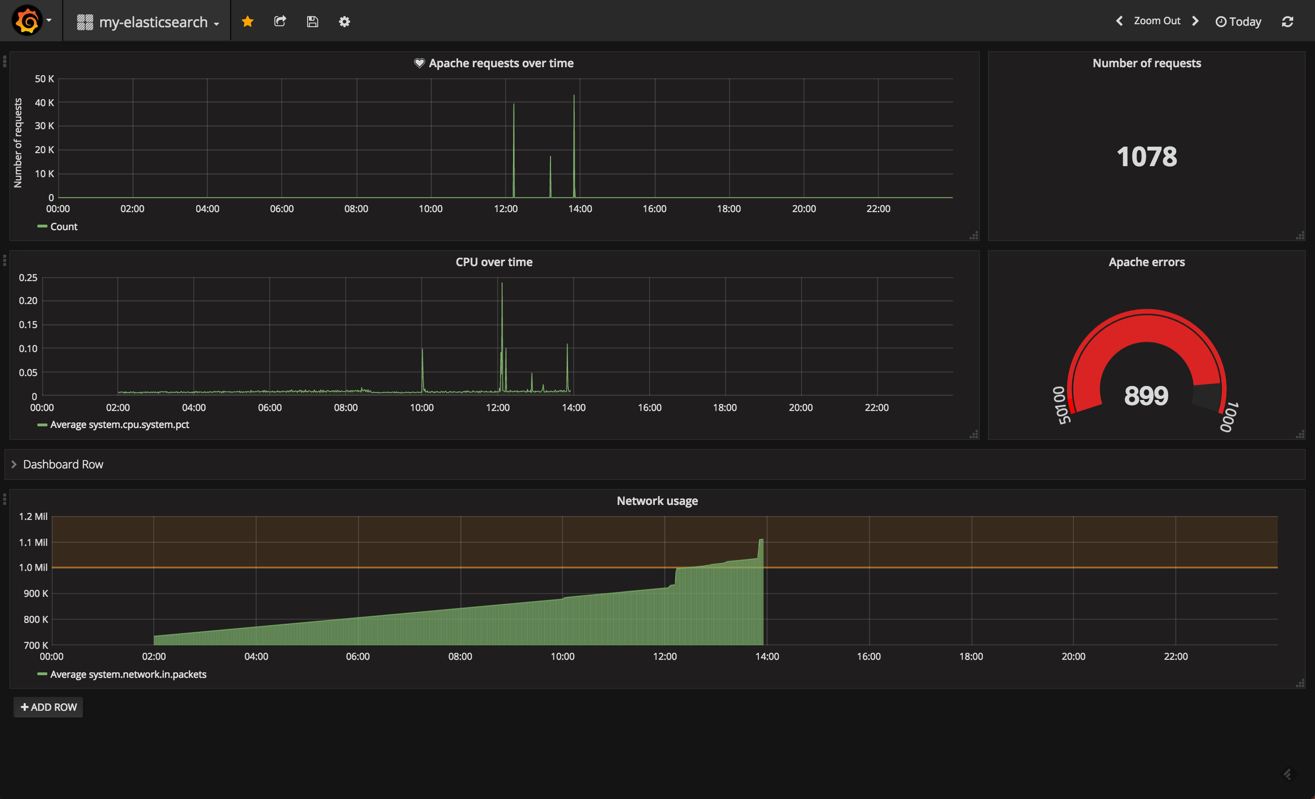
we can continue to build our panels in a similar way. grafana has three main panel types on offer — which is a bit limiting, compared to kibana — but you will find that the three main types (graph, table, single stat) cover most of your monitoring needs.
in no time, you can have a dashboard up and running. here is an example of an apache and server performance monitoring dashboard using the two elasticsearch indices as data sources. of course, you could hook in any other data source that is supported by grafana to create a more comprehensive dashboard:
summary
from a functionality perspective, it’s hard to point out a critical parity between the two tools. so, if you’ve got your own elk up and running, there may be no pressing need of abandoning kibana.
still, grafana is well worth exploring for two main reasons. first, it’s extremely easy to set up. it took me just a matter of minutes to get the integration up and running. second, from a mere usability perspective, grafana has a much nicer ui and ux.
there are some compatibility issues with integrating elasticsearch 5.x that you should be aware of — alerting, one of grafana’s more recent features — does not seem to work well, for example.
if you’re interested in a more detailed comparison between these two great visualization tools, i recommend reading both our high-level comparison and this more technical breakdown by the folks at rittman mead.
Published at DZone with permission of Daniel Berman. See the original article here.
Opinions expressed by DZone contributors are their own.
Comments