Using Machine Learning to Automate Kubernetes Optimization
This article provides an explanation of how machine learning can be used to manage Kubernetes resources efficiently.
Join the DZone community and get the full member experience.
Join For FreeNote: This is the third article of a series covering Kubernetes resource management and optimization. In this article, we explain how machine learning can be used to manage Kubernetes resources efficiently. Previous articles explained Kubernetes resource types and requests and limits.
As Kubernetes has become the de-facto standard for application container orchestration, it has also raised vital questions about optimization strategies and best practices. One of the reasons organizations adopt Kubernetes is to improve efficiency, even while scaling up and down to accommodate changing workloads; however, the same fine-grained control that makes Kubernetes so flexible also makes it challenging to effectively tune and optimize.
In this article, we’ll explain how machine learning can be used to automate the tuning of these resources and ensure efficient scaling for variable workloads.
The Complexities of Optimization
Optimizing applications for Kubernetes is largely a matter of ensuring that the code uses its underlying resources — namely CPU and memory — as efficiently as possible. That means ensuring performance that meets or exceeds service-level objectives at the lowest possible cost and with minimal effort.
When creating a cluster, we can configure the use of two primary resources — memory and CPU — at the container level. Namely, we can set limits as to how much of these resources our application can use and request. We can think of those resource settings as our input variables, and the output in terms of performance, reliability, and resource usage (or cost) of running our application. As the number of containers increases, the number of variables also increases, and with that, the overall complexity of cluster management and system optimization increases exponentially.
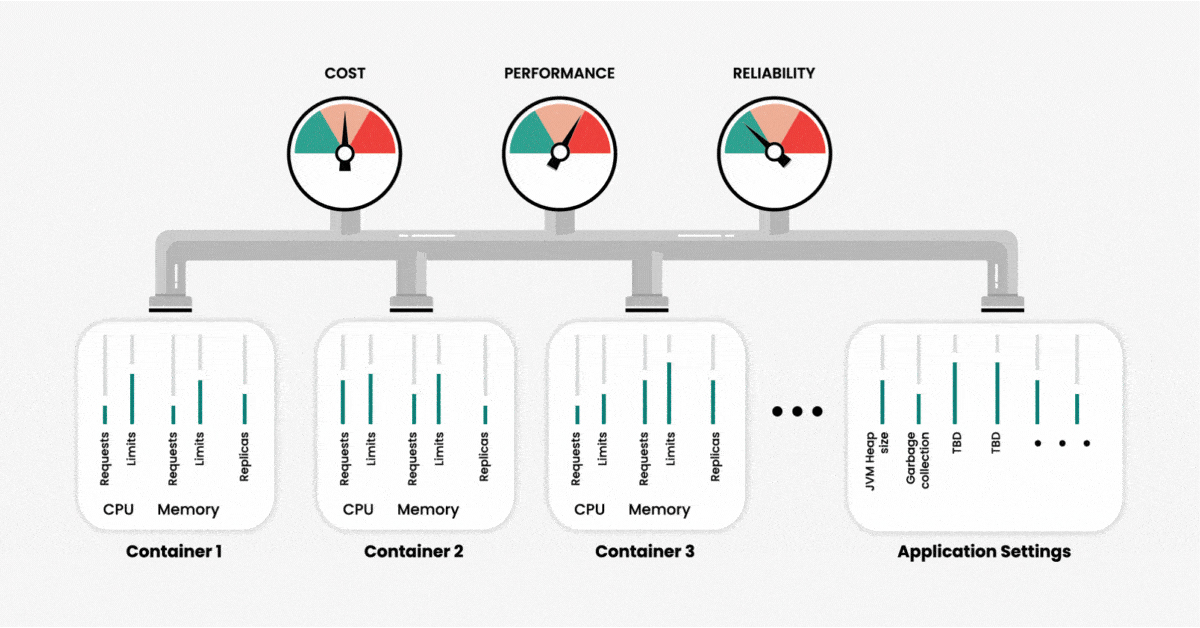
To further complicate matters, different resource parameters are interdependent. Changing one parameter may have unexpected effects on cluster performance and efficiency. This means that manually determining the precise configurations for optimal performance is an impossible task unless you have unlimited time and Kubernetes experts.
If we do not set custom values for resources during the container deployment, Kubernetes automatically assigns these values. The challenge here is that Kubernetes is quite generous with its resources to prevent two situations: service failure due to an out-of-memory (OOM) error and unreasonably slow performance due to CPU throttling. However, using the default configurations to create a cloud-based cluster will result in unreasonably high cloud costs without guaranteeing sufficient performance.
This all becomes even more complex when we seek to manage multiple parameters for several clusters. For optimizing an environment’s worth of metrics, a machine learning system can be an integral addition.
Machine Learning Optimization Approaches
There are two general approaches to machine learning-based optimization, each of which provides value in a different way. First, experimentation-based optimization can be done in a non-prod environment using a variety of scenarios to emulate possible production scenarios. Second, observation-based optimization can be performed either in prod or non-prod by observing actual system behavior. These two approaches are described next.
Experimentation-Based Optimization
Optimizing through experimentation is a powerful, science-based approach because we can try any possible scenario, measure the outcomes, adjust our variables and try again. Since experimentation takes place in a non-prod environment, we’re only limited by the scenarios we can imagine and the time and effort needed to perform these experiments. If experimentation is done manually, the time and effort needed can be overwhelming. That’s where machine learning and automation come in.
Let’s explore how experimentation-based optimization works in practice.
Step 1: Identify the Variables
To set up an experiment, we must first identify which variables (also called parameters) can be tuned. These are typically CPU and memory requests and limits, replicas, and application-specific parameters such as JVM heap size and garbage collection settings.
Some ML optimization solutions can scan your cluster to automatically identify configurable parameters. This scanning process also captures the cluster’s current, or baseline, values as a starting point for our experiment.
Step 2: Set Optimization Goals
Next, you must specify your goals. In other words, which metrics are you trying to minimize or maximize? In general, the goal will consist of multiple metrics representing trade-offs, such as performance versus cost. For example, you may want to maximize throughput while minimizing resource costs.
Some optimization solutions will allow you to apply weighting to each optimization goal, as performance may be more important than cost in some situations and vice versa. Additionally, you may want to specify boundaries for each goal. For instance, you might not want to even consider any scenarios that result in performance below a particular threshold. Providing these guardrails will help to improve the speed and efficiency of the experimentation process.
Here are some considerations for selecting the right metrics for your optimization goals:
- If a containerized application is transaction-based, minimize the response time and the error rate. In this situation, maximum speed is the ideal, and resource use is of less concern.
- If the application is only meant for computations, minimize the error rate. We want to optimize for performance efficiency.
- If the application processes data, speed is likely secondary. Optimize for cost.
Of course, these are just a few examples. Determining the proper metrics to prioritize requires communication between developers and those responsible for business operations. Determine the organization’s primary goals. Then examine how the technology can achieve these goals and what it requires to do so. Finally, establish a plan that emphasizes the metrics that best accommodate the balance of cost and function.
Step 3: Establish Optimization Scenarios
With an experimentation-based approach, we need to establish the scenarios to optimize for and build those scenarios into a load test. This might be a range of expected user traffic or a specific scenario like a retail holiday-based spike in traffic. This performance test will be used during the experimentation process to simulate production load.
Step 4: Run the Experiment
Once we’ve set up our experiment with optimization goals and tunable parameters, we can kick off the experiment. An experiment consists of multiple trials, with your optimization solution iterating through the following steps for each trial:
- The experiment controller runs the containerized application in your cluster using the baseline parameters for the first trial.
- The controller then runs the performance test created previously to apply load to the system for our optimization scenario.
- The controller captures the metrics corresponding to our goals, for example, duration and resource cost.
- The machine learning algorithm analyzes the results and then calculates a new set of parameters for the next trial.
- This process is then repeated for however many trials were specified when configuring your experiment. Typical experiments range from 20 to 200 trials, with more parameters requiring more trials to get a definitive result.
The machine learning engine uses the results of each trial to build a model representing the multidimensional parameter space. In this space, it can examine the parameters in relation to one another. With each iteration, the ML engine moves closer to identifying the configurations that optimize the goal metrics.
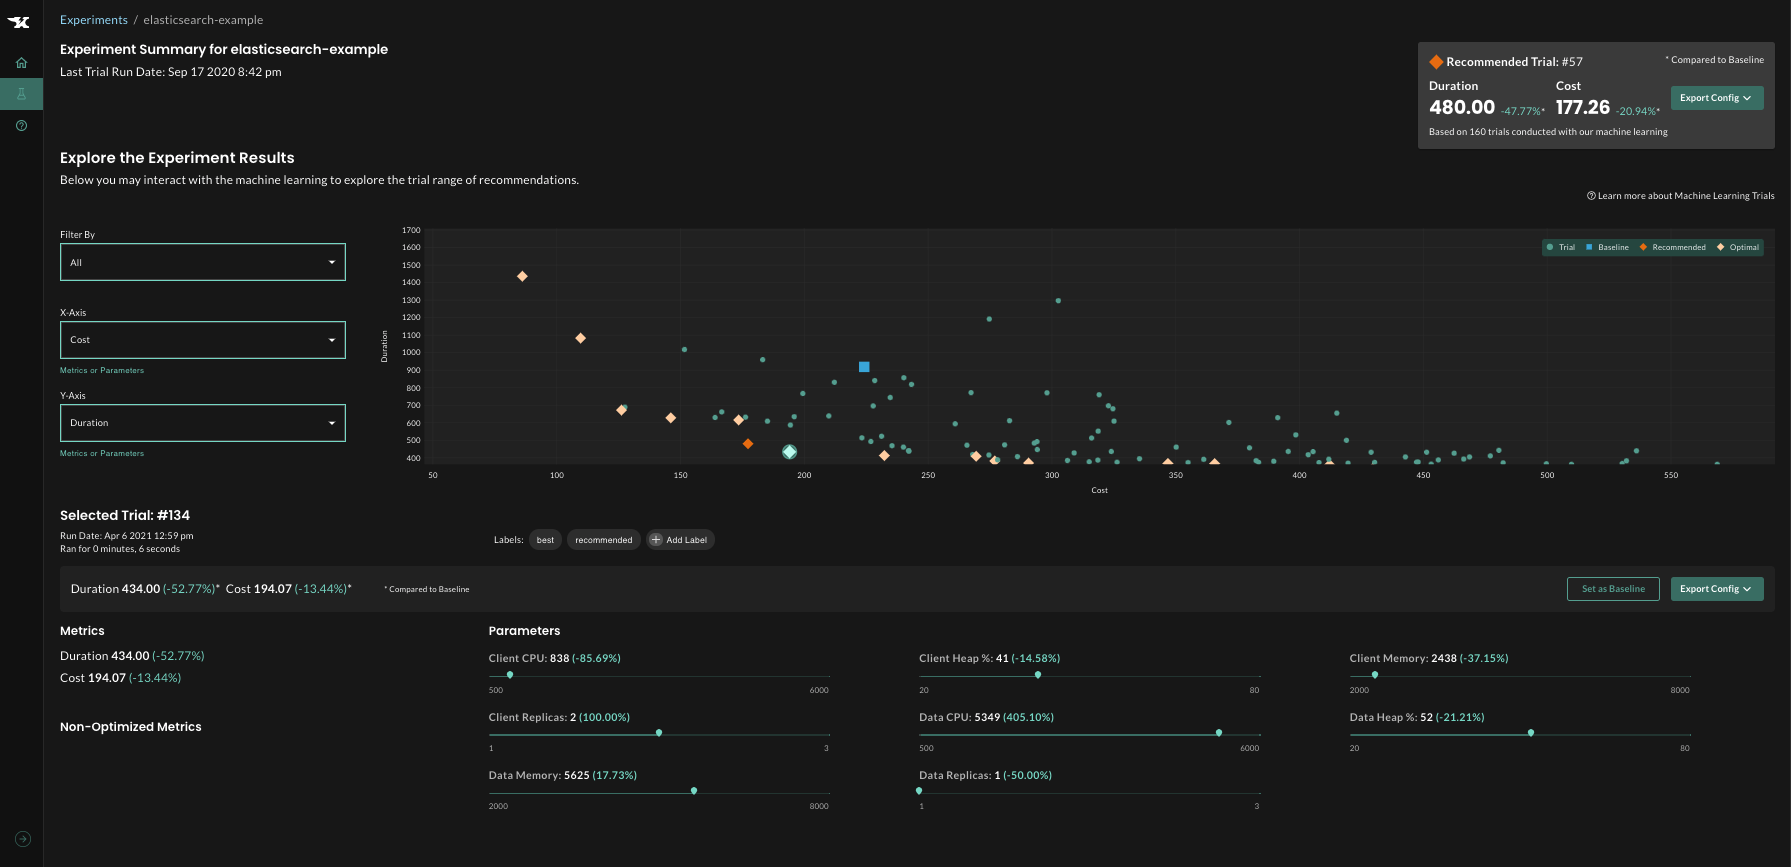
Step 5: Analyze Results
While machine learning automatically recommends the configuration that will result in optimal outcomes, additional analysis can be done once the experiment is complete. For example, you can visualize the trade-offs between two different goals, see which parameters have a significant impact on outcomes and which matter less.
Results are often surprising and can lead to key architectural improvements: for example, determining that a larger number of smaller replicas is more efficient than a smaller number of “heavier” replicas.
Observation-Based Optimization
While experimentation-based optimization is powerful for analyzing a wide range of scenarios, it’s impossible to anticipate every possible situation. Additionally, highly variable user traffic means that an optimal configuration at one point in time may not be optimal as things change. Kubernetes autoscalers can help, but they are based on historical usage and fail to take application performance into account.
This is where observation-based optimization can help. Let’s see how it works.
Step 1: Configure the Application
Depending on what optimization solution you’re using, configuring an application for observation-based optimization may consist of the following steps:
- Specify the namespace and, optionally, a label selector, to identify which resources to tune.
- Specify guardrails (min and max) for the CPU and memory parameters to be tuned.
- Specify how frequently the system should recommend updated parameter settings.
- Specify whether to deploy recommendations automatically or with approval.
Step 2: Machine Learning Analysis
Once configured, the machine learning engine begins analyzing observability data collected from Prometheus, Datadog, or other observability tools to understand actual resource usage and application performance trends. The system then begins making recommendations at the interval specified during configuration.
Step 3: Deploy Recommendations
If you specified automatic implementation of recommendations during configuration, the optimization solution will automatically patch deployments with recommended configurations as they are recommended. If you selected manual deployment, you can view the recommendation, including container-level details, before deciding to approve or not.
Best Practices
As you may have noted, observation-based optimization is simpler than experimentation-based approaches. It provides value faster with less effort, but on the other hand, experimentation- based optimization is more powerful and can provide deep application insights that aren’t possible using an observation-based approach.
Which approach to use shouldn’t be an either/or decision: both approaches have their place and can work together to close the gap between prod and non-prod. Here are some guidelines to consider:
- Because observation-based optimization is easy to implement and improvements can be seen quickly, it should be deployed broadly across your environment.
- For more complex or critical applications that would benefit from a deeper level of analysis, use experimentation-based optimization to supplement observation-based.
- Observation-based optimization can also be used to identify scenarios that warrant the deeper analysis provided by experimentation-based optimization.
- Then, use the observation-based approach to continually validate and refine the experimentation-based implementation in a virtuous cycle of optimization in your production environment.
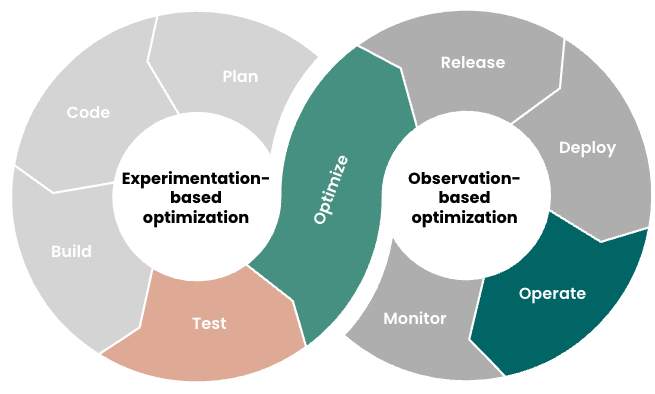
Figure 3: Using both experimentation-based and observation-based approaches creates a virtuous cycle of systematic, continuous optimization.
Conclusion
Optimizing our Kubernetes environment to maximize efficiency (performance versus cost), scale intelligently, and achieve our business goals requires:
- An ideal configuration of our application and environmental parameters prior to deployment
- Continuous monitoring and adjustment post-deployment
For small environments, this task is arduous. For an organization running apps on Kubernetes at scale, it is likely already beyond the scope of manual labor. Fortunately, machine learning can bridge the automation gap and provide powerful insights for optimizing a Kubernetes environment at every level.
Stay tuned for future articles in this series where we’ll explain how to tackle specific challenges involved in optimizing Java apps and databases running in containers.
Published at DZone with permission of Brian Likosar. See the original article here.
Opinions expressed by DZone contributors are their own.
Comments